
Key takeaways:
- Global equities advanced in February, with strong performance in Asia Pacific and Europe leading the gains. However, major U.S. benchmarks posted monthly declines as weakness in large‑cap tech and financials more than outweighed strength across other sectors.
- Global sovereign bonds delivered strong performance as yields fell across major markets. Global corporate bonds and securitized assets experienced solid gains, albeit with spreads widening from historically tight levels.
- February’s market performance reflected heightened dispersion beneath the surface. Artificial intelligence (AI) disruption fears weighed on software and technology-adjacent industries, while asset‑heavy and defensive sectors outperformed. Tariff uncertainty resurfaced, geopolitical tensions intensified, and private credit concerns flared up after some high-profile incidents.
Market overview
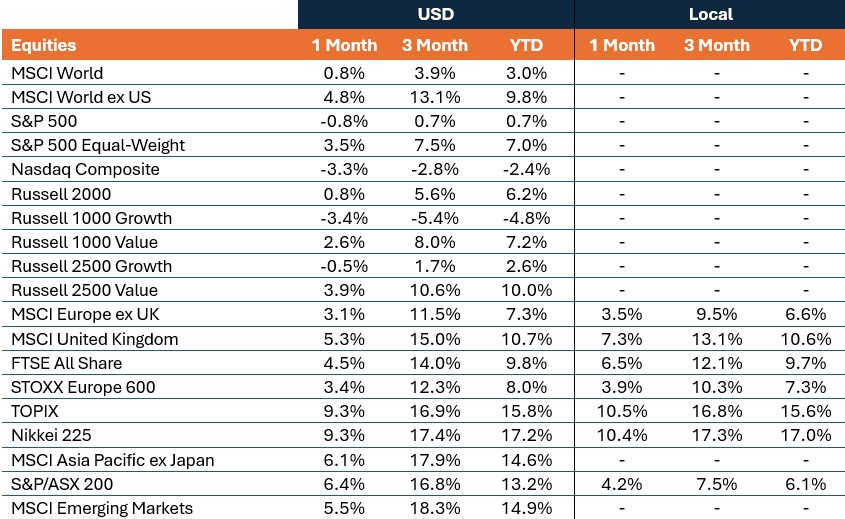
Global equities advanced in February, though performance diverged sharply by region as U.S. markets lagged while Asia Pacific and European markets extended recent strength. The MSCI World Index rose 0.8% in U.S. dollar terms, supported by continued outperformance outside the United States, while weakness in U.S. mega-cap technology weighed on returns. Global government bonds posted positive returns as yields declined across major developed markets, with risk sentiment periodically tested by tariff uncertainty, geopolitical developments, and shifting central bank expectations. Global corporate bonds also advanced, though high yield underperformed investment grade as credit spreads widened.
Oil prices rose, building on January’s strong gains, as volatile headlines around U.S.-Iran negotiations and broader Middle East tensions kept markets on edge. As of the final trading day, the two countries were set to continue negotiations in March, before tensions escalated sharply following U.S. and Israeli military strikes against Iran after February trading concluded. The U.S. Dollar Index strengthened, reversing part of its recent weakness as trade policy uncertainty resurfaced. Sterling fell 1.5% against the dollar, its biggest monthly decline since October 2025, pressured by political uncertainty and expectations of further Bank of England rate cuts. Gold continued its strong advance, rising more than 10% and ending higher for a seventh straight month.
Asia Pacific markets led global equities higher in February
U.S. equities lagged for a second straight month, weighing on returns for the MSCI World Index.
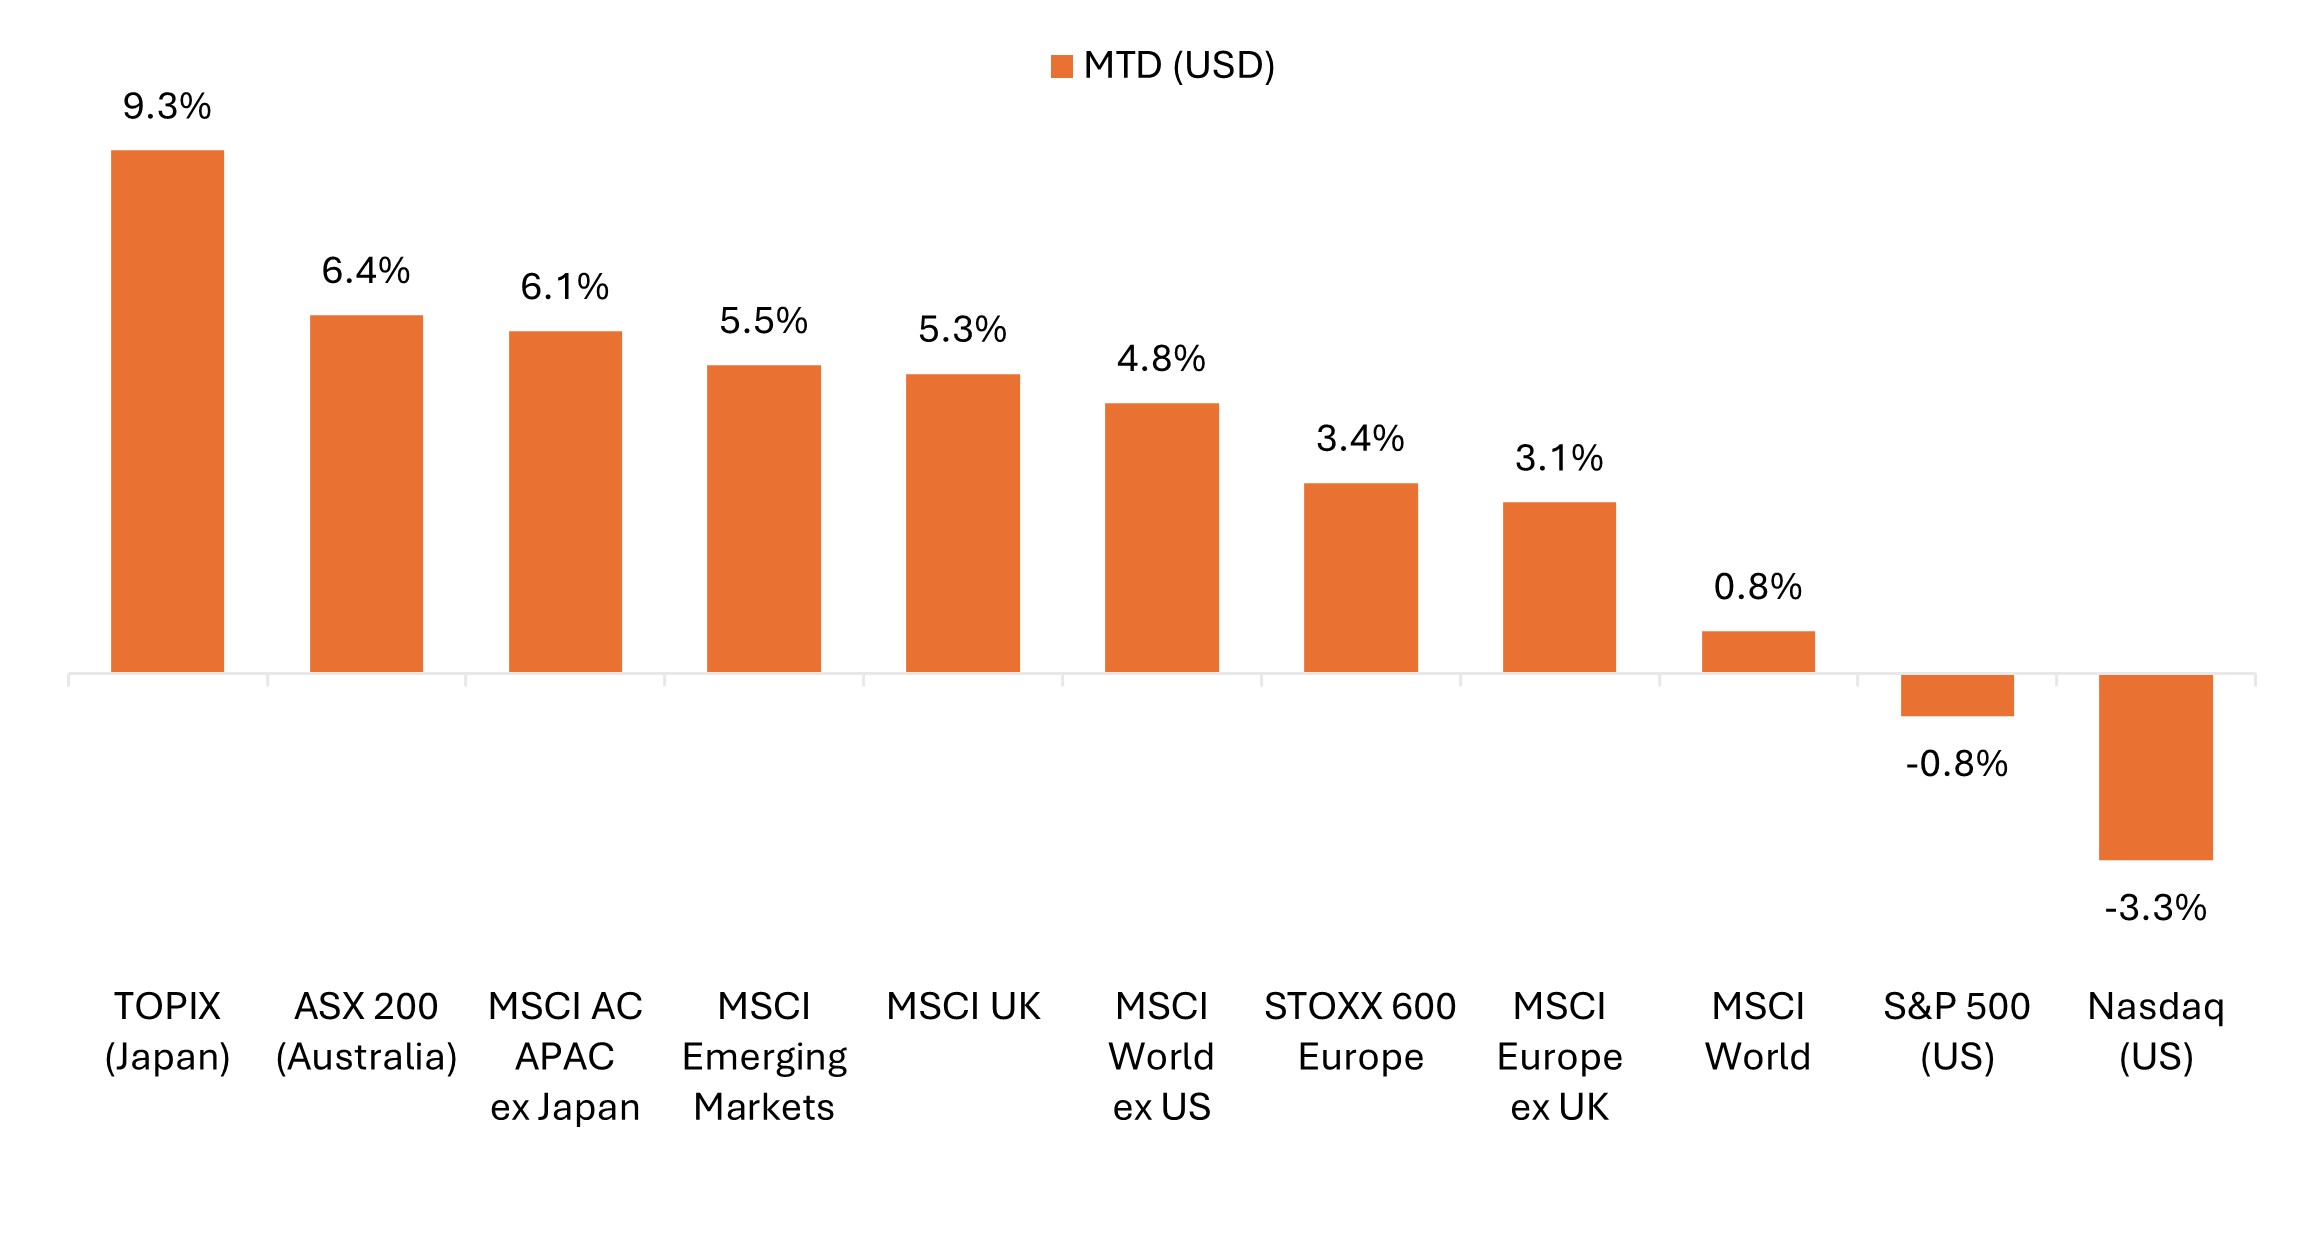
Source: Bloomberg, data from 31 January 2026 to 28 February 2026. Represents index total returns in U.S. dollar terms. Past performance is no guarantee of future results.
Key themes that mattered for markets
- AI disruption risk dominated the narrative: Updates from Anthropic and OpenAI highlighting advances in agentic AI workflows sparked selloffs across software, data, and payments stocks. Fears quickly spread to other corners of the market, including legal and tax planning firms, insurance and real estate brokers, online travel companies, and trucking and logistics names. Investors appeared to take a “shoot first” approach to AI disintermediation risk, while concerns around potential white-collar labor displacement contributed to a flight‑to‑safety bid for U.S. Treasuries.
- Rotation toward asset-heavy sectors gained momentum: Amid the AI-related volatility, a positive narrative formed around sectors viewed as more insulated from technological disruption. The so‑called “HALO” trade (hard‑asset, low‑obsolescence) gained traction, with energy, utilities, materials, and industrials posting solid gains for the month. In contrast, technology, communication services, and financials fell. Meanwhile, the equal-weight version of the S&P 500® Index notably outperformed the official cap-weighted benchmark as recent broadening beyond mega-cap tech continued.
- Tariff uncertainty returned following U.S. Supreme Court ruling: The Supreme Court struck down President Trump’s International Emergency Economic Powers Act (IEEPA) tariffs in a 6–3 ruling on February 20, forcing the administration to pursue alternative legal pathways. Trump subsequently ordered a 10% global tariff under Section 122 of the Trade Act of 1974 and vowed to raise them to 15% for select countries. Importantly, Section 122 tariffs expire in 150 days unless authorized by Congress. The developments injected fresh uncertainty around the durability of recent trade agreements and the treatment of billions of dollars in previously collected import duties.
- International equities outperformed major U.S. benchmarks (again): While major U.S. benchmarks recorded their worst monthly performance since last March, international stocks extended strong year-to-date gains. European indices set new all-time highs, supported by well-received corporate results and record share buybacks. And in contrast to U.S. technology shares that came under pressure in February, Asian technology stocks – heavily weighted toward semiconductors and AI infrastructure enablers – surged amid strong demand signals.
- Private credit stress reemerged as a watchpoint: Private credit markets faced renewed scrutiny following a handful of idiosyncratic developments. Blue Owl’s decision to halt investor withdrawals from a retail fund raised questions around liquidity, particularly for those exposed to software and AI‑linked borrowers. Separately, the late‑month collapse of UK mortgage provider Market Financial Solutions (MFS) weighed on financial stocks. These episodes reinforced a modest flight to quality, supporting Treasuries and widening investment-grade credit spreads from historically tight levels.
United States
U.S. equities were mixed in February, with headline index performance masking significant dispersion beneath the surface. Concerns around AI‑driven disruption weighed heavily on software and other technology‑adjacent industries. Meanwhile, stocks viewed as more insulated from these risks delivered strong gains, with utilities and energy leading the way, followed by materials, staples, and industrials. Lower bond yields also supported the rate-sensitive real estate sector, while a flattening yield curve and signs of idiosyncratic credit stress weighed on financials.
- The official cap-weighted S&P 500 declined 0.8%, while the equal-weight S&P 500 rose 3.5%, underscoring continued broadening beyond mega-cap tech. Year-to-date through February, the equal‑weight benchmark was up 7.0%, compared with a gain of less than 1.0% for the official S&P 500 Index.
- The Nasdaq Composite fell 3.3%, its weakest monthly performance since March 2025.
- The Russell 2000 advanced 0.8%, extending its recent run of relative strength versus large-cap benchmarks.
- Value outperformed growth for a fourth straight month. The Russell 1000 Value Index rose 2.6% in February while its growth counterpart fell 3.4%. Year to date, the large-cap value benchmark was up more than 7% through February, while the growth benchmark had fallen nearly 5% over that timeframe.
Sector performance reflected continued rotation away from big tech
S&P 500 sector performance (February and year to date)
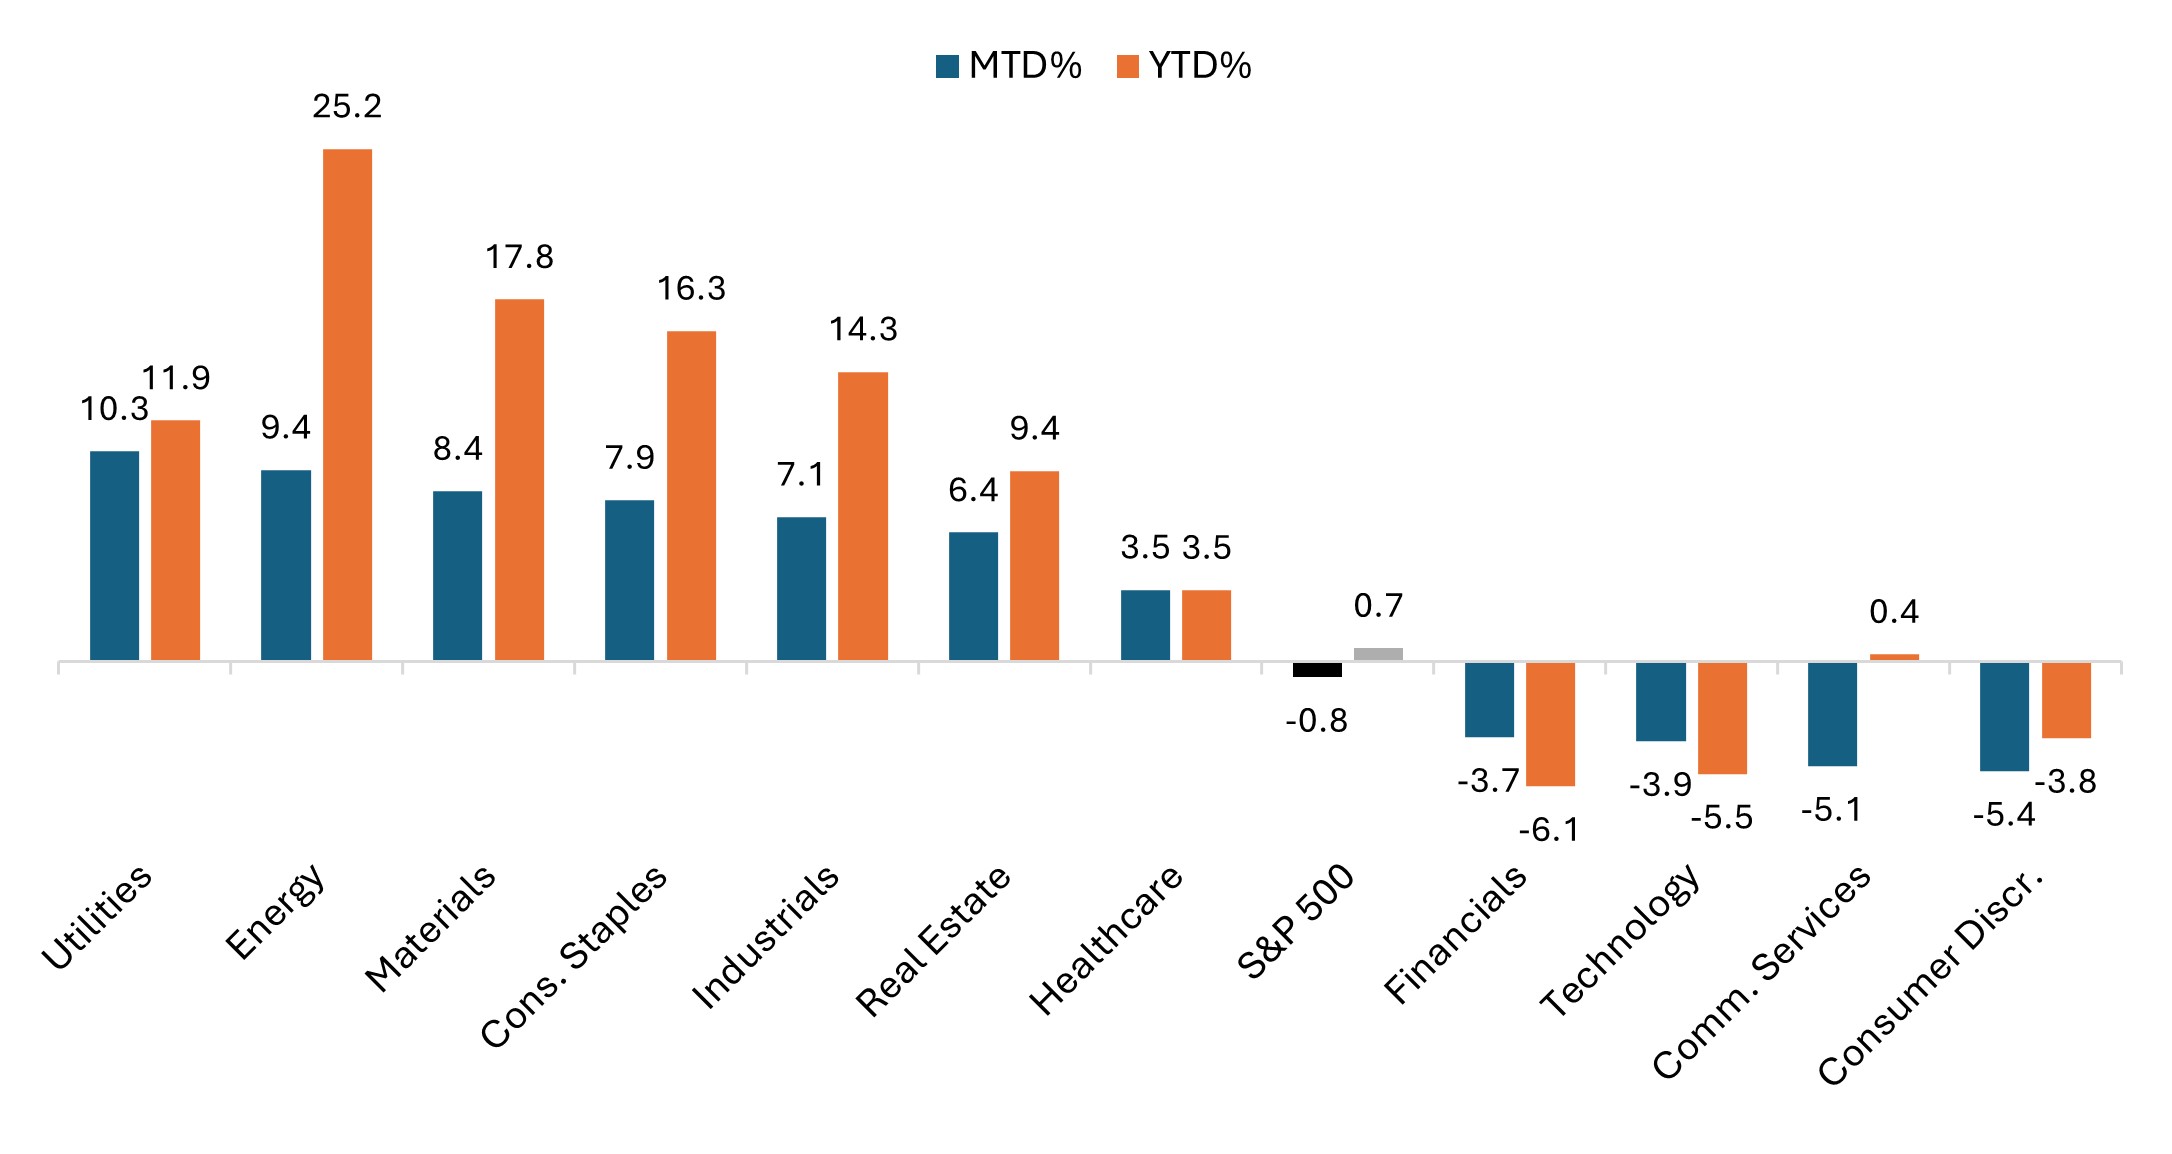
Source: Bloomberg, as of 28 February 2026. Past performance is no guarantee of future results.
Trade policy uncertainty and mixed economic signals shaped market sentiment during the month:
- The Federal Reserve (Fed) held policy steady, with communication reinforcing a data-dependent stance as markets continued to price in two rate cuts later in the year.
- The U.S. Supreme Court’s ruling against the Trump administration’s use of emergency IEEPA tariff powers reintroduced trade uncertainty, contributing to market volatility and currency swings.
- Inflation data was mixed. The U.S. Consumer Price Index (CPI) eased to 2.4% year over year in January, below consensus and down from 2.7% prior. However, a hotter-than-expected January Producer Price Index (PPI) report at the end of the month served as a reminder that upside risks to inflation remain.
- U.S. nonfarm payrolls showed a 130,000 jobs gain for January, well ahead of consensus estimates, while the unemployment rate edged down to 4.3% versus expectations for it to hold steady at 4.4%.
Europe
Eurozone equities delivered strong monthly gains, with several benchmarks reaching record highs, supported by solid corporate earnings and signs of economic stabilization. The MSCI Europe ex UK Index rose 3.5% in euro terms and 3.1% in U.S. dollars. France’s CAC 40 Index more than recouped the prior month’s losses, setting a fresh all-time high.
- The European Central Bank (ECB) left policy rates unchanged, as widely expected, reiterating a cautious stance amid easing inflation and uneven growth.
- Inflation pressures eased. Eurozone CPI cooled to 1.7% in January, down from 2.0% in December. Core inflation slowed to 2.2%, down from 2.3% prior, but remained above the ECB’s 2.0% target.
- Business activity indicators improved, as the flash Eurozone Composite Purchasing Managers’ Index (PMI) for February rose to 51.9, a three-month high. The flash reading for Manufacturing PMI registered 50.8, the highest level in 44 months.
- Trade policy uncertainty returned as the European Union postponed ratification of a U.S. trade agreement in response to Trump’s latest tariff proposals, though broader equity momentum remained intact.
UK equities posted solid gains in February, supported by improving business activity and shifting expectations around monetary policy. The MSCI United Kingdom Index rose 7.5% in sterling terms, while the FTSE All-Share Index gained 6.5% in local currency. The indices rose 5.3% and 4.5%, respectively, in U.S. dollar terms as sterling fell sharply amid the market repricing for a greater chance of multiple rate cuts this year from the Bank of England (BoE).
- The BoE held rates steady, though the closer-than-expected 5-4 vote was interpreted as increasingly dovish.
- UK unemployment rose to a nearly five-year high while wage growth cooled in February, which cemented investor expectations for two BoE rate cuts in 2026.
- UK GDP growth remained modest, with fourth quarter output expanding just 0.1% quarter on quarter, below consensus for 0.2% and unchanged from the prior quarter.
- Business surveys showed continued improvement. The UK flash Composite PMI for February rose to 53.9, a 22-month high, as a stronger Manufacturing PMI reading offset a modest dip in Services.
- Political uncertainty weighed on sterling throughout February, with the pound posting its biggest monthly drop against the euro since June of last year. Prime Minister Starmer faced mounting pressure after a late-month by-election defeat for the Labour party.
European equities put in solid performance led by the UK and France
Divergence between local currency and U.S. dollar returns was most pronounced for UK equities as the pound weakened.
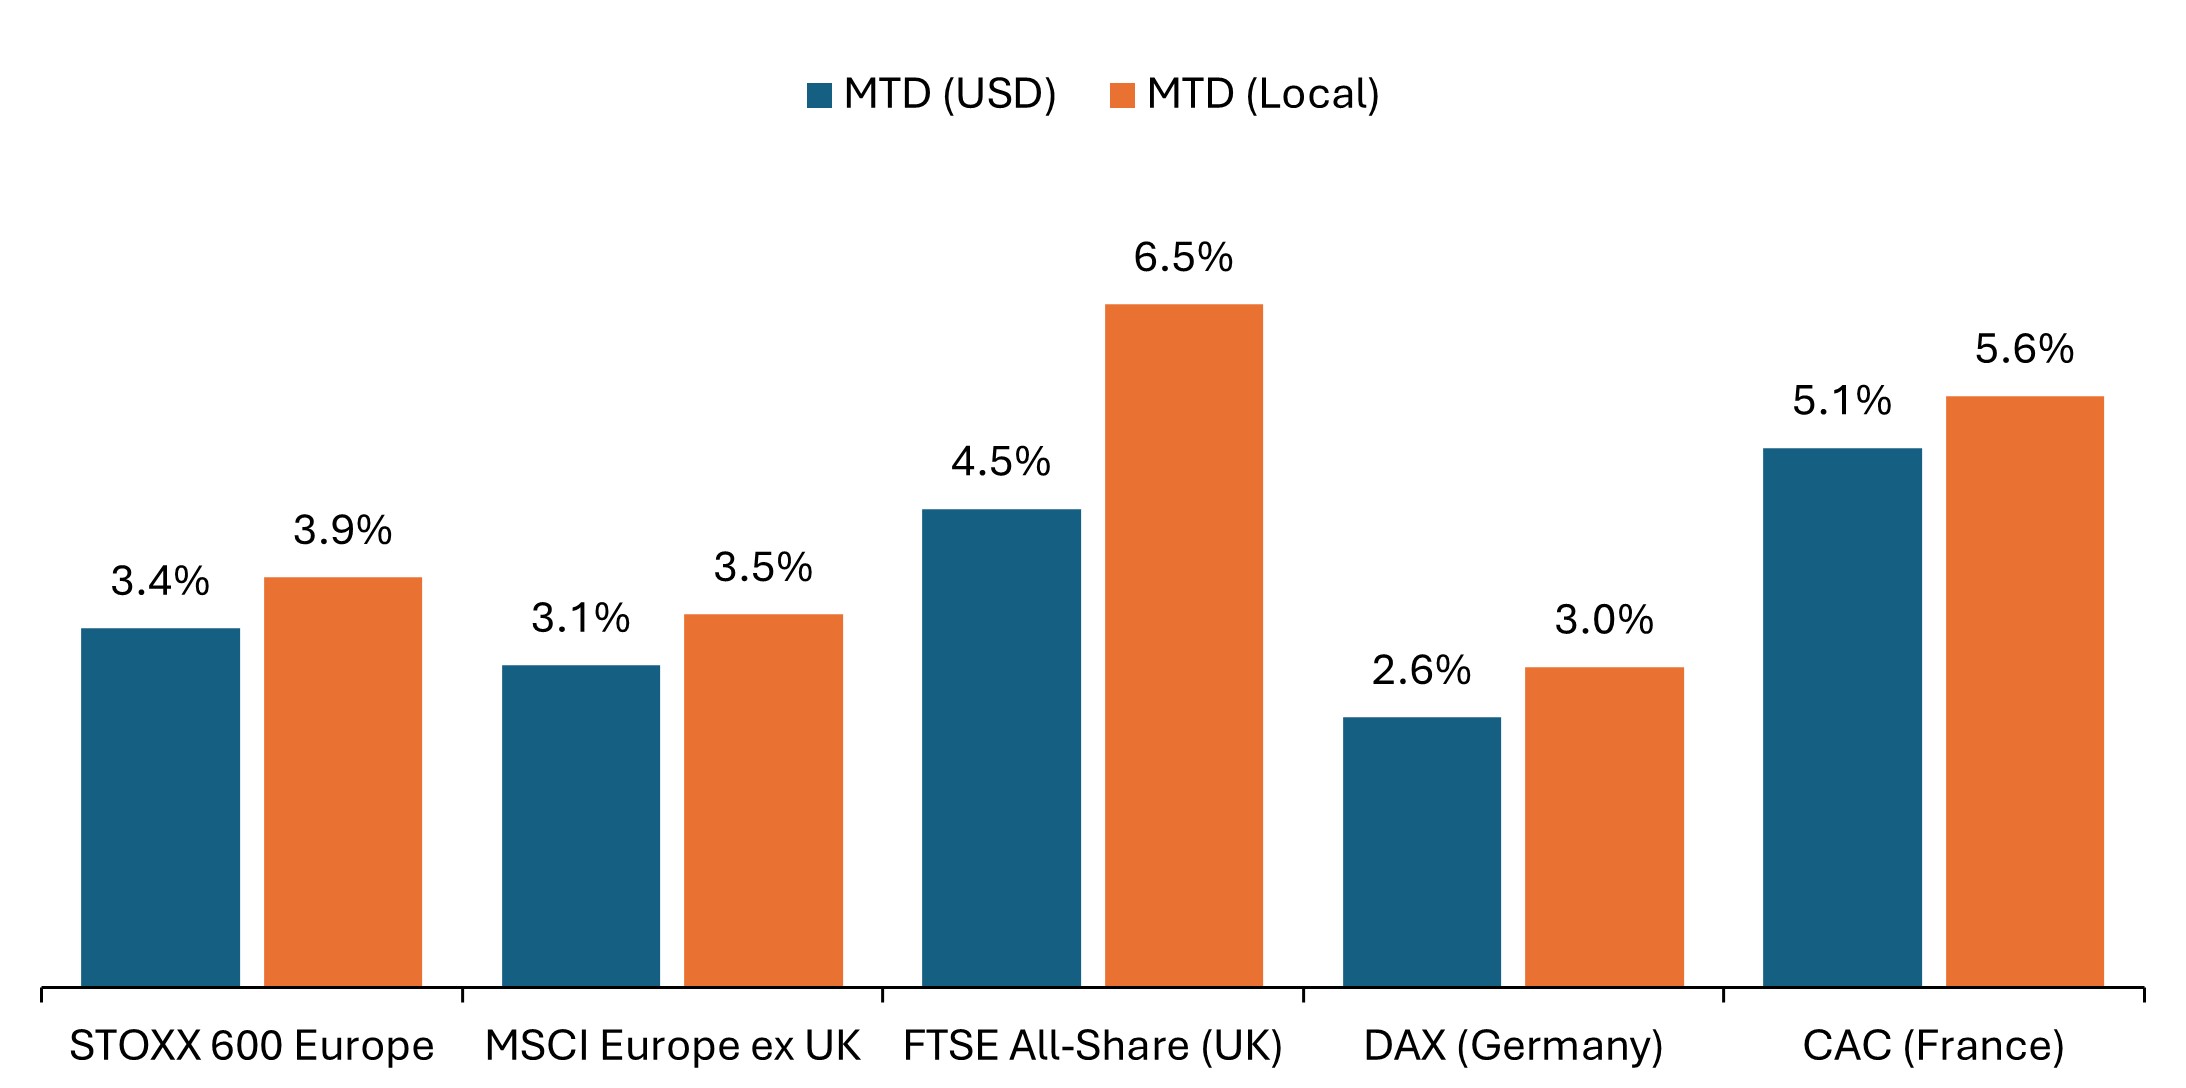
Source: Bloomberg, data from 31 January 2026 to 28 February 2026. Past performance is no guarantee of future results.
Across the STOXX 600 Index – comprising companies from 17 countries across developed Europe including the UK – sector performance was broadly positive, with commodity linked and defensive areas leading.
- Telecommunications (+15.7% in euro terms), Energy (+9.3%), Basic Resources (+8.7%), and Utilities (+8.4%) were among the strongest performers, supported by higher commodity prices and infrastructure-related investment themes. More traditionally defensive sectors such as Personal Care, Drug & Grocery (+11.4%), Food, Beverage & Tobacco (+9.4%) also posted strong gains.
- Financial Services (-1.9%) and Banks (-1.1%) were among the notable laggards, weighed down by a flattening yield curve and renewed concerns around idiosyncratic credit risk.
- Technology (-0.8%) also declined, while Media (-5.8%) was the weakest‑performing sector amid heightened sensitivity to AI‑related business‑model risks.
Asia Pacific
Japanese equities rallied sharply in February, buoyed by Prime Minister Takaichi’s landslide victory in the general election. The TOPIX rose 9.3% in yen terms and 10.5% in U.S. dollar terms, while the Nikkei 225 posted similar gains. Both benchmarks recorded fresh record highs, with investors anticipating increased government spending in semiconductors, defense, and AI-related sectors.
- The decisive election outcome, which delivered Takaichi’s party a two-thirds supermajority, reduced uncertainty around fiscal policy and reinforced expectations for expansionary government spending.
- Late in the month, PM Takaichi nominated two dovish economists to the Bank of Japan’s board, triggering a rise in longer-term bond yields and yen weakness as investors priced in a more gradual tightening path.
- Technology and industrial stocks led the gains, supported by global semiconductor demand.
Asia Pacific ex Japan equities extended their rally, supported by strong performance in technology-heavy markets. The MSCI AC Asia Pacific ex Japan Index rose 6.1% in U.S. dollar terms. South Korea and Taiwan delivered outsized gains, driven by chipmakers amid strong earnings momentum and export strength. Australia’s ASX 200 rose 6.4%, although the benchmarks rose a more modest 4.2% in local currency terms. The Australian dollar rose sharply as Reserve Bank of Australia (RBA) became the first major central bank to raise rates in 2026, while hotter inflation late in the month cemented investor bets for additional rate hikes. China lagged regional peers, pressured by weak consumer demand and persistent deflationary pressures. The MSCI China Index fell 5.8% in U.S. dollar terms.
Emerging Markets
Emerging market equities advanced in February, supported by strong performance in select Asian and Latin American markets. The MSCI Emerging Markets Index rose 5.5% in U.S. dollar terms. All performance figures below reference MSCI country indices reported in U.S. dollar terms.
- MSCI South Korea (+22.6%) and Taiwan (+12.3%) extended strong year-to-date gains, led by technology stocks amid strong demand for semiconductors and rising memory storage prices.
- Latin America markets were mixed. Mexico (+7.2%) and Brazil (+3.9%) posted gains, supported by higher commodity prices and improving domestic sentiment. Argentina (-11.8%) underperformed. Across EMEA, South Africa (+10.4%) outperformed, with miners higher amid rising gold prices.
- India (+1.1%) underperformed as IT services stocks sold off amid concerns about AI-driven margin pressures.
Fixed Income
Global government bonds delivered strong returns in February as yields declined across major markets. Late-month performance was supported by an apparent flight to safety bid amid volatile geopolitical headlines, including heightened tensions between the U.S. and Iran. That dynamic reversed sharply on the first day of March trading, with sovereign yields rising as concerns about energy-driven inflation (higher oil prices) and risk premiums overshadowed safe-haven demand.
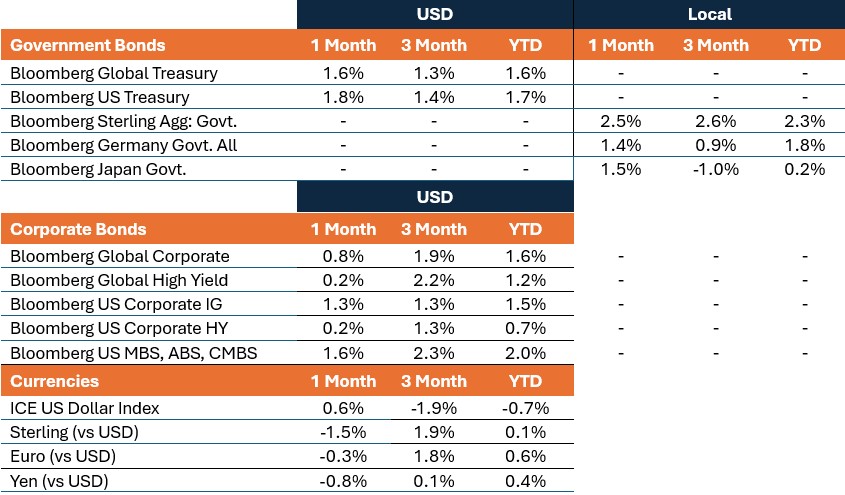
- The Bloomberg Global Treasury Index rose 1.6% in U.S. dollar terms, supported by falling yields in the United States, Europe, and the United Kingdom.
- The U.S. Treasury curve flattened as yields fell across maturities. The spread between 10-year and 2-year yields narrowed from 74 basis points (bps) at the start of the month to 59 bps by the month’s end.
- The U.S. 10-year Treasury yield fell 29 basis points, ending the month below 4.0%.
U.S. Treasury yield curve (month-on-month change)
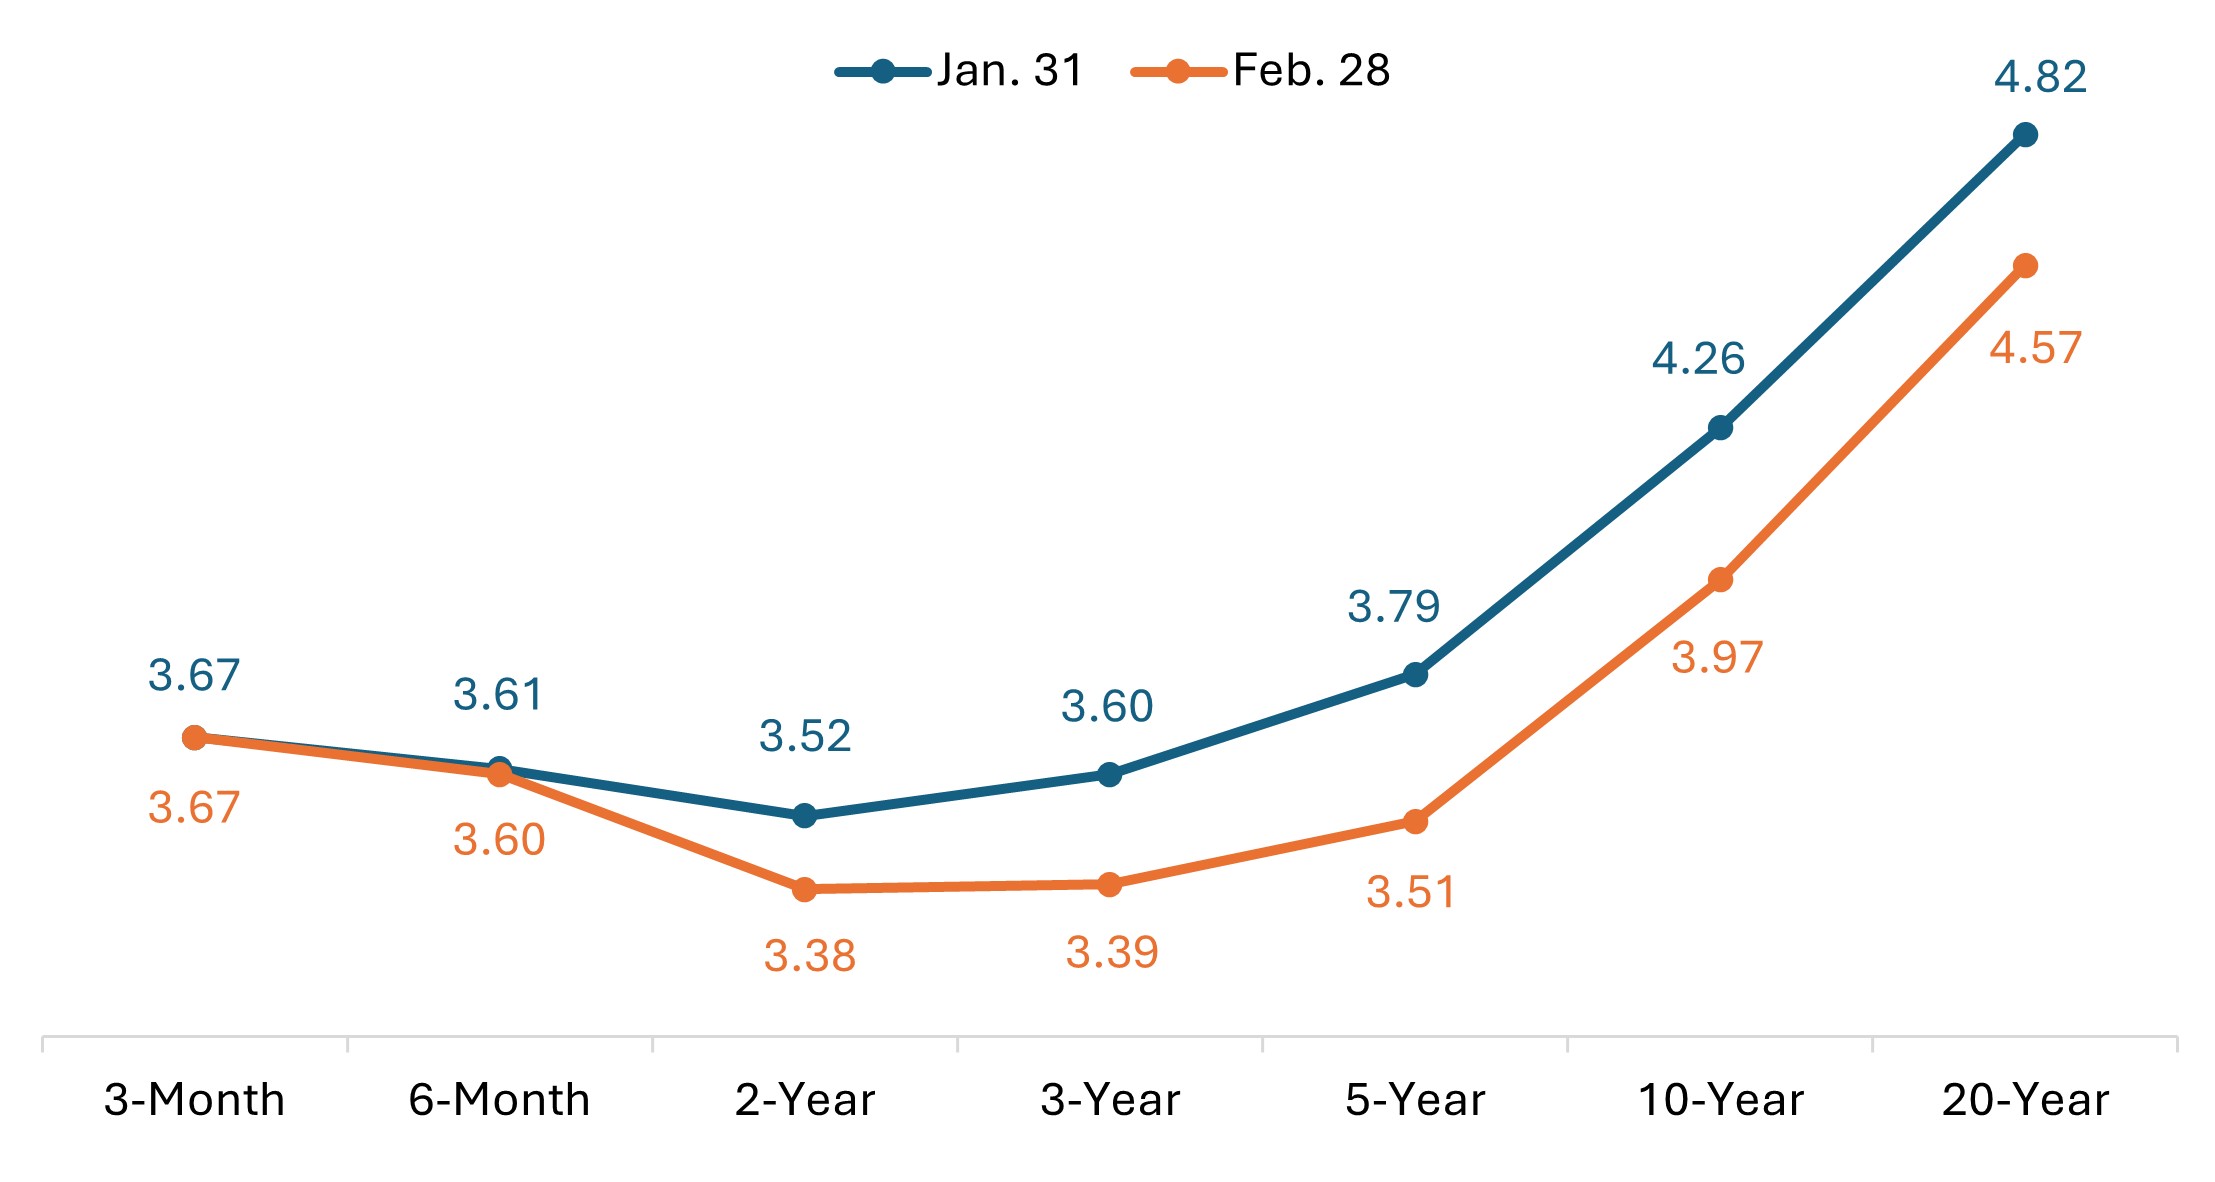
Source: Bloomberg, U.S. Treasury, as of 28 February 2026. Past performance is no guarantee of future results.
- In Europe, UK government bonds outperformed. The 10-year Gilt yield fell nearly 30 bps on the month to its lowest level since late 2024 amid dovish BoE signals.
- German sovereign bonds were broadly higher. The yield on the 10-year bund fell roughly 20 bps in February.
- Japanese government bonds (JGB) also delivered strong monthly returns. The yield on the 10-year JGB fell 8 bps but remained above 2.0% for a third consecutive month.
Spread sectors delivered positive returns, though option-adjusted spreads (OAS) widened over the course of the month. This dynamic was most evident in high-yield bonds as signs of idiosyncratic credit stress – including developments in private markets and the collapse of UK lender MFS – weighed on lower-quality credits. Even so, corporate credit spreads, particularly within investment grade, remain well below long‑term averages, with February’s moves reflecting a modest repricing rather than concerns around widespread contagion.
- The Bloomberg Global Aggregate Corporate Index rose by 0.8% in U.S. dollar terms, while the Bloomberg Global High Yield Index gained a more modest 0.2%.
- Global investment grade spreads widened by approximately 10 bps, while high-yield spreads widened by roughly 25 bps.
- U.S. investment grade corporate spreads widened by roughly 11 bps, though remained near multi-decade lows. U.S. high yield spreads widened by roughly 26 bps.
- In securitized markets, asset-backed securities (ABS) and mortgage-backed securities (MBS) spreads widened by approximately 5 bps.
Central Bank Watch
February kicked off with several notable monetary policy decisions, reinforcing policy divergence as a defining theme for 2026. The Reserve Bank of Australia became the first G7 central bank to raise rates this year, while the BoE and the ECB left rates unchanged. Markets continue to price in further easing in the U.S. and UK, in contrast with an extended pause from the ECB and Bank of Canada and additional rate hikes from the RBA and Bank of Japan.
- Reserve Bank of Australia (Feb. 3): Raised the cash rate target by 25 bps to 3.85%. The move came just six months after its last rate cut. Policymakers pointed to persistent inflation pressures and tight labor market conditions. Markets interpreted the move as a shift toward a renewed tightening phase, with Australia now alongside Japan as the only major economies expected to deliver rate hikes this year. Hotter-than-expected January inflation data released late in the month reinforced expectations for another rate hike in May.
- Bank of England (Feb. 5): Held the Bank Rate at 3.75% in a narrow 5-4 vote, a more dovish outcome than markets had anticipated. Four policymakers favored an immediate rate cut, prompting investors to pull forward expectations for the next easing move. Softer economic data throughout the month reinforced that view, with markets pricing in roughly 50 bps of easing in 2026 and the first cut seen as early as March.
- European Central Bank (Feb. 5): Left the deposit facility rate unchanged at 2.0% for a fifth consecutive meeting, in line with expectations. The ECB reiterated its data‑dependent stance, citing improving inflation dynamics and economic resilience while offering little signal that policy easing is imminent. President Lagarde acknowledged recent euro strength could weigh on inflation over time but downplayed it as a near‑term catalyst for rate cuts.
- Other central banks: Elsewhere, policymakers largely stayed on hold. The Bank of Mexico left its overnight rate unchanged at 7.0%, emphasizing caution amid lingering inflation risks. The Reserve Bank of India held its policy rate at 5.25% and maintained its policy stance at neutral. Governor Malhotra said recent trade deals with the U.S. and the EU would support the economic outlook. New Zealand’s central bank left the cash rate at 2.25% and signaled an extended pause as it monitors a “nascent” economic recovery. The People’s Bank of China left its one-year and five-year loan prime rates unchanged at 3.0% and 3.5%, respectively, for a ninth straight month, matching expectations. The Bank of Korea left its benchmark rate unchanged at 2.50%, as expected, and signaled an extended pause. Meanwhile, the Bank of Russia lowered its key rate by 50 bps to 15.5% and signaled that further cuts could follow as it contends with a slowing wartime economy strained by high borrowing costs.
Key events on tap in March
- Mar. 2 – Global Manufacturing PMIs (February)
- Mar. 3 – Eurozone Consumer Price Index (February, preliminary)
- Mar. 4 – Global Services and Composite PMIs (February)
- Mar. 6 – U.S. Nonfarm Payrolls, Unemployment Rate (February)
- Mar. 11 – U.S. Consumer Price Index (February)
- Mar. 16 – Reserve Bank of Australia (RBA) Rate Decision
- Mar. 18 – Eurozone Consumer Price Index (February, final)
- Mar. 18 – Bank of Canada (BoC) Rate Decision
- Mar. 18 – FOMC (Fed) Rate Decision
- Mar. 19 – Bank of Japan (BoJ) Rate Decision
- Mar. 19 – Bank of England (BoE) Rate Decision
- Mar. 19 – European Central Bank (ECB) Rate Decision
- Mar. 19 – UK Unemployment Rate (November to January)
- Mar. 20 – People’s Bank of China (PBOC) Rate Decision
- Mar. 25 – UK Consumer Price Index (February)
Market Performance
Total returns (%), periods ended February 28, 2026
Bloomberg Asian-Pacific Japan Government-Related Index is a fixed-rate, investment grade, JPY-denominated benchmark that includes debt from government-related issuers.
Bloomberg Germany Government All Bonds Index measures the performance of German government bonds (Bunds) issued by the German government.
Bloomberg Global Aggregate – Corporate Index is a flagship measure of global investment grade, fixed-rate corporate debt. This multi-currency benchmark includes bonds from developed and emerging markets issuers.
Bloomberg Global High Yield Index is a multi-currency flagship measure of the global high yield debt market. The index represents the union of the US High Yield, the Pan-European High Yield, and Emerging Markets (EM) Hard Currency High Yield Indices.
Bloomberg Global Treasury Index tracks fixed-rate, local currency government debt of investment grade countries, including both developed and emerging markets.
Bloomberg Sterling Aggregate: Government Index measures the performance of UK government bonds (Gilts) within the broader Bloomberg Sterling Aggregate Index, which covers the investment-grade, fixed-rate, sterling-denominated bond market.
Bloomberg US Corporate Bond Index measures the investment grade, fixed-rate, taxable corporate bond market. It includes USD-denominated securities from US and non-US issuers.
Bloomberg US Corporate High Yield Bond Index measures the USD-denominated, high yield, fixed-rate corporate bond market. Bonds from issuers with an emerging markets country of risk, based on Bloomberg EM country definition, are excluded.
Bloomberg US Securitized: MBS, ABS, and CMBS Index tracks all USD-denominated, investment grade, securitized issues within the Bloomberg US Aggregate Index.
Bloomberg US Treasury Index measures U.S. dollar-denominated, fixed-rate, nominal debt issued by the U.S. Treasury.
The DAX is a blue-chip stock market index consisting of the 40 major German companies trading on the Frankfurt Stock Exchange.
The France 40 Index is a market value weighted index, composed of the 40 highest levels among the 100 highest market caps on the Paris Bourse.
FTSE All-Share Index reflects the equity market performance of the United Kingdom. The index includes nearly all eligible companies on the London Stock Exchange, covering large, mid, and small-cap stocks.
ICE U.S. Dollar Index is a benchmark measuring the U.S. dollar’s value against a basket of six major world currencies (Euro, Yen, Pound Sterling, Canadian Dollar, Swedish Krona, Swiss Franc).
MSCI AC Asia Pacific ex Japan Index reflects the equity market performance of the Asia Pacific region, excluding Japan, covering both developed and emerging markets.
The MSCI ACWI ex USA Index captures large- and mid-cap representation across 22 of 23 developed markets (excluding the US) and 24 emerging markets countries.
MSCI Emerging Markets Index reflects the equity market performance of emerging markets.
MSCI Europe Index reflects the equity market performance of large and mid-sized companies listed in developed markets in Europe.
MSCI Europe ex UK Index reflects the equity market performance of large and mid-sized companies listed in developed markets in Europe excluding the United Kingdom.
MSCI United Kingdom Index reflects the equity market performance of large and mid-sized companies listed in the UK market.
MSCI World Index captures large- and mid-cap representation across 22 of 23 developed markets countries, excluding the United States.
MSCI World ex USA Index reflects the equity market performance of global developed markets excluding the United States.
NASDAQ Composite Stock Index: National Association of Securities Dealers Automated Quotation System (NASDAQ) is a nationwide computerized quotation system for over 5,500 over-the-counter stocks. The index is compiled of more than 4,800 stocks that are traded via this system.
Nikkei 225 Index (also known as Nikkei Stock Average): A measure of Japanese equity market performance. The index includes 225 of the largest companies listed on the Tokyo Stock Exchange.
Purchasing Managers’ Index (PMI) is an index of the prevailing direction of economic trends in the manufacturing and service sectors, based on a survey of private sector companies.
Russell 1000® Growth Index reflects the performance of U.S. large-cap equities with higher price-to-book ratios and higher forecasted growth values.
Russell 1000® Value Index reflects the performance of U.S. large-cap equities with lower price-to-book ratios and lower forecasted growth values.
Russell 2000® Index reflects the performance of U.S. small-cap equities.
Russell 2500™ Growth Index reflects the performance of U.S. small to mid-cap equities with higher price-to-book ratios and higher forecasted growth values.
Russell 2500™ Value Index reflects the performance of U.S. small to mid-cap equities with lower price-to-book ratios and lower forecasted growth values.
S&P 500® Index reflects U.S. large-cap equity performance and represents broad U.S. equity market performance.
S&P 500 Equal Weight Index (EWI) is the equal-weight version of the S&P 500. The index includes the same constituents as the capitalization weighted index, but each company is allocated a fixed weight – or 0.2% of the index total at each quarterly rebalance.
S&P/ASX 200 Index reflects the performance of the 200 largest, most liquid companies listed on the Australian Securities Exchange (ASX).
STOXX Europe 600 Index: An index of the 600 largest listed stocks in the European equity market, comprising 17 countries and 11 industries
TOPIX: A capitalization-weighted index of all the companies listed on the First Section of the Tokyo Stock Exchange and is widely regarded as a broad benchmark for Japanese stock prices.
10-year bond: A bond that is set to mature (repay the principal value) in 10 years.
10-Year Treasury Yield is the interest rate on U.S. Treasury bonds that will mature 10 years from the date of purchase.
Agency Mortgage-backed Securities (Agency MBS): A type of asset-backed security that is specifically secured by a collection of mortgages.
Asset-backed Securities (ABS): These are financial instruments that are backed by a pool of assets—typically those that generate a cash flow from debt, such as loans, leases, credit card balances, or receivables.
Basis point: One basis point (bp) equals 1/100 of a percentage point, 1bp = 0.01%.
Bund yield: Bund yields are viewed as benchmark yield indicators for European government bonds; those with a 10-year maturity are considered to be the German equivalent of U.S. Treasury bonds.
Commercial Mortgage-backed Securities (CMBS): A type of mortgage-backed security that is secured by the loan on commercial real estate properties rather than residential real estate.
Consumer Price Index (CPI): A measure that examines the price change of a basket of consumer goods and services over time. It is used to estimate inflation.
Credit spread: The difference in yield between securities with similar maturity but different credit quality. Widening spreads generally indicate deteriorating creditworthiness of corporate borrowers, and narrowing indicate improving.
Curve/Yield curve: A yield curve plots the yields (interest rate) of bonds with equal credit quality but differing maturity dates. Typically bonds with longer maturities have higher yields.
The Federal Open Market Committee (FOMC) is the body of the Federal Reserve System that sets national monetary policy.
Fiscal policy: Describes government policy relating to setting tax rates and spending levels. Fiscal policy is separate from monetary policy, which is typically set by a central bank.
Gilt yield: Gilt yields are viewed as benchmark yield indicators for United Kingdom government bonds; those with a 10-year maturity are considered to be the UK equivalent of U.S. Treasury bonds.
Hawkish policy aims to curb inflation and slow down growth in the economy by raising interest rates and reducing the supply of money.
High yield bond: Also known as a sub-investment grade bond, or ‘junk’ bond. These bonds usually carry a higher risk of the issuer defaulting on their payments, so they are typically issued with a higher interest rate (coupon) to compensate for the additional risk.
Inflation: The rate at which the prices of goods and services are rising in an economy. The Consumer Price Index (CPI) and Retail Price Index (RPI) are two common measures.
Investment grade bond: A bond typically issued by governments or companies perceived to have a relatively low risk of defaulting on their payments, reflected in the higher rating given to them by credit ratings agencies.
JGB yield: JGB yields are viewed as benchmark yield indicators for Japanese government bonds; those with a 10-year maturity are considered to be the Japanese equivalent of U.S. Treasury bonds.
Monetary policy: The policies of a central bank, aimed at influencing the level of inflation and growth in an economy. Monetary policy tools include setting interest rates and controlling the supply of money. Dovish policy aims to stimulate economic growth by lowering interest rates and increasing the money supply.
Option-Adjusted Spread (OAS) measures the spread between a fixed-income security rate and the risk-free rate of return, which is adjusted to take into account an embedded option.
Securitization: The process in which certain types of assets are pooled so that they can be repackaged into interest-bearing securities. The interest and principal payments from the assets are passed through to the purchasers of the securities.
U.S. Treasury securities are direct debt obligations issued by the U.S. Government. Treasury Bills and U.S. Government Bonds are guaranteed by the full faith and credit of the U.S. government, are generally considered to be free of credit risk.
Volatility measures risk using the dispersion of returns for a given investment.
Quantitative Easing (QE) is a government monetary policy occasionally used to increase the money supply by buying government securities or other securities from the market.
Yield: The level of income on a security over a set period, typically expressed as a percentage rate. For equities, a common measure is the dividend yield, which divides recent dividend payments for each share by the share price. For a bond, this is calculated as the coupon payment divided by the current bond price.
IMPORTANT INFORMATION
Equity securities are subject to risks including market risk. Returns will fluctuate in response to issuer, political and economic developments.
Fixed income securities are subject to interest rate, inflation, credit and default risk. As interest rates rise, bond prices usually fall, and vice versa. High-yield bonds, or “junk” bonds, involve a greater risk of default and price volatility. Foreign securities, including sovereign debt, are subject to currency fluctuations, political and economic uncertainty and increased volatility and lower liquidity, all of which are magnified in emerging markets.
Securitized products, such as mortgage- and asset-backed securities, are more sensitive to interest rate changes, have extension and prepayment risk, and are subject to more credit, valuation and liquidity risk than other fixed-income securities.
These are the views of the author at the time of publication and may differ from the views of other individuals/teams at Janus Henderson Investors. References made to individual securities do not constitute a recommendation to buy, sell or hold any security, investment strategy or market sector, and should not be assumed to be profitable. Janus Henderson Investors, its affiliated advisor, or its employees, may have a position in the securities mentioned.
Past performance does not predict future returns. The value of an investment and the income from it can fall as well as rise and you may not get back the amount originally invested.
The information in this article does not qualify as an investment recommendation.
There is no guarantee that past trends will continue, or forecasts will be realised.
Marketing Communication.