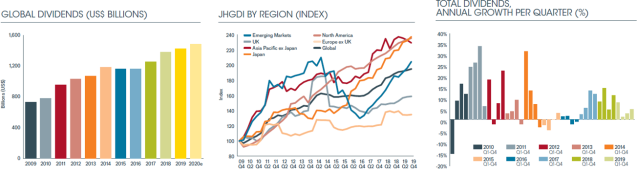
- Global dividends rose 3.5% on a headline basis to a record $1.43 trillion; the underlying growth rate was 5.4% with the headline growth rate held back by dollar strength
- North America, emerging markets and Japan drove growth higher
- Europe and the UK lagged behind the global average
- Q4 followed the annual trend with underlying growth of 4.8%
- Over the last decade, global dividend payments have totalled $11.4 trillion and have grown 97% in underlying terms (7.0% per annum)
- Janus Henderson expects underlying growth of 4.0% in 2020, delivering a total of $1.48 trillion, 3.9% higher than 2019 on a headline basis
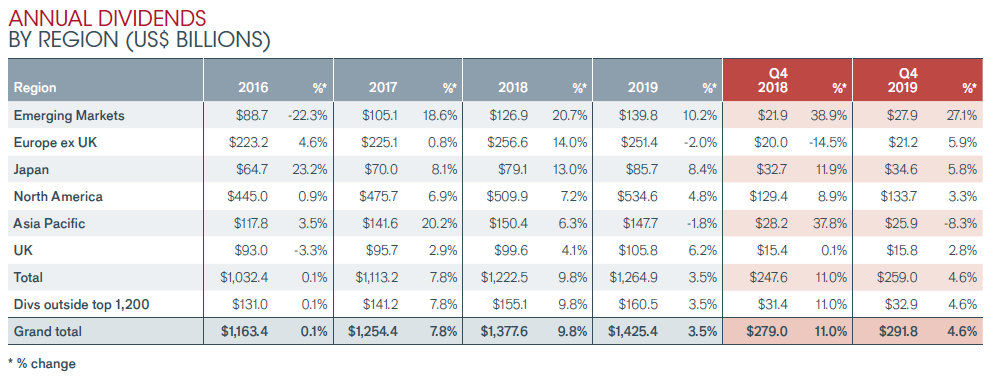
Global dividends rose to a new record of $1.43 trillion in 2019, up 3.5% on headline basis according to the latest Janus Henderson Global Dividend Index. The underlying growth rate, which adjusts for 2019’s stronger US dollar, unusually high special dividends and other technical factors was 5.4% and was driven by North America, emerging markets and Japan. New annual records were set in the US, Canada, Japan, Russia and France.
Even so, the more challenging global economic backdrop meant 2019 saw the slowest rate of growth since 2016, with Asia Pacific ex Japan, the UK and Europe ex UK all lagging behind the global average. From a sector perspective, the fastest growth came from the oil sector, with dividends rising by a tenth, while telecoms saw payouts fall.
The fourth quarter continued the trend seen through the rest of the year, although there was some loss of momentum in the rate of growth in North America related to a slowdown in earnings growth. Q4 dividends rose 4.6% to a record $291.8bn, equivalent to an underlying 4.8% increase.
The last decade has seen extremely strong dividend growth, coming off the low base set in 2009 following the financial crisis. Payouts have almost doubled (+95% on a headline basis, +97% in underlying terms), meaning that income investors in 2019 received $694bn more in dividends than they did ten years before. Moreover, in the last ten years the world’s companies have paid their shareholders an astonishing $11.4 trillion in total.
North American dividends have risen 136% over the last decade, second only to Japan, and have contributed half of the world’s ten-year dividend growth. In 2019, US payouts rose 6.8% on an underlying basis, reaching a record $490.8bn, though the second half of the year saw slower growth than the first. Double-digit dividend increases from almost every bank were the most significant growth driver: US banking dividends have doubled in the last five years alone, putting them well ahead of any other sector. Canadian dividends grew faster than any other major developed economy in 2019, up 9.5% on an underlying basis to a record $43.8bn, thanks in particular to the banking and energy sectors.
Japan enjoyed its fifth consecutive year of world-beating dividend growth, posting a new record, but elsewhere in Asia, the slower pace of global economic growth and the impact of trade tensions took their toll. South Korea saw the greatest weakness, while Taiwan saw two thirds of companies cut their dividends. Australian dividends fell 3.3%, after adjusting for large special payments from BHP and Rio Tinto. Two fifths of Australian companies cut their dividends in 2019, with the banking sector especially vulnerable. Singapore and Hong Kong both saw good growth, though the number of dividend cutters in Hong Kong increased.
In China, a big increase from Petrochina pushed the total 4.4% higher, but without this effect, Chinese dividends were flat, and as with Australia, an unusually large two fifths cut payouts. Overall emerging-market payouts were lifted by sharp increases in Russia.
European dividends have grown more slowly than any other region over the last decade, though as a higher-yielding region, there is less room for dividend growth. In 2019, European payouts fell by 2.0% to $251.4bn, but this was mainly owing to a sharply lower euro against the US dollar. Underlying growth was 3.8%, a little behind the global average but with wide divergence from country to country.
The Netherlands and Italy saw the strongest growth, but France was the only European country to see record payouts. Germany was the weakest among the larger countries, but Belgium was the weakest
overall, following a halving of Anheuser Busch’s payment. The UK saw headline growth boosted by Rio Tinto and BHP’s special dividends, but underlying growth was just 2.9%, behind the global average.
For 2020, Janus Henderson expects headline growth to be held back by lower special dividends, but still expect dividends totalling $1.48 trillion, 3.9% higher than 2019. On an underlying basis, payouts are expected to grow 4.0%.
Ben Lofthouse, Co-Manager of Global Equity Income at Janus Henderson said:
“With the exception of a few specific sectors, the pace of earnings growth slowed across the world in 2019 as the global economy lost some momentum. This has inevitably driven a reduction in the pace of dividend growth, after a particularly strong two years. But there is still growth. The underlying 5.4% increase witnessed in 2019 was in line with the longer-term trend and highlights the resilience of dividends when economies face headwinds. Moreover, taking a global approach to income enables investors to take advantage of the benefits of both geographical and sectoral diversification. For the year ahead, the market expects the global economy and company profits to continue to expand, meaning dividends can grow further. 2020 is on track to deliver the fifth consecutive year of record dividends.”
-ends-
Press Enquiries
Stephen Sobey
Head of Media Relations
T: 44 (0) 2078182523
E: Stephen.sobey@janushenderson.com
Sarah de Lagarde Lia Esbry
Global Head of Communications European PR Executive
T: 44 (0) 2078182626 T: 44 (0) 2078183521
E: Sarah.delagarde@janushenderson.com E: Lia.esbry@janushenderson.com
Past performance is no guarantee of future results. International investing involves certain risks and increased volatility not associated with investing solely in the UK. These risks included currency fluctuations, economic or financial instability, lack of timely or reliable financial information or unfavourable political or legal developments.
Notes to editors
Janus Henderson Group (JHG) is a leading global active asset manager dedicated to helping investors achieve long-term financial goals through a broad range of investment solutions, including equities, fixed income, quantitative equities, multi-asset and alternative asset class strategies.
Janus Henderson has approximately US$374.8bn in assets under management (at 31 December 2019), more than 2,000 employees, and offices in 28 cities worldwide. Headquartered in London, the company is listed on the New York Stock Exchange (NYSE) and the Australian Securities Exchange (ASX).
Methodology
Each year Janus Henderson analyse dividends paid by the 1,200 largest firms by market capitalisation (as at 31/12 before the start of each year). Dividends are included in the model on the date they are paid. Dividends are calculated gross, using the share count prevailing on the pay date (this is an approximation because companies in practice fix the exchange rate a little before the pay date), and converted to US$ using the prevailing exchange rate. Where a scrip dividend is offered, investors are assumed to opt 100% for cash. This will slightly overstate the cash paid out, but we believe this is the most proactive approach to treat scrip dividends. In most markets it makes no material difference, though in some, particularly European markets, the effect is greater. Spain is a particular case in point. The model takes no account of free floats since it is aiming to capture the dividend paying capacity of the world’s largest listed companies, without regard for their shareholder base. We have estimated dividends for stocks outside the top 1,200 using the average value of these payments compared to the large cap dividends over the five-year period (sourced from quoted yield data). This means they are estimated at a fixed proportion of 12.7% of total global dividends from the top 1,200, and therefore in our model grow at the same rate. This means we do not need to make unsubstantiated assumptions about the rate of growth of these smaller company dividends. All raw data was provided by Exchange Data International with analysis conducted by Janus Henderson Investors.