- Global payouts fell 12.2% in 2020 to $1.26 trillion, equivalent to an underlying fall of 10.5%
- Q4 ended the year with a smaller fall than feared
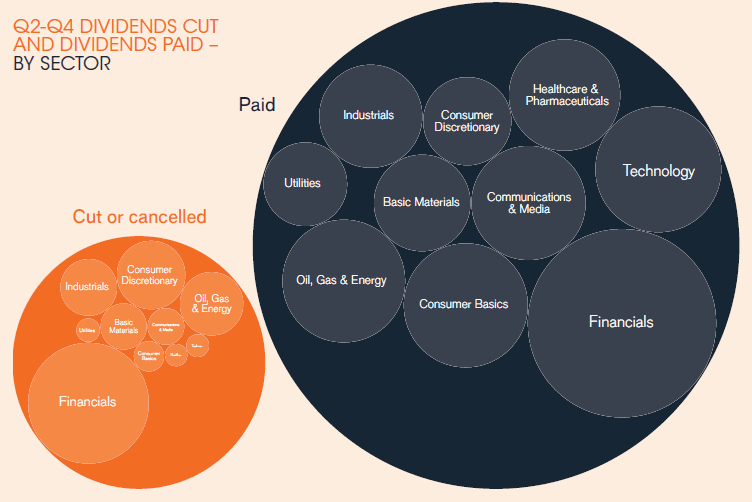
- Dividend cuts totalled $220bn between Q2 and Q4
- One company in eight cancelled its payout altogether and one in five made a cut, but two thirds increased or held steady
- North American dividends were very resilient, rising to a new record
- China, Hong Kong and Switzerland joined Canada among the best performing nations
- The dividend cuts were most severe in the UK, Europe and Australia
- Banks, oil, mining and consumer discretionary companies were worst hit, while classic defensives – food retail, pharmaceuticals and personal products – were well insulated
- Janus Henderson’s best-case scenario sees 2021 dividends up 5% on a headline basis to a total of $1.32 trillion, an underlying increase of 2%. This includes Q1 2021, in which payouts will continue to fall
- The worst-case could see payouts fall 2% on a headline basis, or 3% in underlying terms
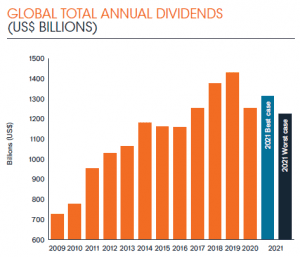
During the worst crisis since World War II global dividends fell to $1.26 trillion in 2020, down 12.2% on a headline basis, according to the latest Global Dividend Index from Janus Henderson. This was better than Janus Henderson’s best-case forecast of $1.21 trillion thanks to a less severe fall in Q4 payouts than anticipated. On an underlying basis, dividends were 10.5% lower in 2020, a smaller decline than after the global financial crisis. Janus Henderson’s index of global dividends fell to 172.4, a level last seen in 2017.
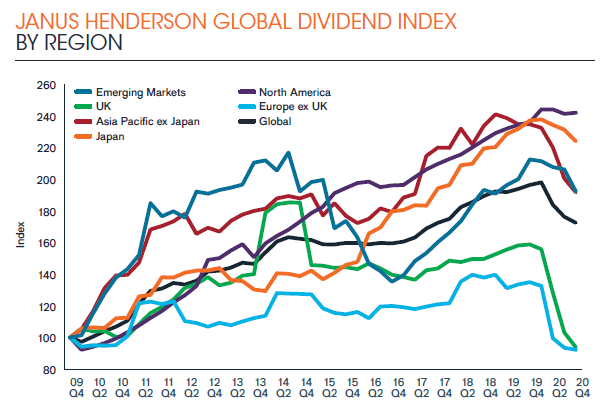
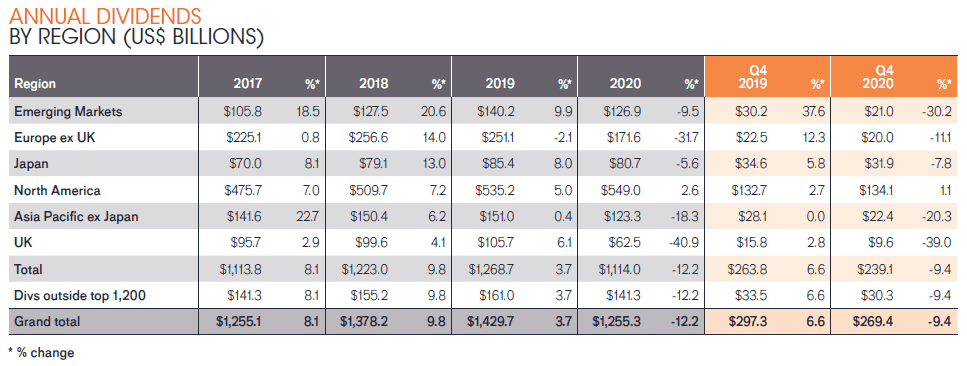
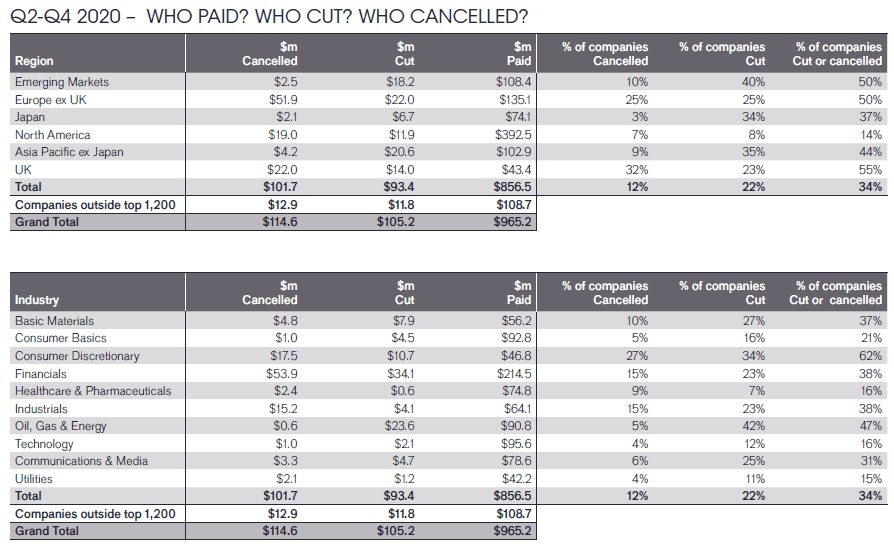
The dividend cuts were most severe in the UK and Europe, which together accounted for more than half the total reduction in payouts globally, mainly owing to the forced curtailment on banking dividends by regulators. But even as payouts in Europe and the UK fell below the levels seen in 2009 when our index began, they rose 2.6% on a headline basis in North America to a new record. North America did so well mainly because companies were able to conserve cash and protect their dividends by suspending or reducing share buybacks instead, and because regulators were more lenient with the banks. In Asia, Australia was worst affected, thanks to its heavy reliance on banking dividends, which were constrained by regulators until December. Elsewhere, China, Hong Kong and Switzerland joined Canada among the best performing nations.
Q4 ended the year with a smaller fall than feared
Q4 payouts fell 14.0% on an underlying basis to a total of $269.1bn while the headline decline was just 9.4%. This was less severe than expected as companies like Sberbank in Russia and Volkswagen in Germany restored suspended dividends at full strength, while others like Essilor in France brought them back at a reduced level. Special dividends were also larger than expected, while in the US the dividends announced for the next four quarterly payments were better than expected.
How did Covid-19 affect global dividends?
Although the cuts and cancellations totalled $220bn between April and December 2020, companies nevertheless paid their shareholders $965bn, still far outweighing the reductions. One company in eight cancelled its payout altogether and one in five made a cut, but two thirds increased their dividends or held them steady. Banks accounted for one third of global dividend reductions by value, more than three times as much as oil producers – the next most severely affected sector. Six in ten consumer discretionary companies cut or cancelled payouts, but the classic defensives – food retail, pharmaceuticals and personal products – were well insulated. Among the world’s larger stock markets, the impact in Spain and France was particularly widespread with 71% of companies making reductions compared to just 9% in Canada.
Outlook
Q1 2021 will see payouts fall, although the decline is likely to be smaller than between Q2 and Q4 2020. The outlook for the full year remains extremely uncertain. The pandemic has intensified in many parts of the world, even as vaccine rollouts provide hope. Importantly, banking dividends will resume in countries where they were curtailed, but they will not come close to 2019 levels in Europe and the UK, and this will limit the potential for growth. Those parts of the world that proved resilient in 2020 look likely to repeat this performance in 2021, but some sectors are likely to continue to struggle until economies can reopen fully.
A slow escape from the pandemic, and the drag caused by the first quarter, suggest that dividends may fall by 2% (headline) for the full year in a worst-case scenario (-3% underlying). A best-case at this stage suggests an increase of 2% on an underlying basis, equivalent to a headline rise of 5%, yielding a total of $1.32 trillion.
Jane Shoemake, Client Portfolio Manager on the Global Equity Income Team at Janus Henderson said: “Although the pandemic has changed the lives of billions in previously unimaginable ways, its impact on dividends has been consistent with a conventional, if severe, recession. Sectors that depend on discretionary spending have been more severely impacted, while defensive sectors have continued to make payments. At a country level, places like the UK, Australia and parts of Europe suffered a greater decline because some companies had arguably been overdistributing before the crisis and because of regulatory interventions in the banking sector. But at the global level, the underlying 15% year-on-year contraction in payouts between Q2 and Q4 has been less severe than in the aftermath of the global financial crisis.
“The disruption in some countries and sectors has been extreme, but a global approach to income investing meant the benefits of diversification have helped mitigate some of these effects. Crucially, the world’s banks (which usually pay the largest share of the world’s dividends) mostly entered the crisis with healthy balance sheets. Bank dividends may have been restricted by regulators in some parts of the world, but the banking system has continued to function, underpinned by robust capital levels, which is vital for the smooth operation of economies.
“Finally, as is usual in challenging economic environments, dividends are exhibiting stability relative to profits. This is one reason why dividends are such an important consideration for investors.”
-ends-
Unless otherwise stated all data is sourced by Janus Henderson Investors as of 31 December 2020.
Past performance is no guarantee of future results. International investing involves certain risks and increased volatility not associated with investing solely in the UK. These risks included currency fluctuations, economic or financial instability, lack of timely or reliable financial information or unfavourable political or legal developments.
Notes to editors
Janus Henderson Group (JHG) is a leading global active asset manager dedicated to helping investors achieve long-term financial goals through a broad range of investment solutions, including equities, fixed income, quantitative equities, multi-asset and alternative asset class strategies.
At 31 December 2020, Janus Henderson had approximately US$402 billion in assets under management, more than 2,000 employees, and offices in 26 cities worldwide. Headquartered in London, the company is listed on the New York Exchange (NYSE) and the Australian Securities Exchange (ASX).
Methodology
Each year Janus Henderson analyse dividends paid by the 1,200 largest firms by market capitalisation (as at 31/12 before the start of each year). Dividends are included in the model on the date they are paid. Dividends are calculated gross, using the share count prevailing on the pay date (this is an approximation because companies in practice fix the exchange rate a little before the pay date), and converted to US$ using the prevailing exchange rate. Where a scrip dividend is offered, investors are assumed to opt 100% for cash. This will slightly overstate the cash paid out, but we believe this is the most proactive approach to treat scrip dividends. In most markets it makes no material difference, though in some, particularly European markets, the effect is greater. Spain is a particular case in point. The model takes no account of free floats since it is aiming to capture the dividend paying capacity of the world’s largest listed companies, without regard for their shareholder base. We have estimated dividends for stocks outside the top 1,200 using the average value of these payments compared to the large cap dividends over the five-year period (sourced from quoted yield data). This means they are estimated at a fixed proportion of 12.7% of total global dividends from the top 1,200, and therefore in our model grow at the same rate. This means we do not need to make unsubstantiated assumptions about the rate of growth of these smaller company dividends. All raw data was provided by Exchange Data International with analysis conducted by Janus Henderson Investors.