
Key takeaways:
- The tech sector today is fundamentally stronger than in 2000, being
more diverse, profitable, resilient, and embedded across multiple sectors. - While valuations are elevated, the global tech leaders are supported by earnings and revenue growth.
- The massive capital expenditure in AI reflects a long-term investment in a generational technology shift. Tax incentives and real-world use cases are helping justify these investments, but selectivity in identifying true AI winners is crucial.
Q: Investors are drawing parallels between the dot.com bubble and the excitement around the AI wave today, with a particular focus on the capital expenditure (capex) versus profitability debate. What makes this time different?
The technology sector has evolved significantly compared to 2000 when there was effectively one bet on the enterprise internet opportunity. Today, there is much more diversity across end customer, end technology and business models. This is reflected in the breadth of technology companies represented across different sectors in indices like MSCI, with Amazon residing in Consumers, Netflix sitting in Communication Services, Uber in Industrials, and Visa and Mastercard in Financials. Alphabet and Meta are in Communication Services, a new sector established in 2018 to encompass the remaining internet companies alongside telecom companies.
Exposure to the technology sector is broader than narrow benchmark and GICS classifications. Tech leaders that are correctly identified can provide investors with exposure to innovation, secular growth, disruption, strong profit margins and balance sheets. Companies like these offer a lot more resilience and ‘offence’ in terms of growth and innovation.
Many of the leading technology companies today are also much more profitable and have much stronger balance sheets versus 2000 (Figure 1).
Figure 1: Tech companies have the strongest balance sheets
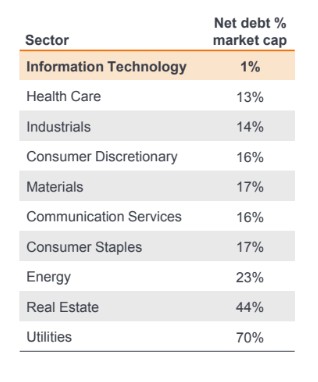
Source: UBS, as at 14 July 2025. Data is for MSCI World Sector Indices excluding the Financials sector. ’Net debt as % of market cap’ is a measure of the net debt (debt minus cash and cash equivalents) on a company’s balance sheet as a percentage of its total market capitalisation. Past performance does not predict future returns.
Q: Has the stock valuation process for the Global Technology Leaders Team evolved over the years?
We continue to use the same valuation techniques as we did in 2000, focused on price-to-earnings (P/E) ratios and free cash flow (FCF) yields. There’s a big difference in the number of unprofitable companies and their P/E ratios. Back in the first quarter of 2000, around 36% of US tech companies were unprofitable, versus 21% in Q1 251. The Magnificent 7 today trade on a P/E of almost 40x forward earnings, but taking out Tesla on >100x P/E and the rest trade on a mid-20x P/E ratio, which is well below the leading tech stocks in 2000 with many more on >1000x P/E. We also think a lower PEG (price/earnings to growth) ratio, is a good indicator of underappreciated earnings, which we believe is a good guide to future returns (Figure 2).
Figure 2: Unappreciated earnings growth drives returns, not P/Es
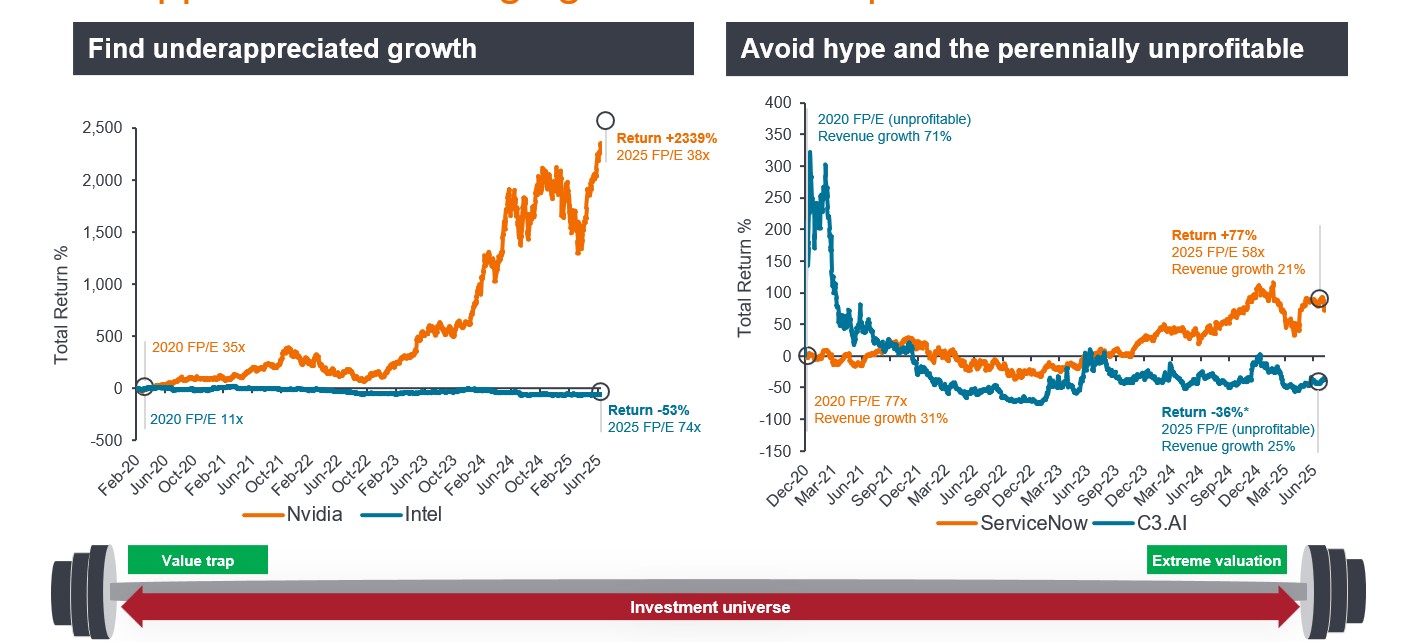
Source: Janus Henderson Investors, Bloomberg, total returns in US dollars, as at 14 July 2025.
Note: Performance is total return in USD. Current FP/E is Forward PE Ratio using current annuals (2025). *Return calculated from IPO date on 8 December 2020. References made to individual securities do not constitute a recommendation to buy, sell or hold any security, investment strategy or market sector, and should not be assumed to be profitable. Janus Henderson Investors, its affiliated advisor, or its employees, may have a position in the securities mentioned. There is no guarantee that past trends will continue, or forecasts will be realised. Past performance does not predict future returns.
Q: Given the tech sector’s strong performance in recent years are we heading towards bubble territory?
NVIDIA, the first company to surpass US$4 trillion in market capitalisation and the leader of the AI technology wave, currently trades on >30x P/E for next year.2 While relatively high, we believe this is not indicative of bubble territory – consider that the tech sector was trading on 50x P/E when the dot.com bubble burst. Microsoft too recently passed this market cap milestone. This time around, some of the high valuations have been backed by strong revenue and profits, unlike many companies back in 2000, which had burned through their funding without ever seeing a dollar of profit.
The technology sector continues to take market share of the global economy through its innovation and disruption. Over the past 20 years we have all changed the way we live our daily lives. Those new habits often include giving more money to technology companies driving the superior earnings growth of the so-called ‘FAANG’ that came to dominate the stock market. Now the same thing is happening in the AI wave led by NVIDIA, but we expect there will be many more new AI leaders in the years to come. As we all use more AI in the future, that will open up larger, new growth markets for technology to take market share, and continue to outpace the rest of the market in terms of earnings growth.
Q: Collectively, Alphabet, Amazon, Meta and Microsoft are committing about US$350 billion in capital expenditure this year, and more than US$400 billion next year. 3 Are we anywhere near peak capex?
AI is akin to an ‘arms race’ for companies and countries. We don’t foresee any pull back on capex anytime soon given we are early on in this generational technology with ever-increasing addressable markets and use cases. As with every true tech wave like the PC, mobile, and internet, the long investment horizons require significant investment to realise its true growth potential.
The mega cap tech companies are investing in datacentres, talent and chips, and now we have reached the stage where the dollars are shifting from being used to train up large language models (LLMs) to actual use cases. This is instilling more confidence for both companies and investors in terms of justification for the huge capex amounts that we are seeing. Funding rounds from OpenAI and xAI recently, as well as Anthropic finalising soon support this narrative.
Another key development has been tax reform via President Trump’s One Big Beautiful Bill Act. Among the measures announced, Companies can now expense 100% of domestic research and development (R&D), with permanent extension of the 100% bonus depreciation for qualified capital expenditure, allowing also retroactive expenses from capitalised R&D from 2022-24.4 For big tech companies that spend tens of billions on R&D and AI/cloud infrastructure, this is a major benefit from a taxation and cash flow perspective.
That said, while we may be nowhere near peak capex, we have to be even more selective when identifying the AI leaders and the true beneficiaries as the next stages of AI development and the associated investment opportunities arise.
Q: Why does an active investment approach make sense for tech?
The technology sector provides access to a plethora of great, innovative companies with strong profit growth and balance sheets. While the current economic, geopolitical and technological landscape differs from that of the dot.com years, the AI wave will last for multiple years, with multiple up and down periods, and hype cycles. Coupled with the return of cost of capital, concentration risk in a small number of dominant tech stocks and geopolitical risks, an active approach should serve investors well.
1Bernstein, as at 14 July 2025. % of unprofitable technology stocks/among largest 1500 stocks in the US. Past performance does not predict future returns.
2 Nasdaq,com, NVIDIA consensus P/E for fiscal year ending January 2027 =33.85x, data as at 8 August 2025.
3 FT.com, ‘Investors glimpse pay-off for Big Tech’s mammoth spending on AI arms race’; 1 August 2025.
4 Morgan Stanley Research, The Big Beautiful Tech Tax Bill; 22 July 2025.
Balance sheet: a financial statement summarising a company’s assets, liabilities and shareholders’ equity at a particular point in time. Balance sheet strength is an indicator of a company’s financial health and stability.
Capex: capital expenditure is the money a business spends on major, long-term assets such as property and equipment (tangible assets) or technology, software, trademarks, patents etc (intangible assets) to facilitate new projects or investments that support business growth and expansion.
Concentration risk: investing in a smaller number of stocks typically carries greater risk than investing in a broader range of stocks (diversification), given that an adverse event could result in significant volatility or losses, but the potential to outperform is also greater.
FAANG: an acronym for stocks that were widely considered to be among the highest growth tech stocks namely Facebook (now Meta Platforms), Amazon, Apple, Netflix and Google (now Alphabet).
FCF: free cash flow is cash that a company generates after allowing for day-to-day running expenses and capital expenditure. It can then use the cash to make purchases, pay dividends or reduce debt. Free cash flow yield is calculated by taking the company’s free cash flow, divided by its market value. The higher the free cash flow yield is, the more the company is generating cash that can be quickly and easily accessed to satisfy its obligations.
Hype cycle: the hype cycle represents the different stages in the development of a technology, from conception to widespread adoption, with investor sentiment towards that technology and related stocks changing during the cycle.
LLM: a large language model is a specialised type of artificial intelligence that has been trained on vast amounts of text to understand existing content and generate original content.
Magnificent 7: refers to seven companies widely acknowledged for their strong fundamentals, market dominance, technological impact, and changes to consumer and economic trends: Alphabet (GOOGL; GOOG), Amazon (AMZN), Apple (AAPL), Meta Platforms (META), Microsoft (MSFT), NVIDIA (NVDA), and Tesla (TSLA).
Market capitalisation: market cap is the total market value of a company’s issued shares and is typically used to determine a company’s size.
P/E: price-to-earnings is a popular ratio used to value a company’s shares. It measures share price compared to earnings per share for a stock or stocks in a portfolio. Forward P/E reflects current share price as a ratio of estimated earnings per share over the next 12 months.
Price/Earnings-to-Growth (PEG): the PEG ratio adds expected earnings growth to the P/E ratio. Considered a better reflection of a stock’s valuation, a lower PEG indicates that a stock is undervalued.
Profit margin: the amount by which the sales of a product or service exceeds business and production costs.
Value trap: when a stock appears to be cheap due to an attractive valuation metric (such as a low P/E ratio). However, rather than representing good value, a value trap is often just a poor investment, which may happen if the company or its sector is in trouble, or if there is strong competition, lack of earnings growth, or ineffective management.
These are the views of the author at the time of publication and may differ from the views of other individuals/teams at Janus Henderson Investors. References made to individual securities do not constitute a recommendation to buy, sell or hold any security, investment strategy or market sector, and should not be assumed to be profitable. Janus Henderson Investors, its affiliated advisor, or its employees, may have a position in the securities mentioned.
Past performance does not predict future returns. The value of an investment and the income from it can fall as well as rise and you may not get back the amount originally invested.
The information in this article does not qualify as an investment recommendation.
There is no guarantee that past trends will continue, or forecasts will be realised.
Marketing Communication.
Important information
Please read the following important information regarding funds related to this article.
- Shares/Units can lose value rapidly, and typically involve higher risks than bonds or money market instruments. The value of your investment may fall as a result.
- Shares of small and mid-size companies can be more volatile than shares of larger companies, and at times it may be difficult to value or to sell shares at desired times and prices, increasing the risk of losses.
- If a Fund has a high exposure to a particular country or geographical region it carries a higher level of risk than a Fund which is more broadly diversified.
- The Fund is focused towards particular industries or investment themes and may be heavily impacted by factors such as changes in government regulation, increased price competition, technological advancements and other adverse events.
- The Fund follows a sustainable investment approach, which may cause it to be overweight and/or underweight in certain sectors and thus perform differently than funds that have a similar objective but which do not integrate sustainable investment criteria when selecting securities.
- The Fund may use derivatives with the aim of reducing risk or managing the portfolio more efficiently. However this introduces other risks, in particular, that a derivative counterparty may not meet its contractual obligations.
- If the Fund holds assets in currencies other than the base currency of the Fund, or you invest in a share/unit class of a different currency to the Fund (unless hedged, i.e. mitigated by taking an offsetting position in a related security), the value of your investment may be impacted by changes in exchange rates.
- When the Fund, or a share/unit class, seeks to mitigate exchange rate movements of a currency relative to the base currency (hedge), the hedging strategy itself may positively or negatively impact the value of the Fund due to differences in short-term interest rates between the currencies.
- Securities within the Fund could become hard to value or to sell at a desired time and price, especially in extreme market conditions when asset prices may be falling, increasing the risk of investment losses.
- The Fund could lose money if a counterparty with which the Fund trades becomes unwilling or unable to meet its obligations, or as a result of failure or delay in operational processes or the failure of a third party provider.
Specific risks
- Shares/Units can lose value rapidly, and typically involve higher risks than bonds or money market instruments. The value of your investment may fall as a result.
- If a Fund has a high exposure to a particular country or geographical region it carries a higher level of risk than a Fund which is more broadly diversified.
- The Fund is focused towards particular industries or investment themes and may be heavily impacted by factors such as changes in government regulation, increased price competition, technological advancements and other adverse events.
- This Fund may have a particularly concentrated portfolio relative to its investment universe or other funds in its sector. An adverse event impacting even a small number of holdings could create significant volatility or losses for the Fund.
- The Fund may use derivatives with the aim of reducing risk or managing the portfolio more efficiently. However this introduces other risks, in particular, that a derivative counterparty may not meet its contractual obligations.
- If the Fund holds assets in currencies other than the base currency of the Fund, or you invest in a share/unit class of a different currency to the Fund (unless hedged, i.e. mitigated by taking an offsetting position in a related security), the value of your investment may be impacted by changes in exchange rates.
- When the Fund, or a share/unit class, seeks to mitigate exchange rate movements of a currency relative to the base currency (hedge), the hedging strategy itself may positively or negatively impact the value of the Fund due to differences in short-term interest rates between the currencies.
- Securities within the Fund could become hard to value or to sell at a desired time and price, especially in extreme market conditions when asset prices may be falling, increasing the risk of investment losses.
- The Fund could lose money if a counterparty with which the Fund trades becomes unwilling or unable to meet its obligations, or as a result of failure or delay in operational processes or the failure of a third party provider.