Fixed Income Outlook 2024: Do the math
Jim Cielinski, Global Head of Fixed Income, explores why in the context of extreme bond market volatility, the math at the core of fixed income argues for a more rewarding outlook for the asset class in 2024.


8 minute read
Key takeaways:
- 2024 is set to be the year of the pivot. Central banks have gained the upper hand over inflation, allowing them to shift toward rate cuts as the year unfolds.
- This should induce a decline in yields and allow bonds to regain their diversification potential.
- The corporate bond sector may be hindered by the lagged impact of policy tightening, but higher quality spread sectors – investment grade corporate credit and agency mortgages – should prove compelling.
The shift away from low and sub-zero yields was always going to be challenging for much of the fixed income universe. The good news about higher yields is that they make it mathematically more difficult to post negative fixed income returns and much easier to generate positive returns. As we look ahead to 2024, the world of math can offer some useful lessons about what fixed income markets may have in store.
Calculating returns: the asymmetric risk-reward profile
Bond prices move inversely with the change in their yield. When yields fall, bond prices rise and vice versa. Yields have soared over the past three years but with them seemingly peaking, we think the prospects for bonds in 2024 look increasingly bright. The table below highlights how the income from bonds provides a cushion against higher rates, while any decline in yields offers the prospect of returns enhanced by capital gains.
Fig 1: Total return matrix for US Treasuries under different yield change scenarios
Estimated 12-month total return (%)
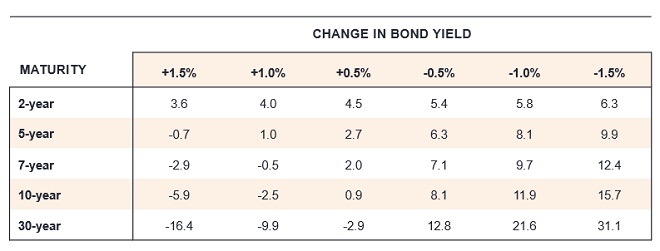
Source: Bloomberg, using current US Treasury bonds at specified maturities, as at 17 November 2023. For illustrative purposes only, estimated returns reflect assumptions based only on changes in bond yields/interest rates and no other factors. There is no guarantee that forecasts will be realised. Yields may vary and are not guaranteed.
Probability: peak policy rates offer a high likelihood of positive returns
Central banks have done a reasonably good job of putting the inflation genie back in the bottle. Notwithstanding some idiosyncratic shock – geopolitics and El Niño weather are obvious candidates – the path of least resistance for inflation is down. Excluding the stubborn rental component of the Consumer Price Index (CPI), US inflation is running at circa 2%.1 Wage pressures are moderating, and futures markets already reckon that the US Federal Reserve (the Fed) is done with hiking interest rates.2 Past performance is not necessarily a guide, but history has shown that government bonds typically perform well after the last hike.
Figure 2: US 10-year Treasury total return in different tightening cycles
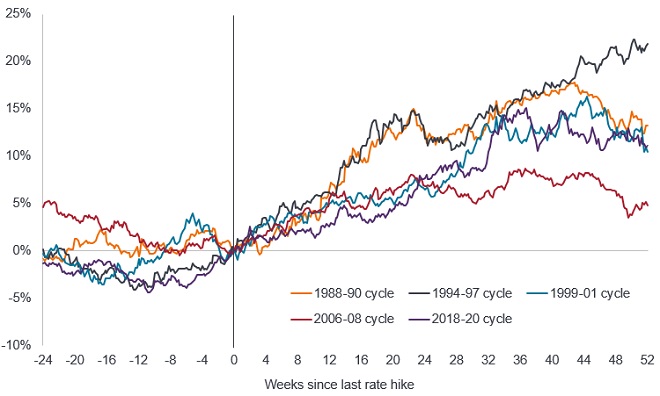
Source: LSEG Datastream, US Federal Reserve Target Rate peaks in cycle, Benchmark US 10-year Government Bond Total Return Index, in USD. Date of last rate hike in each cycle period: 1988-90 (24 Feb 1989), 1994-97 (01 Feb 1995), 1999-01 (16 May 2000), 2006-08 (29 June 2006), 2018-20 (20 Dec 2018). Past performance does not predict future returns.
The elusive soft landing
Monetary policy acts with long and variable lags. There are two problems with this. One, lead times are long. Two, lead times are variable! The extraordinary path of pandemic-related policy makes this cycle different than any other in history, and policy has made its way down from a very high mountain.
Markets have been elated with well-behaved inflation and employment data. They have quickly concluded that rate hikes are over and that the next stop is a soft landing – modestly positive growth with contained inflation. This is the one troublesome part of the outlook. The soft-landing expectation precedes most recessions. In the last six recessions, five of them were preceded by commentators anticipating a soft-landing (the Covid-19 recession being the exception).3 These expectations most often end in tears. The odds of a soft-landing have certainly improved, but are overestimated. Leading indicators remain weak, liquidity is poor and real rates restrictive, making a harder landing more likely. At the very least, markets will contend at some point with a growth scare in the coming year. We anticipate a good time to buy risk assets will present itself in the next 12 months, but it has not arrived yet.
Curves: the return of upward-sloping yield curves
Given our expectation that central banks will start easing rates next year, the shorter part of the yield curve should see yields move lower. Throughout 2023 the yield curve remained inverted – shorter-dated bonds yielded more than longer-dated bonds. The inversion lessened in the second half of 2023 and it is likely that 2024 will bring about more normal upward-sloping yield curves, with shorter-dated bonds yielding less than longer-dated bonds.
Figure 3: Yield curve inversion should lessen
The yield on a 10-year government bond minus the yield on a 2-year government bond
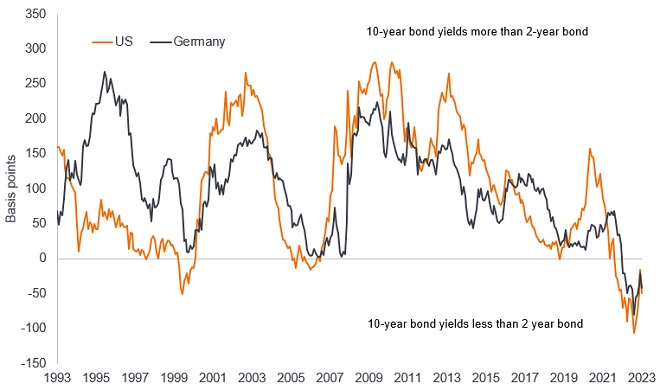
Source: Bloomberg, US 2s10s curve, Germany 2s10s curve, 30 November 1993 to 20 November 2023. Basis point (bp) equals 1/100 of a percentage point, 1bp = 0.01%. Yields may vary over time and are not guaranteed.
This is likely to have implications for allocation, with investors keener to lock in longer-dated yields. Bonds with longer maturities have higher duration (sensitivity to changes in interest rates). With rates set to fall, we see 2024 as a year in which owning duration could be rewarding.
There will be a limit, however, to how much short rates can fall in 2024. The Fed’s preferred measure of inflation (core Personal Consumption Expenditure) is still above target at 3.7%.4 Although rate cuts are likely to unfold in the US, markets have begun to price in such an outcome. Inflation will be well-behaved, but until it moves closer to the 2% target, central banks will move cautiously and ensure they maintain their inflation fighting credentials. This is particularly true in the Eurozone, where the European Central Bank has a tightly defined mandate focused on price stability.
Ratios: signals from corporate fundamentals
For bond investors ratios matter, particularly those related to a company’s financial strength. A widely followed ratio is the leverage ratio (net debt/earnings) which loosely details how many years it would take to pay back debt. Another key ratio is interest coverage (earnings/interest expense), which is a measure of how easily a company can pay interest on its outstanding debt. These have been deteriorating recently and we expect this deterioration to worsen in 2024.
With nominal economic growth fading, companies should find it tougher to grow their top-line revenues. Cost pressures will remain, however, and may worsen as companies will need to refinance at higher rates than were available a few years ago. This is expected to separate the ‘haves’ (those companies with strong balance sheets and cash flow generating potential) from the ‘have nots’ (those companies with stressed balance sheets who will struggle to roll over their debts). It will be important to watch disinflation.
Refinancing will separate the ‘haves’ from the ‘have nots’.
Decompression (credit spreads widening as you move down the credit spectrum in response to negative news) was not much in evidence outside of CCC-rated corporate bonds during 2023. This was because moves in government bond yields tended to dominate returns. We think 2024 will see decompression return, however, as greater attention is paid to corporate fundamentals, providing a strong environment for active management. In this environment, we favour being higher in quality, preferring investment grade debt over high yield and higher quality segments of the loans market.
Correlation: the return of equity-bond diversification
One relationship that has been valuable for investors historically has been the capacity for government bonds to offer a hedge against weakness in equity markets. This was because in recent decades equity and bond returns typically had a negative correlation, i.e. when one moved up, the other moved down. This negative correlation tends to break down in periods of high inflation – such as 2023 – because the higher inflation is the cause of both higher rates and elevated recessionary fears. Traditional relationships should reassert themselves when inflation moves below 3%, something we expect to happen in 2024.
Figure 4: Negative correlation should reassert itself as core CPI falls below 3%
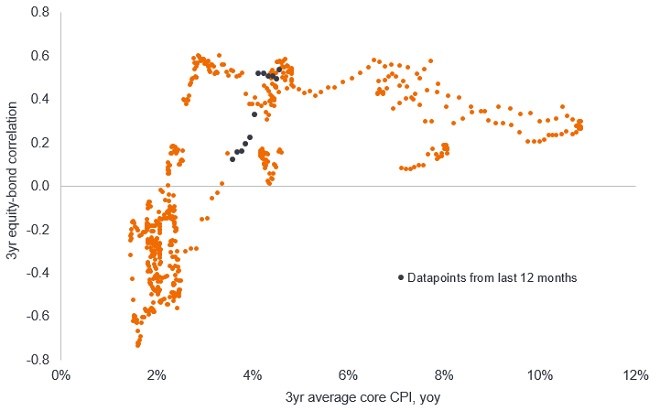
Source: Bloomberg, 3-year correlation of Bloomberg US Treasury Total return Index with S&P 500® Total Return Index, plotted against 3-year average US Core Consumer Price Index (inflation), monthly data, February 1973 to October 2023. Past performance does not predict future returns.
Throughout 2023 we liked better quality asset-backed securities for their high yields and/or diversification qualities. These themes remain for 2024. We continue to find agency mortgage-backed securities (MBS) attractive. Yields above 5% for an asset class with low volatility continues to make them a useful income generator and diversifier within portfolios.5
Fixed income has come full circle
We believe 2024 to be a critical transition year. Investors should keep a watchful eye on disinflation – the decline in the rate of inflation – as there is a big difference between whether it is demand led (recessionary) or supply led (better productivity, declining trade costs and bottlenecks). China will either be a meaningful plus or minus for the global economy, depending on their approach to stimulus. Faltering European growth could yet set the agenda. Attention will re-focus on imprudent fiscal spending, and we could see volatility as several major economies gear up for elections.
Risks, therefore, have not gone away but we think it is time to dig out your compass and protractor. Fixed income markets have come full circle. With the reset in yields they are reassuming their traditional role of offering both an attractive level of income and diversification against risk assets.
1Source: U.S. Bureau of Labor Statistics, Consumer Price Index (CPI): All items less shelter, latest annual percentage change figure to October 2023 was 1.5%. Figure updated at 14 November 2023.
2Source: Bloomberg, World Interest Rate Projections, correct as at 20 November 2023. There is no guarantee that past trends will continue, or forecasts will be realised.
3Source: Based on National Bureau of Economic Research (NBER) recession periods for the US, 1980, 1981, 1990, 2001, 2008, and 2020 and various media stories ahead of the recessions.
4Source: U.S. Bureau of Economic Analysis, core Personal Consumption Expenditure (PCE), latest annual percentage change figure to September 2023. Core PCE excludes food and energy. Headline PCE was at 3.4%.
5Source: Bloomberg, Bloomberg US Mortgage Backed Securities (MBS) Index. Yield to worst at 20 November 2023. The Bloomberg US MBS Index tracks fixed-rate agency mortgage-backed securities guaranteed by Fannie Mae, Freddie Mac and Ginnie Mae. Yields may vary over time and are not guaranteed.
10-Year Treasury Yield is the interest rate on U.S. Treasury bonds that will mature 10 years from the date of purchase.
Asset-backed securities (ABS): A financial security that is ‘backed’ (or collateralised) with existing assets (such as loans, credit card debts or leases), usually ones that generate some form of income (cash flow) over time.
Balance sheet: A financial statement that summarises a company’s assets, liabilities and shareholders’ equity at a particular point in time. It is called a balance sheet because of the accounting equation: assets = liabilities + shareholders’ equity.
Cash flow: The net amount of cash and cash equivalents transferred in and out of a company.
Consumer Price Index (CPI) is an unmanaged index representing the rate of inflation of the U.S. consumer prices as determined by the U.S. Department of Labor Statistics.
Core Personal Consumption Expenditure (PCE) Price Index is a measure of prices that people living in the U.S. pay for goods and services, excluding food and energy.
Correlation measures the degree to which two variables move in relation to each other. A value of 1.0 implies movement in parallel, -1.0 implies movement in opposite directions, and 0.0 implies no relationship.
Credit rating: A score given by a credit rating agency such as S&P Global Ratings, Moody’s and Fitch on the creditworthiness of a borrower. For example, S&P ranks investment grade bonds from the highest AAA down to BBB and high yields bonds from BB through B down to CCC in terms of declining quality and greater risk, i.e. CCC rated borrowers carry a greater risk of default.
Credit spectrum: The range of credit ratings from the highest rated investment grade to the lowest rated high yield bond.
Credit Spread is the difference in yield between securities with similar maturity but different credit quality. Widening spreads generally indicate deteriorating creditworthiness of corporate borrowers, and narrowing indicate improving.
Fannie Mae, Freddie Mac and Ginnie Mae are all US government-sponsored mortgage companies. Fannie Mae and Freddie Mac buy mortgages, pool them into mortgage-backed securities (MBS) and sell them to private investors. This secondary mortgage market increases the supply of funding available for mortgage lending. Ginnie Mae is a wholly owned government corporation which guarantees the timely payment of principal and interest payments on residential MBS. It does not purchase, sell or issue securities itself but institutions approved by Ginnie Mae can originate eligible loans and pool them into securities as Ginnie Mae MBS instruments.
Fiscal spend/fiscal policy: Describes government policy relating to setting tax rates and spending levels. Fiscal policy is separate from monetary policy, which is typically set by a central bank.
Duration measures a bond price’s sensitivity to changes in interest rates. The longer a bond’s duration, the higher its sensitivity to changes in interest rates and vice versa
Futures contract: A contract between two parties to buy or sell an asset at a specified later date, using a price agreed today. Fed funds futures are based on the federal funds rate and traded on the Chicago Mercantile Exchange. They can provide an indication of where markets expect the Fed’s policy interest rate to be at different points in the future.
High yield bond: Also known as a sub-investment grade bond, or ‘junk’ bond. These bonds usually carry a higher risk of the issuer defaulting on their payments, so they are typically issued with a higher interest rate (coupon) to compensate for the additional risk.
Investment-grade bond: A bond typically issued by governments or companies perceived to have a relatively low risk of defaulting on their payments, reflected in the higher rating given to them by credit ratings agencies.
Late cycle: Economic activity often reaches its peak, implying that growth remains positive but slowing.
Leverage: This is a measure of the level of debt in a company. Net leverage is debt (minus cash and cash equivalents) as a ratio of earnings (typically before interest, tax, depreciation and amortisation).
Lead indicator: A piece or set of economic data that can help provide an early signal of where we are in an economic cycle.
Liquidity: A measure of how easily an asset can be bought or sold in the market. Assets that can be easily traded in the market in high volumes (without causing a major price move) are referred to as ‘liquid’.
Maturity: The maturity date of a bond is the date when the principal investment (and any final coupon) is paid to investors. Shorter-dated bonds generally mature within 5 years, medium-term bonds within 5 to 10 years, and longer-dated bonds after 10+ years.
Monetary Policy refers to the policies of a central bank, aimed at influencing the level of inflation and growth in an economy. It includes controlling interest rates and the supply of money. Monetary tightening refers to central bank activity aimed at curbing inflation and slowing down growth in the economy by raising interest rates and reducing the supply of money.
Mortgage-backed securities (MBS) may be more sensitive to interest rate changes. They are subject to extension risk, where borrowers extend the duration of their mortgages as interest rates rise, and prepayment risk, where borrowers pay off their mortgages earlier as interest rates fall. These risks may reduce returns.
Nominal data reflects economic data quoted in current prices so it incorporates inflation. Nominal economic growth is usually higher than real growth (inflation-adjusted) but this difference subsides when inflation falls.
The real interest rate is the rate of interest an investor, saver or lender receives after allowing for inflation.
Risk assets: Financial securities that may be subject to significant price movements (ie. carrying a greater degree of risk). Examples include equities, commodities, property lower-quality bonds or some currencies.
S&P 500® Index reflects U.S. large-cap equity performance and represents broad U.S. equity market performance.
Spread sectors: Nongovernment fixed income investments with typically higher yields and greater risk than government investments, including investment-grade and high-yield corporate bonds as well as securitized assets such as mortgage-backed and asset-backed securities.
Total return: This is the return on an asset or investment that takes into account both income and any capital gain/loss.
Yield: The level of income on a security over a set period, typically expressed as a percentage rate. For equities, a common measure is the dividend yield, which divides recent dividend payments for each share by the share price. For a bond, at its most simple, this is calculated as the coupon payment divided by the current bond price.
A yield curve plots the yields (interest rate) of bonds with equal credit quality but differing maturity dates. Typically bonds with longer maturities have higher yields. An inverted yield curve occurs when short-term yields are higher than long-term yields.
U.S. Treasury securities are direct debt obligations issued by the U.S. Government. The investor is a creditor of the government. Treasury Bills and U.S. Government Bonds are guaranteed by the full faith and credit of the U.S. government, are generally considered to be free of credit risk and typically carry lower yields than other securities.
Volatility measures risk using the dispersion of returns for a given investment. The rate and extent at which the price of a portfolio, security or index moves up and down.
IMPORTANT INFORMATION
Diversification neither assures a profit nor eliminates the risk of experiencing investment losses.
Fixed income securities are subject to interest rate, inflation, credit and default risk. The bond market is volatile. As interest rates rise, bond prices usually fall, and vice versa. The return of principal is not guaranteed, and prices may decline if an issuer fails to make timely payments or its credit strength weakens.
High-yield or “junk” bonds involve a greater risk of default and price volatility and can experience sudden and sharp price swings.
Securitized products, such as mortgage- and asset-backed securities, are more sensitive to interest rate changes, have extension and prepayment risk, and are subject to more credit, valuation and liquidity risk than other fixed-income securities.
These are the views of the author at the time of publication and may differ from the views of other individuals/teams at Janus Henderson Investors. References made to individual securities do not constitute a recommendation to buy, sell or hold any security, investment strategy or market sector, and should not be assumed to be profitable. Janus Henderson Investors, its affiliated advisor, or its employees, may have a position in the securities mentioned.
Past performance does not predict future returns. The value of an investment and the income from it can fall as well as rise and you may not get back the amount originally invested.
The information in this article does not qualify as an investment recommendation.
Marketing Communication.
8 minute read
Key takeaways:
- 2024 is set to be the year of the pivot. Central banks have gained the upper hand over inflation, allowing them to shift toward rate cuts as the year unfolds.
- This should induce a decline in yields and allow bonds to regain their diversification potential.
- The corporate bond sector may be hindered by the lagged impact of policy tightening, but higher quality spread sectors – investment grade corporate credit and agency mortgages – should prove compelling.

