
Key takeaways:
- AI represents a foundational shift in technology. It impacts every layer of the tech stack and economy hence, unlike a theme, it is expected to evolve over years.
- The dotcom crash was caused by Y2K-induced overspending, fraudulent capex, and speculative IPOs. Today’s AI boom is supported by more disciplined valuations and robust private funding among financially strong large tech companies.
- While AI investment today has better demand visibility, investors should be highly selective to navigate financing complexity, macroeconomic uncertainty and excessive valuations.
Since the artificial intelligence (AI) big bang of November 2022, AI-related technology stocks have outperformed significantly evoking comparisons and fears about a dotcom-like bubble, as we saw in the late 1990s. Most commentaries including AI comparisons provide hindsight assessments and rarely capture the full context of the era. In our previous article: Are tech sector investors too bullish on AI’s promise? we briefly touched on the key differences and similarities. Here we provide our views based on reflections of the team’s experience of having invested through the dotcom period, and explain why this time round very different dynamics are at play.
Over the last 20 years or so technology stocks have returned more than twice that of broader global equities, with technology having outperformed more than 80% of the time and also delivered a positive return of more than 80% of the time through that period.1 Despite this persistent outperformance, the fear of a dramatic drawdown, like that seen between 2000-2002 after the dotcom crash has continued to haunt many investors.
Why is AI not just a theme but an evolving multi-year tech wave?
We believe the adoption of AI is different. We consider AI to be the fourth wave of technology. Importantly, waves are different to themes. Themes for us include 3D printing, cybersecurity, and electric vehicles; they tend to have specific end markets and a narrower focus.
Waves, however, are defined by their impact across the whole economy. They create thematic ripples and importantly require investment across every layer of the technology and communication stack. This ranges from silicon, compute, storage, networking to software, devices, power and connectivity. Each wave has sequentially connected more people, devices, and required incrementally more investment. The investment required for each wave has taken longer and been greater in magnitude than investors anticipate for multiple years.
Waves of compute are not isolated, separate entities. The reality is that one wave lays the foundation for the next and typically they tend to build rather than end abruptly. For example, PC internet shifting to laptops with broadband connectivity laid foundations for true mobile compute with apps enabled by cloud infrastructure. This then opened the door to the evolution of AI.
Importantly, the dotcom bubble is effectively the only compute wave to have an abrupt end. Rather than fade and mature as other waves have – it reached a crescendo after six years (with two years of generating in excess of 70% returns) before it abruptly crashed.2
How does the AI boom differ from the dotcom bubble?
Recognising some of the unique aspects of the internet bubble are important to avoid false analogies with the current AI wave:
1. Y2K was a unique contributor to the dotcom crash
The role of Y2k is often overlooked as a contributory factor to the manner in which the internet bubble burst. The switch to year 2000 was viewed as an expiry date for all existing legacy computer systems, which couldn’t cope with the move from two digits: 99 to 2000. It was a global, non-negotiable deadline that pulled forward IT spending. The fear of mass outages resulted in huge IT projects, accelerating replacement capacity not just new capacity for the internet. The condition of forced upgrades and expiry has never been repeated in any subsequent technology wave.
2. Fraud inflated the competitive internet capex environment
The rapid pace of capital expenditure (capex) during the internet wave was partially fuelled by companies that were not subject to the same audit standards as today. The collapse of WorldCom was not only symptomatic of the dotcom bubble, but also contributed to the overestimation of demand.
WorldCom was a key player driving the fibre optic cable building frenzy of the late 1990s. It led to aggressive spending on mergers and acquisitions as well as capex to build infrastructure for the immense new internet traffic expected from dotcoms and the adoption of the World Wide Web. Fibre build outs were commodities, with no competitive differentiation other than how much capacity could be built. WorldCom’s spending was a mixture of aggressive and genuine spending, but also massive fraudulent accounting (more than US$11 billion) that other companies of that era tried to compete with. This artificially inflated demand. The Sarbanes-Oxley Act of 2002 was a legislative response to WorldCom (and Enron, which also had a broadband business) and has ensured higher audit standards that have effectively avoided that type of behaviour since. Ironically, NVIDIA replaced Enron in the S&P 500 in 2001 as a result. But despite greater transparency in this tech wave, there are still concerns around funding and finance structures.
3. More robust capex and start-up funding for AI
Private equity and credit funding for AI capex has been very robust but has been focused on larger company raises and datacentre projects by Open AI, XAI, and Anthropic, with seven of the highest valued private tech companies on paper worth more than US$1.3 trillion. According to Forge Global, a marketplace for private investments, 19 AI firms have raised US$65 billion this year – over three quarters of all private market capital.3 With this level of funding available privately, there is little incentive to go public early and is evident in the initial public offering (IPO) market of now versus the internet era.
In addition, while today almost 20% of technology companies are unprofitable, that is significantly lower than the 36% observed back in the internet era. Tech companies also now have the strongest balance sheets across sectors.
Figure 1: Less tech companies are unprofitable versus dotcom era
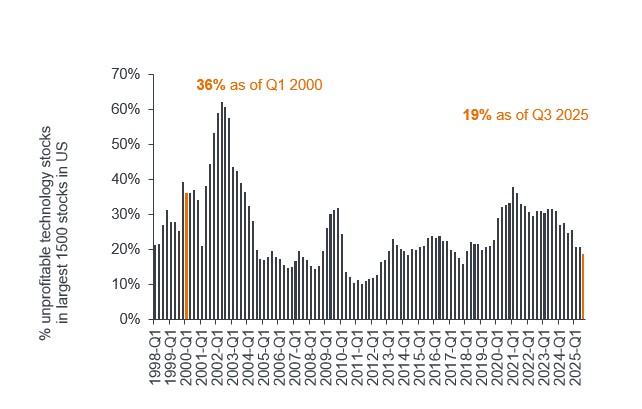
Source: Bernstein, as at 3 September 2025. Unprofitable Technology stocks (# Unprofitable Technology Stocks/Total number of Technology Stocks in Largest 1500 stocks in US). Past performance does not predict future returns.
While funding fueling AI and the dot.com era are very different, there are some emerging similarities in financing complexity that bears watching:
4. Risks from financing complexity: Circular references and vendor financing
As the internet capex boom developed, vendor financing and take or pay contracts became increasingly common. Vendor financing is when a company provides significant amounts of credit for companies to buy their products. In the internet bubble, now defunct telecom equipment company Lucent Technologies at its peak had over $15 billion in vendor financing versus operating cash flow of only around $300 million.4 The massive projects that WorldCom agreed to were often on a take delivery or pay a penalty model whether they had demand or not.
Recently, the AI space has become increasingly interwoven with suppliers funding customers, rising customer concentration, revenue sharing between customer and vendor, take-or-pay contracts, and vendor repurchase agreements. NVIDIA for example, is entering a strategic partnership with OpenAI to build and deploy 10 GW of datacentre capacity using NVIDIA systems, supported with $100 billion investment in OpenAI.5
OpenAI has also entered into an agreement with NVIDIA competitor AMD, with an option to acquire up to 10% of AMD over time.6 OpenAI requires vast amounts of computing power and has agreed deals to lease this from companies like Alphabet (Google Cloud), Oracle and CoreWeave. OpenAI makes up a significant portion of Oracle’s remaining purchase obligations (RPOs) as well as of other neoclouds like CoreWeave creating customer concentration risk.7
We have mixed views on this as OpenAI requires significant funding for these deals that have yet to be secured. In contrast the US$100 billion investment by NVIDIA is made possible because of its exceptional balance sheet and cash flow, giving it a stake in OpenAI. Additional funding for OpenAI can drive Alphabet and other companies to continue to competitively invest more in AI infrastructure. As Google CEO Sundar Pichai said in January this year, “The risk of overinvestment is less than the risk of underinvesting.”8 However, this does create circularity, and risk that the pace of AI demand creation is overestimated. If this were to become the primary or sole source of AI funding, that would be of increasing concern.
5. Focused AI capex means better supply and demand visibility
In the internet wave, small technology companies came to equity markets to raise capital to buy semiconductors, servers, storage, networking equipment and software that were needed to ramp up volume. As the adoption of internet services and ecommerce took longer to ramp than anticipated, it created overcapacity and grey markets for a wide range of equipment. Inventory-to-sales ratios became bloated across the sector.
Now, thanks to the mobile cloud era and hyperscalers ramping cloud capacity, companies no longer have to raise capital for equipment; they can simply ‘rent by the minute or second’ according to their capacity needs. Many of the companies building out AI capacity like Microsoft, Alphabet and Amazon have amongst the highest free cash flow and strongest balance sheets in the equity market – this in contrast to the IPO-fuelled internet demand previously.
Figure 2: Technology sector has the strongest balance sheets
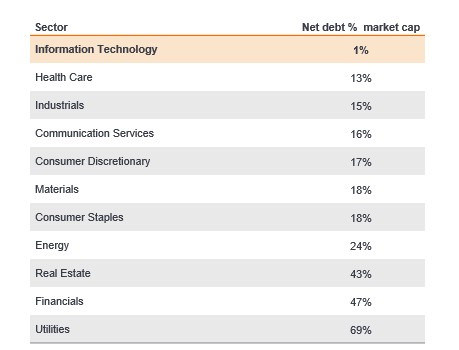
Source: UBS, as at 27 August 2025. Data is for MSCI World Sector Indices excluding the Financials sector. ’Net debt as % of market cap’ is a measure of the net debt on a company’s balance sheet as a percentage of its total market capitalisation. Past performance does not predict future returns.
These companies are also experts in compute logistics, having managed not only their own enormous demands, but that of hundreds of thousands of companies over the last decade. A concentrated group of seasoned technology companies on both the cloud and semiconductor side are managing this AI supply ramp. Demand visibility is also higher than it was for the dotcom start-ups.
Demand for accelerated compute for AI continues to outstrip supply. Generative AI uses more than 1000x the compute that perception AI needed, and as we shift to agentic AI (building context and reasoning) a further 30-100x increase in compute power is required. Foundational models are moving from training improvements in 2023-24 into inferencing, driving a further exponential increase in demand.
6. Geopolitics: Globalisation then versus deglobalisation now
In the late 1990s and early 2000s globalisation accelerated, driven by landmark trade agreements such as the launch of the euro, the US granting China permanent normal trade relations, and the Information Technology Agreement (ITA) on telecom liberalisation, which resulted in rapid multinational expansions and cross-border investments, rising commodity prices, and accelerating global trade. Conversely, 2025 has been characterised by a shift in trade policy, increasing tariffs and a focus on localising manufacturing as well as data sovereignty. These factors are increasing the demand for AI capex as more countries see AI as a strategic national priority, needing a manageable local supply chain and source.
7. Macroeconomics: Rates and inflation dynamics
In 1999 in the US, inflation was rising, unemployment had fallen to 4%, commodity prices were rising sharply, and interest rates were firmly in a tightening cycle, with rates rising from 4.75%, reaching 6.5% before the dotcom bubble burst in 2001. At present, while the current government shutdown has reduced data transparency, we appear to be in a period of weakening employment, signaling a loosening rather than tightening monetary backdrop.
8. AI valuations underpinned by earnings growth
The sharp run up in share prices in AI-related names has been driven by corporate earnings growth, rather than pure multiple expansion (company valuation). As noted earlier, with fewer start-ups, the public market large technology stocks have not shown signs of excess in the way that they did in 2000. In 2000, the technology sector traded at more than double that of the broader equity market. Currently it trades lower, at around 1.34x the broader equity market.9
NVIDIA is a good example of how this early phase of AI has been led by earnings growth. We continue to see strong positive earnings momentum from the technology sector driving economic growth. A sign of a market bubble is when the multiple (valuation) expands without profit growth – something we have yet to experience in the current AI wave, unlike in the dot.com era.
Figure 3: Tech valuations: A long way from 1999/2000 highs
Relative Technology to World forward P/E
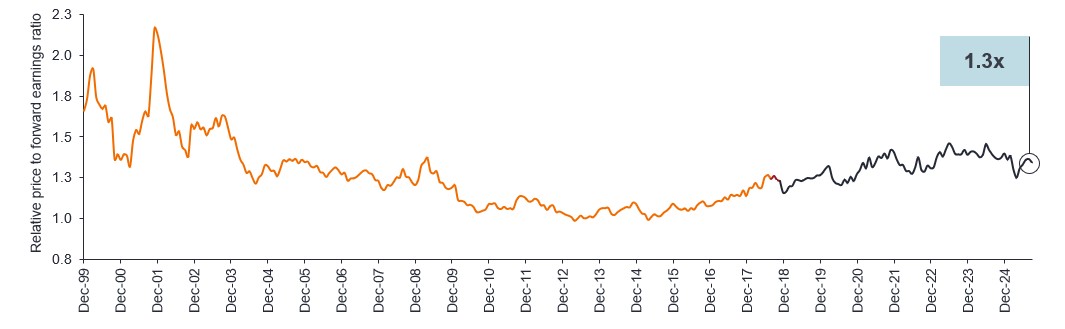
Source: Bernstein, as at 3 September 2025. Forward P/E = Price to forward earnings. (Orange line) MSCI ACWI Information Technology Sector, price-to-forward earnings relative to MSCI ACWI Index from December 1999 to November 2018 pre GICS sector changes in MSCI Global indices, (Red line) represents the change to (Grey line) MSCI ACWI Information Technology + ACWI Communication Services relative to MSCI ACWI Index to 3 September 2025 post GICS sector changes in MSCI Global indices. P/E is a popular ratio used to value a company’s shares compared to other stocks or a benchmark index. It is calculated by dividing the current share price by its earnings per share. Past performance does not predict future returns.
Conclusion
We continue to believe that AI represents a major new wave in technology. These waves typically take multiple years to play out, and while we are no longer in the very early stages of the AI wave, we remain excited about the breadth of investment opportunities that continue to emerge. Despite parallels with the dotcom era in terms of the levels of spending and disruption, we believe that this wave is more likely to ebb and flow – creating higher returns accompanied by higher volatility as it evolves – rather than bursting as the internet bubble did given multiple unique characteristics.
1 Janus Henderson Investors, Bloomberg as at 31 July 2025. Technology return referenced to MSCI ACWI Information Technology Index (Net Returns); Global Equities return referenced to MSCI ACWI Index (Net Returns). Period of measurement January 2006 through July 2025. Past performance does not predict future returns.
2 Goldmansachs.com; The Late 1990s Dot-Com Bubble Implodes in 2000.
3 CNBC.com; Forge Global; OpenAI leads private market surge as 7 tech startups reach combined $1.3 trillion valuation; 20 September 2025.
4 Lazonic, W and March, E; University of Massachusetts, Dartmouth College; The rise and fall of Lucent Technologies; 9 April 2010.
5 Open AI newsroom; OpenAI-NVIDIA systems partnership; 22 September 2025.
6 AMD.com; AMD and OpenAI Announce Strategic Partnership to Deploy 6 Gigawatts of AMD GPUs; 6 October 2025.
7 Nasdaq.com; Massive RPO Surge at Oracle: A Sign of Strong Forward Visibility; 11 September 2025.
8 Investing.com; Google CEO says biggest risk in AI is ‘missing out’; 10 February 2025.
9 Bloomberg as 30 September 2025. Technology return referenced to MSCI ACWI Information Technology Index.
Balance sheet: A financial statement that summarises a company’s assets, liabilities, and shareholders’ equity at a particular point in time. Each segment gives investors an idea as to what the company owns and owes, as well as the amount invested by shareholders.
Capital expenditure: Money invested to acquire or upgrade fixed assets such as buildings, machinery, equipment, or vehicles in order to maintain or improve operations and foster future growth.
Cash flow: The net balance of cash that moves in and out of a company. Positive cash flow shows more money is moving in than out, while negative cash flow means more money is moving out than into the company.
Hyperscalers: Providers of distributed computing environment and architecture that is designed to provide extreme scalability to accommodate workloads of massive scale.
IPO: The process of issuing shares in a private company to the public for the first time.
Loose and tight monetary policy: Loose monetary policy refers to a central bank increasing the supply of money and lowering borrowing costs. Monetary tightening refers to central bank activity aimed at curbing inflation and slowing down growth in the economy by raising interest rates and reducing the supply of money.
Neoclouds: New generation of AI-focused cloud infrastructure providers. They differentiate themselves from traditional hyperscalers (such as AWS, Azure, and GCP) by focusing on optimized GPU availability, flexible pricing, and specialized performance for AI/ML workloads, among other key features.
Remaining purchase obligations: RPOs are the total value of contracted products and/or services that have yet to be delivered to customers.
Sarbanes-Oxley Act: A US federal law that aims to protect investors by making corporate disclosures more reliable and accurate. The Act was spurred by major accounting scandalssuch as Enron and WorldCom, that misled investors and inflated stock prices.
Volatiity: The rate and extent at which the price of a portfolio, security, or index, moves up and down. If the price swings up and down with large movements, it has high volatility. If the price moves more slowly and to a lesser extent, it has lower volatility. The higher the volatility, the higher the risk of the investment.
These are the views of the author at the time of publication and may differ from the views of other individuals/teams at Janus Henderson Investors. References made to individual securities do not constitute a recommendation to buy, sell or hold any security, investment strategy or market sector, and should not be assumed to be profitable. Janus Henderson Investors, its affiliated advisor, or its employees, may have a position in the securities mentioned.
Past performance does not predict future returns. The value of an investment and the income from it can fall as well as rise and you may not get back the amount originally invested.
The information in this article does not qualify as an investment recommendation.
There is no guarantee that past trends will continue, or forecasts will be realised.
Marketing Communication.
Important information
Please read the following important information regarding funds related to this article.
- Shares/Units can lose value rapidly, and typically involve higher risks than bonds or money market instruments. The value of your investment may fall as a result.
- Shares of small and mid-size companies can be more volatile than shares of larger companies, and at times it may be difficult to value or to sell shares at desired times and prices, increasing the risk of losses.
- If a Fund has a high exposure to a particular country or geographical region it carries a higher level of risk than a Fund which is more broadly diversified.
- The Fund is focused towards particular industries or investment themes and may be heavily impacted by factors such as changes in government regulation, increased price competition, technological advancements and other adverse events.
- The Fund follows a sustainable investment approach, which may cause it to be overweight and/or underweight in certain sectors and thus perform differently than funds that have a similar objective but which do not integrate sustainable investment criteria when selecting securities.
- The Fund may use derivatives with the aim of reducing risk or managing the portfolio more efficiently. However this introduces other risks, in particular, that a derivative counterparty may not meet its contractual obligations.
- If the Fund holds assets in currencies other than the base currency of the Fund, or you invest in a share/unit class of a different currency to the Fund (unless hedged, i.e. mitigated by taking an offsetting position in a related security), the value of your investment may be impacted by changes in exchange rates.
- When the Fund, or a share/unit class, seeks to mitigate exchange rate movements of a currency relative to the base currency (hedge), the hedging strategy itself may positively or negatively impact the value of the Fund due to differences in short-term interest rates between the currencies.
- Securities within the Fund could become hard to value or to sell at a desired time and price, especially in extreme market conditions when asset prices may be falling, increasing the risk of investment losses.
- The Fund could lose money if a counterparty with which the Fund trades becomes unwilling or unable to meet its obligations, or as a result of failure or delay in operational processes or the failure of a third party provider.
Specific risks
- Shares/Units can lose value rapidly, and typically involve higher risks than bonds or money market instruments. The value of your investment may fall as a result.
- If a Fund has a high exposure to a particular country or geographical region it carries a higher level of risk than a Fund which is more broadly diversified.
- The Fund is focused towards particular industries or investment themes and may be heavily impacted by factors such as changes in government regulation, increased price competition, technological advancements and other adverse events.
- This Fund may have a particularly concentrated portfolio relative to its investment universe or other funds in its sector. An adverse event impacting even a small number of holdings could create significant volatility or losses for the Fund.
- The Fund may use derivatives with the aim of reducing risk or managing the portfolio more efficiently. However this introduces other risks, in particular, that a derivative counterparty may not meet its contractual obligations.
- If the Fund holds assets in currencies other than the base currency of the Fund, or you invest in a share/unit class of a different currency to the Fund (unless hedged, i.e. mitigated by taking an offsetting position in a related security), the value of your investment may be impacted by changes in exchange rates.
- When the Fund, or a share/unit class, seeks to mitigate exchange rate movements of a currency relative to the base currency (hedge), the hedging strategy itself may positively or negatively impact the value of the Fund due to differences in short-term interest rates between the currencies.
- Securities within the Fund could become hard to value or to sell at a desired time and price, especially in extreme market conditions when asset prices may be falling, increasing the risk of investment losses.
- The Fund could lose money if a counterparty with which the Fund trades becomes unwilling or unable to meet its obligations, or as a result of failure or delay in operational processes or the failure of a third party provider.