Key takeaways:
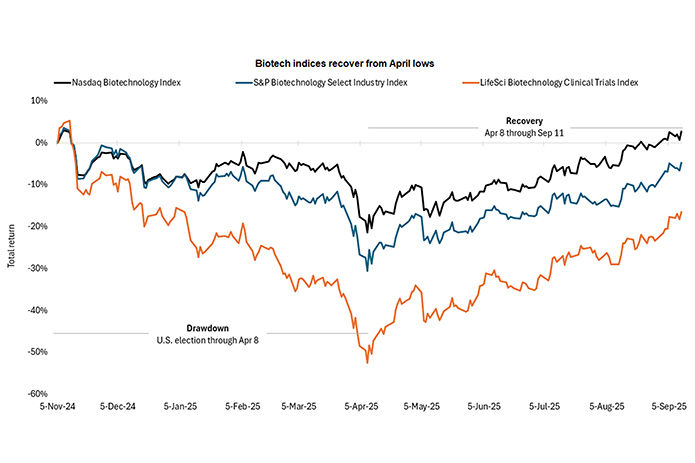
- While biotech stocks saw a steady drawdown from the U.S. presidential election through early April, the Nasdaq Biotechnology Index has fully recovered from its post-election low and development stage biotech stocks are up over 75% since April 8.
- Biotech stocks have gained traction due to positive clinical trial data, new product launches, and a strong pace of FDA drug approvals. Increasing merger and acquisition (M&A) activity and the prospect of lower interest rates also bode well for the sector.
- We believe durable performance drivers are in place as policy overhangs on the sector lift and innovation and medical advances continue.
| Drawdown | Recovery | Full period | |
| Nasdaq Biotechnology Index | -21.4% | 30.5% | 2.6% |
| S&P Biotechnology Select Industry Index | -30.6% | 37.2% | -4.7% |
| LifeSci Biotechnology Clinical Trials Index | -52.5% | 75.8% | -16.5% |
Source: Bloomberg. Cumulative total return as of 11 September 2025. Drawdown = U.S. election on 5 November 2024 through April low on 8 April 2025. Recovery = 8 April 2025 through 11 September 2025. Full period = 5 November 2024 through 11 September 2025.
Though we remain mindful that there could be near-term volatility as drug pricing policy is finalized, we believe the most acute phase of policy uncertainty for biotech may be behind us. And, given the recent uptick in M&A activity, the industry seems to agree. With Big Pharma facing numerous patent expirations in coming years, we’d expect this activity to continue, particularly in a more accommodative interest rate environment. It’s worth noting that, in the past, a resurgence of M&A activity has been a catalyst for recoveries from biotech downturns. Also of promise is the fact that the FDA has approved 36 new medicines in 2025, on pace with 2024, and positive clinical trial data and product launches highlight that the biotech sector remains a hub of innovation.
NASDAQ Biotechnology Index is a stock market index made up of securities of NASDAQ-listed companies classified according to the Industry Classification Benchmark as either the Biotechnology or the Pharmaceutical industry.
S&P Biotechnology Select Industry Index represents the biotechnology sub-industry portion of the S&P Total Markets Index. The S&P TMI tracks all the U.S. common stocks listed on the NYSE, AMEX, NASDAQ National Market and NASDAQ Small Cap exchanges. The Biotech Index is an equal weighted market cap index.
LifeSci Biotechnology Clinical Trials Index is an equal-weighted index comprised on US-listed biotechnology stocks with a lead product in human clinical trials but not yet approved for marketing. The index is reconstituted semi-annually and is provided by LifeSci Index Partners, LLC.
IMPORTANT INFORMATION
Equity securities are subject to risks including market risk. Returns will fluctuate in response to issuer, political and economic developments.
Health care industries are subject to government regulation and reimbursement rates, as well as government approval of products and services, which could have a significant effect on price and availability, and can be significantly affected by rapid obsolescence and patent expirations.
Volatility measures risk using the dispersion of returns for a given investment.
These are the views of the author at the time of publication and may differ from the views of other individuals/teams at Janus Henderson Investors. References made to individual securities do not constitute a recommendation to buy, sell or hold any security, investment strategy or market sector, and should not be assumed to be profitable. Janus Henderson Investors, its affiliated advisor, or its employees, may have a position in the securities mentioned.
Past performance does not predict future returns. The value of an investment and the income from it can fall as well as rise and you may not get back the amount originally invested.
The information in this article does not qualify as an investment recommendation.
There is no guarantee that past trends will continue, or forecasts will be realised.
Marketing Communication.
Important information
Please read the following important information regarding funds related to this article.
- Shares/Units can lose value rapidly, and typically involve higher risks than bonds or money market instruments. The value of your investment may fall as a result.
- Shares of small and mid-size companies can be more volatile than shares of larger companies, and at times it may be difficult to value or to sell shares at desired times and prices, increasing the risk of losses.
- If a Fund has a high exposure to a particular country or geographical region it carries a higher level of risk than a Fund which is more broadly diversified.
- The Fund is focused towards particular industries or investment themes and may be heavily impacted by factors such as changes in government regulation, increased price competition, technological advancements and other adverse events.
- The Fund may use derivatives to help achieve its investment objective. This can result in leverage (higher levels of debt), which can magnify an investment outcome. Gains or losses to the Fund may therefore be greater than the cost of the derivative. Derivatives also introduce other risks, in particular, that a derivative counterparty may not meet its contractual obligations.
- If the Fund holds assets in currencies other than the base currency of the Fund, or you invest in a share/unit class of a different currency to the Fund (unless hedged, i.e. mitigated by taking an offsetting position in a related security), the value of your investment may be impacted by changes in exchange rates.
- When the Fund, or a share/unit class, seeks to mitigate exchange rate movements of a currency relative to the base currency (hedge), the hedging strategy itself may positively or negatively impact the value of the Fund due to differences in short-term interest rates between the currencies.
- Securities within the Fund could become hard to value or to sell at a desired time and price, especially in extreme market conditions when asset prices may be falling, increasing the risk of investment losses.
- The Fund may incur a higher level of transaction costs as a result of investing in less actively traded or less developed markets compared to a fund that invests in more active/developed markets.
- The Fund could lose money if a counterparty with which the Fund trades becomes unwilling or unable to meet its obligations, or as a result of failure or delay in operational processes or the failure of a third party provider.