Chart to Watch: Can cash-flow-positive companies bounce back after 2025?
Portfolio Managers Benjamin Wang and Zoey Zhu explain why a divergence in performance between positive and negative cash-flow businesses could signal opportunity for investors focused on quality factors.
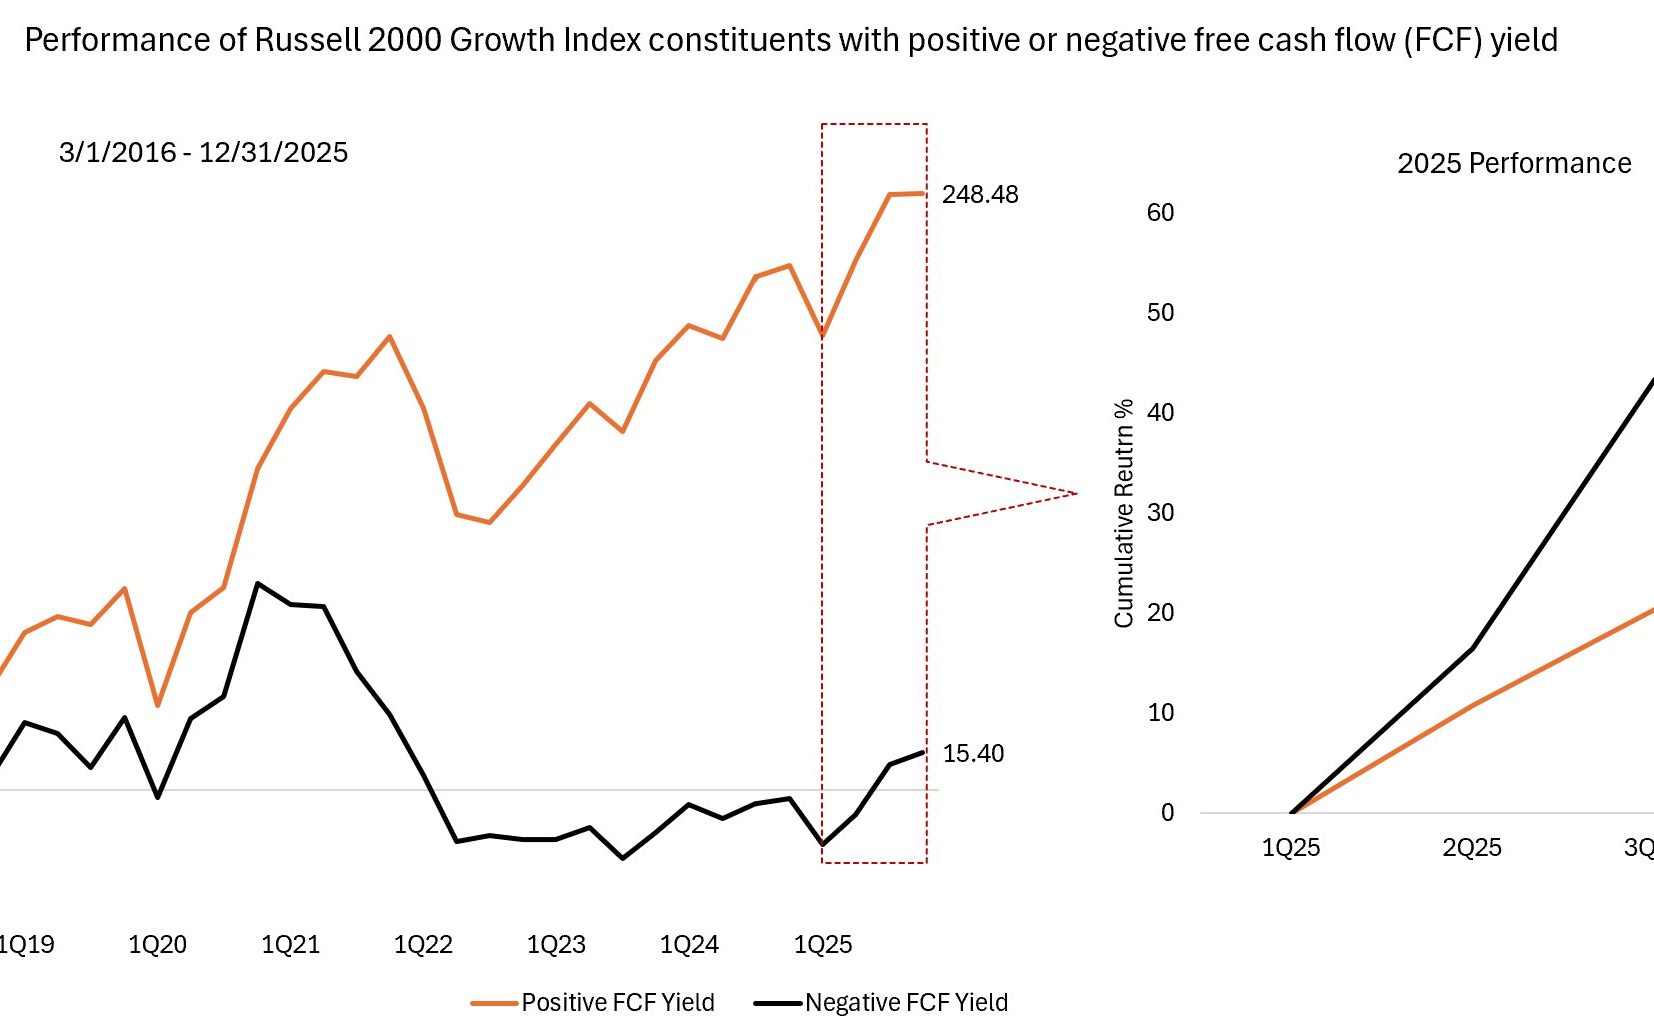
Source: Factset Data, Russell 2000 Growth Index universe, JHI analysis, 1 March 2016 to 31 December 2026.
We believe the market is overlooking refinancing risks embedded in negative free cash-flow companies. With a maturity wall approaching and elevated borrowing costs persisting, investors may benefit from repositioning toward businesses that can self-fund through volatile periods. -Benjamin Wang and Zoe Zhu
Key Takeaways
- Small- and mid-cap indices experienced an unusual reversal in 2025, where negative free cash-flow yielding companies dramatically outperformed positive FCF yielding peers – defying historical patterns across full market cycles.
- These indices carry significant exposure (20%-25%) to negative FCF businesses facing refinancing pressure as speculative-grade debt matures in a higher-for-longer rate environment.
- Portfolios tilting toward companies with durable and improving free cash flow have historically produced stronger compounding and lower downside capture. Any rotation back toward cash-flow-supported companies represents a potentially favorable setup for this factor exposure.
In 2025, a sharp factor reversal occurred where traditionally weak, negative FCF companies in small- and mid-cap indices dramatically outperformed their higher-quality peers. This divergence mostly occurred post-Liberation Day in a market driven by speculative, lower-quality, and higher-momentum stocks rather than fundamentals. The chart above details performance for the small-cap Russell 2000 Growth Index, but the same dynamic extended to the small- to mid-cap Russell 2500 Growth Index.
The strong performance of negative-FCF names is highly atypical given their longstanding tendency to underperform across full market cycles. Over a 10-year period, cash-generative companies substantially outperformed those with negative cash flow. This sets the stage for potential normalization.
Companies with negative FCF yield rely on external funding to operate or grow, making them more vulnerable to rising rates, refinancing needs, and business model stress. Positive FCF companies, meanwhile, generate excess cash, enabling self-funded reinvestment, disciplined balance sheet management, and reduced exposure to dilutive financing in tougher market environments.
We see the potential for mean reversion favoring high FCF-yielding companies. Many structurally weak FCF companies fall into the speculative-grade debt category, which faces a rising “maturity wall” as large blocks of debt come due in the next few years. The Russell 2000 and Russell 2500 indices have averaged 25% and 20% exposure to negative FCF companies, respectively, over the last decade. If the market begins to re-price these refinancing and cost-of-capital risks, leadership historically shifts back toward businesses with durable cash generation.
Free cash flow (FCF) yield is a financial ratio that measures how much cash flow a company has in case of its liquidation or other obligations by comparing the free cash flow per share with the market price per share and indicates the level of cash flow the company will earn against its share market value.
Russell 2000® Growth Index reflects the performance of U.S. small-cap equities with higher price-to-book ratios and higher forecasted growth values.
Russell 2500™ Growth Index reflects the performance of U.S. small to mid-cap equities with higher price-to-book ratios and higher forecasted growth values.
Smaller capitalization securities may be less stable and more susceptible to adverse developments, and may be more volatile and less liquid than larger capitalization securities.