As investors think about the impact of an inflection point in interest rates on their asset allocation calls, we provide some context for the deep pricing adjustment seen in European commercial real estate markets in the wake of rising interest rates. While it’s felt like a long journey, real estate investors are now asking themselves, “Are we nearly there yet?” and “Is it time to re-engage with the sector?”
A deeper look into valuations versus current fundamentals
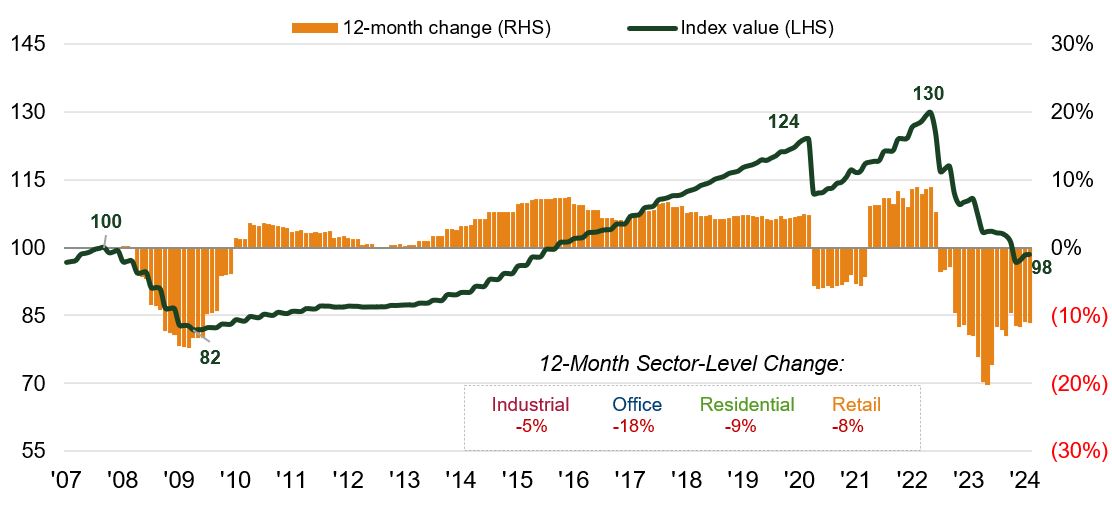
Data from respected real estate analysts Green Street seeks to provide a real-time view on the pricing of underlying real estate markets in Europe. The >25% decline in nominal asset prices, far higher in real (inflation-adjusted) terms, for average ‘grade B’ European commercial real estate highlights the magnitude of the correction seen in this downturn. As ever, averages can be misleading, with property sectors such as secondary offices seeing far greater declines (and still falling). Conversely, areas benefiting from structural growth such as student accommodation, rental housing and self-storage are seeing far shallower corrections (with many valuations already increasing again), supported by their stronger rental growth outlook.
Chart 1: Pan European B/B+ Quality Property Index

Source: Green Street Advisors European Commercial Property Monthly 1 February 2024. Green Street Pan European B/B+ Quality Property Index: preliminary estimated data to 1 February 2024. Green Street sector indices are built using the GDP weighted average price growth rates of individual markets rebased to respective ’07 peak.. There is no guarantee that past trends will continue, or forecasts will be realised.
Rebuilding of real estate risk premiums
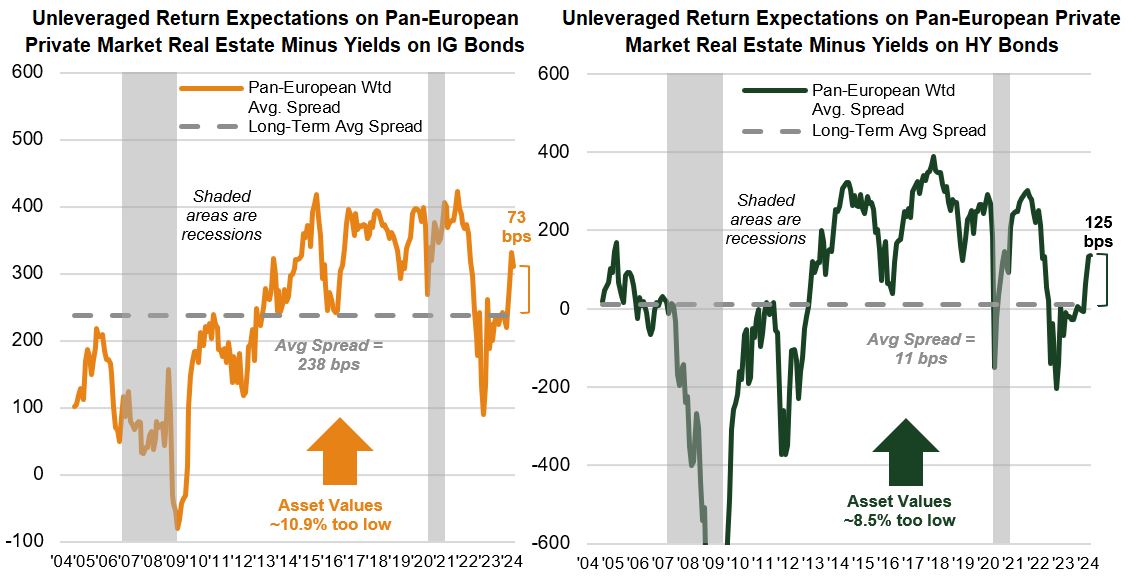
While we may have not yet reached the bottom for reported direct property market values, there are reasons to believe we may be approaching it. Real estate’s risk premium to bonds are being rebuilt to sit above long-term averages, with signs of investors returning to real estate markets – initially focused on areas of structural growth such as industrial/logistics assets and alternatives such as towers, storage and student accommodation.
Chart 2: Providing reassurance on returns versus debt costs

Source: BAML, Bloomberg, Moody’s, IHS Markit, Green Street. Green Street Advisors European Commercial Property Monthly 1 February 2024. Unleveraged return = difference in returns when financed with debt versus financed with equity (unleveraged). Spread = difference between private market real estate yield vs Investment Grade/High Yield bond yield. Bps= basis points. Past performance does not predict future returns.
A question of when, and not if
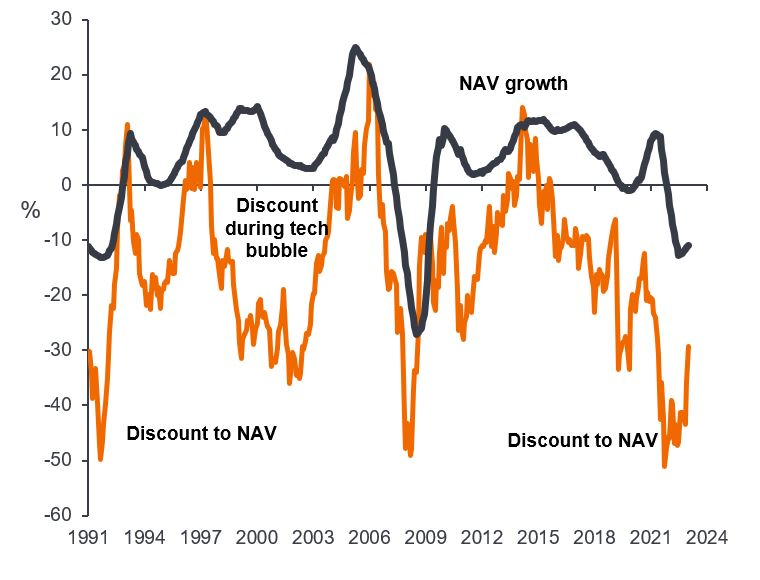
It is also important to reiterate that we invest in listed real estate markets, where prices are forward-looking, being set daily by stock market investors, and therefore they typically adjust more quickly to turning points in macroeconomic circumstances than backward-looking private real estate valuations. We saw this leading into the current downturn, with European real estate shares falling by >45% in the nine months to October 2022, well before direct property values were being adjusted materially lower.
Importantly, we believe the same is now happening in reverse – listed real estate began its recovery in Q4 2023 as interest rate expectations shifted, with the question now ‘when, not if’ rates in Europe will be cut in the face of falling inflation and low growth.
Chart 3: Listed real estate valuations are forward-looking; private valuations are backward-looking

Source: Morgan Stanley Research, Janus Henderson Investors analysis, as at 31 December 2023. NAV= net asset value, the total value of an asset minus outstanding debt and fixed capital expenses. When an investment’s market price is lower than its NAV, it is said to be trading at a discount. Past performance does not predict future returns.
Seeing positive indicators
While year-to-date moves in 2024 highlight the futility of trying to time markets, we believe the pullback seen in share prices is presenting investors with “a second bite of the cherry”.
Key to this view is evidence that:
- Operating fundamentals remain healthy; high occupancy levels and rising rents, which have benefited from inflation in the economy, have been a common theme in the current reporting period. This, coupled with growth from developments and embedded reversion, provides a pathway for sustained rental and earnings growth for many, even with higher interest costs. Logistics landlord Segro recently reported their results, highlighting that “…in the next three years we expect to increase our passing rents by more than fifty per cent through capturing embedded reversion, leasing vacant units and developing new space.”
- Listed REIT debt markets have reopened in recent months, with issuance by property companies in both the domestic and international bond markets. For example, German residential landlord Vonovia (VNA) issued its first bond issue since 2022; a GBP400m 12-year bond in January this year, at a EUR cost of 4.5% – far lower than the implied yield on their bonds six or 12 months ago. This is key to providing confidence that debt maturities in coming years are manageable, and that select companies can be relative winners in a world of ‘haves and have nots’ in terms of cost and access to capital, potentially providing opportunity for growth in the future.
- Confidence in operating fundamentals and expectations for stabilising valuations is giving companies greater confidence in their ability to reward shareholders through dividends and dividend growth. Noteworthy is the return of dividends from retail landlord Unibail-Rodamco-Westfield (URW) after a three-year suspension to shore up its balance sheet.
Our mantra: selectivity is key
Clearly challenges and risks remain and not all will escape unscathed from a correction of this magnitude. Therefore it remains paramount to be highly selective, focusing on balance sheet strength, and finding those areas of the market where rental income streams can provide ‘real’ growth in the face of slowing economies and structural shifts that affect the real estate market.
However, in our view, it is also important to remember that a significant correction in property prices has already occurred, and it is likely that 2024 will see an inflection point, marked by an end to the downward trajectory of prices. With many listed REIT shares still priced for a very pessimistic outlook, we feel a return of investor attention to the asset class is warranted and potentially can soon be rewarded.
Balance sheet: a financial statement that summarises a company’s assets, liabilities and shareholders’ equity at a particular point in time, used to gauge the financial health of a company.
Bond yield: level of income on a security, typically expressed as a percentage rate. For a bond, this is calculated as the coupon payment divided by the current bond price. Lower bond yields means higher bond prices.
Implied yield: the yield on the underlying bond of a futures contract implied by pricing it as though the underlying will be delivered at the futures expiration.
Investment grade & high yield bonds: investment grade bonds are typically issued by governments or companies perceived to have a relatively low risk of defaulting on their payments, reflected in the higher rating given to them by credit ratings agencies. High yield bonds usually carry a higher risk of the issuer defaulting on their payments, so have a higher interest rate (coupon) to compensate for the additional risk.
Nominal vs real: nominal prices/values represent current values; real prices/values are adjusted for inflation.
Real estate risk premium to bonds: the excess return that investors demand for investing in real estate compared to investing in bonds (for example corporate or government bonds).
IMPORTANT INFORMATION
There is no guarantee that past trends will continue, or forecasts will be realised.
REITs or Real Estate Investment Trusts invest in real estate, through direct ownership of property assets, property shares or mortgages. As they are listed on a stock exchange, REITs are usually highly liquid and trade like shares.
Real estate securities, including Real Estate Investment Trusts (REITs) may be subject to additional risks, including interest rate, management, tax, economic, environmental and concentration risks.