Public REITs for long-term property exposure
The Global Property Equities Team believes that apart from relative valuations, there are other key reasons to favour public over private REITs for forward-looking investors.

6 minute read
Key takeaways:
- The impact of interest rate rises on listed property and the resulting discrepancy between public and private real estate investment trust (REIT) valuations is well known.
- The era of “free money” is over. Real estate fundamentals and operating acumen are becoming the primary driver of real estate returns, which plays to the strengths of public REITs.
- Public REITs’ relatively low cost of capital leaves the asset class well positioned to take advantage of future opportunities.
This idea that public (listed) REITs are trading at much lower valuations to their private counterparts’ reported values has been written about extensively and is now accepted wisdom. We believe that the relative valuation gap between public and private real estate is not the most important reason to invest in public REITs today.
Aside from relative valuation, we would point long-term investors to two other factors that we think will be more important drivers of relative return between public and private real estate over the next decade:
1. In a world where money is no longer ‘free’, real estate fundamentals and operating acumen will be the primary driver of real estate returns. In this regard, we think public REITs have a meaningful advantage over their private counterparts.
Generationally cheap debt was a very significant driver of returns for highly leveraged (high debt usage) private real estate vehicles over the decade leading up to the pandemic. Some might even argue that the performance of certain private real estate funds was more about financial engineering than real estate fundamentals over this timeframe. Conversely, public REITs spent the 2010s deleveraging their balance sheets (reducing balance sheet debt), which was a headwind to cash flows. But US public REITs still outperformed their private counterparts by around 2.0% per annum1.
How did public REITs outperform with lower leverage?
In our view, public REITs outperformed private during the 2010s mainly because of superior real estate fundamentals. This includes more favourable property type exposure and stronger operating platforms that are costly, difficult to assemble, complex and better suited to infinite-lived public companies.
The majority of private real estate investment has been and remains in the core property types of office, retail, industrial, and apartments. Public REITs also offer high quality exposure to the core property types, but the majority of exposure today is to non-traditional property types like cell towers, data centres, self storage, senior housing, single tenant net lease and single-family rental.
Private real estate’s focus on the core property types is partly an exercise in necessity. For example, for a large private equity real estate manager, it is far more expedient to underwrite and acquire one office building for $400m and hire a real estate services firm to manage the asset, than to underwrite and acquire 40 self-storage facilities for the same price and establish an operating platform servicing thousands of underlying tenants.
Non-traditional property takes more time to assemble into a quality portfolio and is typically more operationally intensive than core property types. This makes non-traditional property a good match for infinite-lived public companies that can typically continuously access capital via the debt and equity markets. The core property types generally have ‘chunkier’ (higher dollar value) individual assets that are more conducive to the third-party management approach employed by private real estate. Non-core property types typically require much lower maintenance capital investment. They can benefit from more favourable supply/demand dynamics relative to the core property types given they are more exposed to demographic and technology tailwinds, increasing the potential for better cash flow growth.
For investors who agree with our view that the next decade of real estate returns will not be driven by cheap debt, but instead by the cash flow growth of underlying properties, public REITs can be a great place to be.
2. High-quality real estate naturally flows into the strongest hands, i.e. those with the best access to capital and the lowest cost of capital. Today this is very clearly the public REITs. The value of real estate compounds slowly over time; public REITs’ ability to enhance and expand their portfolios today should pay (literal) dividends over the next decade and beyond.
During the 2010s, cheap debt provided massive buying power to investors who were willing to pay the highest prices for real estate. Over this period, the average coupon on commercial mortgage-backed securities (CMBS) debt – a key source of debt financing for private real estate – was 4.5%, this then declined to 3.8% during the second half of the decade. The average term on CMBS debt was five years and the average spread (added yield) over a 5-year US Treasury Note was 160 basis points (1.6%). Today (11 August 2023), the yield on a 5-year US Treasury Note is about 4.3% and the average CMBS spread over Treasuries is 237 basis points (2.37%), which indicates a generic CMBS coupon of 6.7% 2. For office and retail assets, debt financing rates can be significantly higher than this.
What’s the impact now that real estate faces higher debt costs?
Real estate that was financed at high loan-to-values (LTVs) in the latter half of the 2010s at coupons averaging 3.8% are likely to see a dramatic decline (or elimination) in cash flows to equity when this debt needs to be refinanced at rates higher than 6.5% now. Balance sheet pressure for private real estate owners is very real.
Financial strength now a key characteristic of the sector
US REITs raised $21.6 billion from secondary debt in the first half of 2023
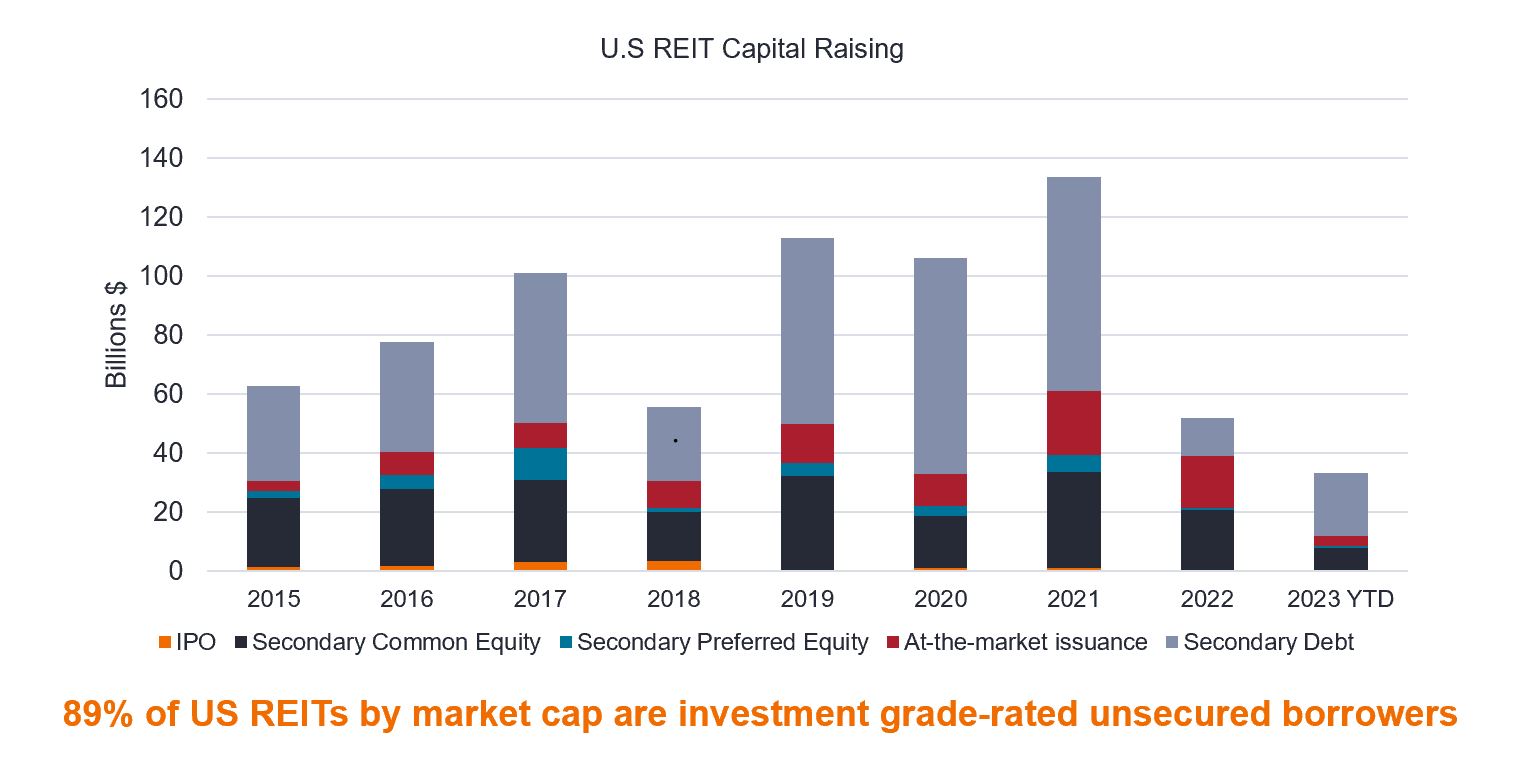 Source: NAREIT, S&P Global Market Intelligence as at 30 June 2023. Secondary debt is the trading of debt after it is issued.
Balance sheet stress combined with redemption queues means we are likely to see private real estate owners selling real estate to raise capital. Public REITs with generally lower debt coupled with continuous access to the unsecured credit and equity markets are ready and waiting to take advantage of acquisition opportunities as they arise. We have already seen meaningful examples of this and expect there will be more to come. Real estate compounds in value slowly over time – today’s acquisitions of high-quality real estate look set to fuel increased growth in public REITs for years to come.
Conclusion
Investors willing to study the historical context of public versus private real estate portfolio construction and returns in conjunction with the very different environment that exists today may come to appreciate our point of view on the long-term investment merits of public REITs vis-à-vis their private counterparts.
A cheap valuation relative to private real estate may be the “sizzle” for investing in public REITs at the moment, but the “steak” comes in the form of an increasingly divergent return outlook, which public REIT investors may likely savour for years to come.
Balance sheet: a financial statement that summarises a company’s assets, liabilities and shareholders’ equity at a particular point in time. Balance sheet strength refers to the financial strength of a company. CMBS: a fixed-income security created by banks by bundling a group of commercial real estate loans, which are rated according to risk then sold to investors.. CMBS loans are used by REITs to finance property investments. Coupon: a regular interest payment that is paid on a bond/debt. Investment grade rating: awarded to a bond or portfolio of bonds/debt that are deemed to have higher credit ratings and as such a relatively low risk of defaulting on their payments. Loan-to-Value (LTV) ratio: calculated by dividing property loan amount by the property value. Used by lenders to assess the level of risk exposure when underwriting a loan/debt. Spread: difference in the yield of a corporate bond over that of an equivalent government bond. Unsecured debt: debt that is not backed by any asset or collateral, therefore there is a higher risk of default risk, which is reflected in higher interest rates to compensate lenders. Yield: the level of income on a security, typically expressed as a percentage rate. For a bond, this is calculated as the coupon payment divided by the current bond price. FTSE Nareit All Equity REITs Index tracks the performance of the U.S. real estate investment trust (REIT) market. ODCE Index is a core capitalisation-weighted index that includes only unlisted (private) open-end diversified core strategy funds with at least 95% of their investments in US markets.
1 Bloomberg, Janus Henderson Investors 10 years to 31 December 2019. FTSE Nareit All Equity REITs Index vs NCREIF ODCE Index. Past performance does not predict future returns.
2 Bloomberg, US 5-Year Treasury Note yield; ICE BofA U.S. Fixed-Rate Commercial Mortgage-Backed Securities (CMBS) Index OAS versus Govt as at 11 August 2023.
IMPORTANT INFORMATION
REITs or Real Estate Investment Trusts invest in real estate, through direct ownership of property assets, property shares or mortgages. As they are listed on a stock exchange, REITs are usually highly liquid and trade like shares.
Real estate securities, including Real Estate Investment Trusts (REITs) may be subject to additional risks, including interest rate, management, tax, economic, environmental and concentration risks.
6 minute read
Key takeaways:
- The impact of interest rate rises on listed property and the resulting discrepancy between public and private real estate investment trust (REIT) valuations is well known.
- The era of “free money” is over. Real estate fundamentals and operating acumen are becoming the primary driver of real estate returns, which plays to the strengths of public REITs.
- Public REITs’ relatively low cost of capital leaves the asset class well positioned to take advantage of future opportunities.