
Key takeaways:
- The rules of equity investing have changed, with normalising interest rates, geopolitical disruption and AI making individual company strengths and weaknesses increasingly important in determining their prospects.
- For investors, seemingly calm markets can conceal greater volatility at a stock level, while shifting equity-bond correlations may limit the impact of traditional diversification models in addressing risk.
- For absolute return investors, greater dispersion can be an opportunity, creating more scope to exploit differences between companies through long and short positions.
The regime really has changed in equities. We can see it in the way individual shares are behaving. But why has that happened? What does it mean for investors? And does absolute return have a useful role to play in this new world?
Stock dispersion, the difference between the returns of individual shares, has risen sharply in recent years. We saw it coming through in 2024, and it remained high in 2025 and 2026 (Exhibit 1).
Exhibit 1: Stock dispersion today is close to 2009 peaks
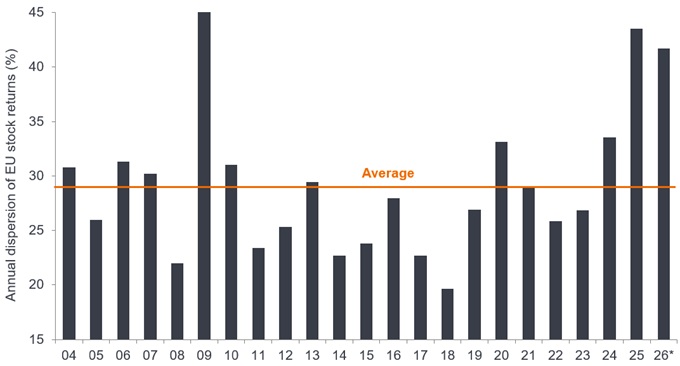
Source: Morgan Stanley Alpha, FactSet, 1 January 2004 to 30 June 2026. Dispersion is calculated by taking the annual returns of each stock in the MSCI Europe Index and then measuring the standard deviation across all the individual stock returns as a percentage.
* Note: 2026 uses trailing 12 months’ data to 29 June 2026. For illustrative purposes only. Past performance does not predict future returns.
Over the past 20 years, it has only been higher in 2009, during the Global Financial Crisis (GFC). At the time we saw a very different environment. Stock dispersion was rising because enormous and uneven economic shocks were widening the gap between the market’s winners and losers.
So why has dispersion returned now? I think there are three main reasons.
1) Money has a cost again
The first is that the cost of capital has changed. When money has a cost, valuation matters more. Business models matter. Competitive positions matter. Management matters. Those things may sound obvious, but for a long period the normal rules did not always seem to apply.
As absolute return investors, we know first-hand how difficult it can be to invest when there is almost no cost of capital. Just a few years ago, borrowing was so cheap that weak companies could keep their doors open by taking on more debt.
You could look at a business and be confident that it would fall short of earnings expectations. You might see that an acquisition was not integrating well. That could appear to be a good opportunity to take a short position, but then the share price would rise anyway. The analysis at the company level was sound, yet it did not seem to matter. In effect, the cost of borrowing was so low that the normal rules of the game had been suspended.
Roll forward to today and those rules are back. You can be long one bank and short another. You can be long one consumer goods company and short one of its competitors. The outcome is much more likely to depend on the business model, the valuation and the company’s prospects.
That is the kind of environment we want to invest in. Where the characteristics of a business matter, and stock selection has a better chance of separating the winners from the losers.
2) Geopolitics is disrupting companies and markets
The second reason is the geopolitical landscape. It seems so normal now, given how recent the phenomenon is, but the effect of social media cannot be ignored, where claims can spread quickly and have an outsized influence on market volatility. Sometimes those claims have a basis in fact. Sometimes they do not. But markets can react before anyone has had much time to assess what has actually changed.
We see the same problem in the constant discussion around tariffs, onshoring and nearshoring, ceasefires in the Middle East or possible changes to drug pricing. The subject may be different from one day to the next, but the effect is similar. Companies are being asked to operate in an environment where policy can change quickly and where expectations move even faster.
It can feel like noise, but it is changing the way companies do business. It is affecting investment decisions, supply chains and corporate strategy. That disruption is creating greater differences in how stocks are priced. For long and short investors, those differences can create opportunities.
3) AI is creating a more complicated set of winners and losers
The third reason is artificial intelligence (AI). When AI first gained traction as a trend in the investment world, which was really not very long ago, the market’s view was quite binary. A company was either seen as a potential winner from AI or a potential loser.
There were periods when almost every software company moved in the same direction, like in the final quarter of 2025. Businesses considered to be AI winners rose together. Roll forward a year and we are seeing much more differentiation in the performance of individual shares.
Take software companies. If a business provides basic accountancy services that an AI agent could replicate, we might expect it to come under pressure. A software developer providing something genuinely proprietary may find itself in a stronger position, able to differentiate from its peers in capability.
AI is also beginning to change industries that adopt it successfully. Some companies operating with low margins may be able to use AI services to improve how they work. Others may lack the corporate culture needed to make that change. This is becoming less about whether an industry wins or loses. It is becoming more about which individual companies can adapt. Once again, the important point for us is that this creates dispersion.
Uncertainty on the surface and beneath it
To bring this to life, we track a number of sources that measure volatility, such as the World Uncertainty Index. In what now spans three decades of managing money, the world has always felt uncertain. Some periods have felt more uncertain than others. That is part of investing. What stands out when we look back through the history of these indices, however, is the current level of uncertainty. We seem to have moved onto a different plane altogether (Exhibit 2).
Exhibit 2: Riding the news headline rollercoaster
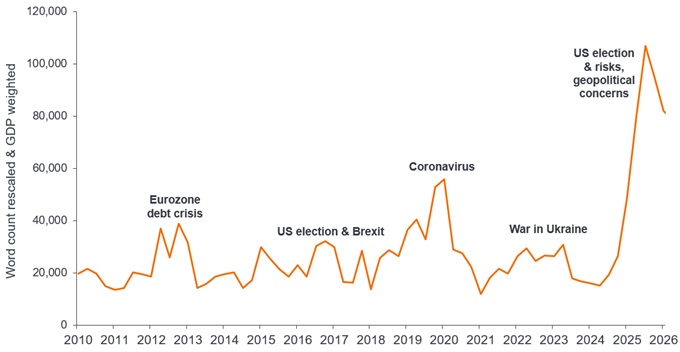
Source: Morgan Stanley, Janus Henderson Investors, 1 January 2010 to 30 September 2026. The World Uncertainty Index is a measure that tracks uncertainty across the globe. It quantifies overall sentiment by evaluating the type and occurrence of positive and negative words in the Economist Intelligence Unit country reports.
Perhaps it is no surprise, then, that the investment environment is changing. We can see it particularly clearly in individual stock volatility. Stock volatility relative to index volatility has been rising since the COVID period. But if you look at global stock markets as a whole, it does not necessarily feel as though volatility is especially high. At the index level, things can appear quite calm.
Look beneath the surface, however, and the picture is different. The gap between the performance of individual shares has widened significantly (Exhibit 3).
Exhibit 3: The volatility beneath the surface
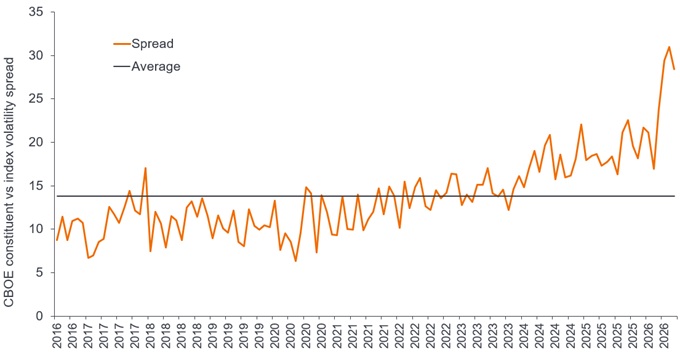
Source: Morgan Stanley, Janus Henderson Investors, 30 September 2016 to 30 September 2026. The chart here compares the difference in volatility at an individual stock level and the index level. Past performance does not predict future returns.
Conclusion
Markets are changing and dispersion once again seems a persistent and heightened characteristic of the investment world. That is creating more opportunities for stock selection, even when the major indices appear relatively calm.
At the same time, we are seeing changes in policy that can have significant consequences for companies. Economic conflict has placed parts of the private sector on the front line of national security. Supply chains are fragmenting into regional systems, while resilience is increasingly taking precedence over cost. Security has become a more important part of how markets operate.
The relationship between equities and bonds may also be changing. For much of my career, we have operated in a world where the correlation between these asset classes was consistently negative. Evidence from the past three years suggests that is no longer so clear cut. That may prove temporary, or it may not.
Either way, it is an environment in which absolute return may have a useful role. We believe that greater stock dispersion can create opportunities to generate returns, while careful stock selection may also help to manage downside risk. For investors, that makes the area worth exploring further.
Definitions:
Absolute return investing: A type of investment strategy that seeks to generate a positive return over time, regardless of market conditions or the direction of financial markets, typically with a low level of volatility.
Cost of capital: The minimum level of revenue a company must reach before it can generate value. It includes the cost of borrowing (ie. interest plus any fees on loans), plus the implicit return that shareholders or investors expect to receive in exchange for investing.
Eurozone debt crisis: A major sovereign debt and banking crisis between 2009 and 2018, where several member states of the European Union using the euro (notably Greece, Portugal, Ireland, Spain, and Cyprus) found themselves unable to repay or refinance their government debt without external support.
Gross Domestic Product (GDP): A measure of the size and heath of a country’s economy over a specific period, usually either quarterly or yearly.
GDP weighted: Where something (eg. an index) is sized or proportioned based on the GDP of each country or region included, relative to the total.
Global Financial Crisis (GFC): The global economic crisis from mid-2007 to early 2009 that began with losses related to mortgage-backed financial assets in the US and spread to affect financial markets and banks globally. Also known as the ‘Great Recession’.
Long investing: An investment strategy where a security or stock is bought with the intention of holding over a long period in the expectation that it will rise in value.
MSCI Europe Index: The MSCI Europe Index captures the stock prices for large and medium-sized companies across Developed Markets (DM) countries in Europe.
Spread (Exhibit 3): Here, showing the difference in volatility at an individual stock level and the index level.
Short investing: Fund managers use this technique to borrow and then sell what they believe are overvalued assets (such as stocks), with the intention of buying them back for less when the price falls. The position profits if the security falls in value. #
Standard deviation: A statistical measure that tells you how spread out a set of numbers is around its average.
Stock dispersion: How much the returns of each variable (eg. stocks in a benchmark) differ from the average return of the benchmark.
Stock selection: The process of analysing and choosing individual company shares to buy or sell, rather than investing in a broad market index or fund.
Volatility: The rate and extent at which the price of a portfolio, security, or index, moves up and down. If the price swings up and down with large movements, it has high volatility. If the price moves more slowly and to a lesser extent, it has lower volatility. The higher the volatility, the higher the risk of the investment.
—–
Important information
These are the views of the author at the time of publication and may differ from the views of other individuals/teams at Janus Henderson Investors. References made to individual securities do not constitute a recommendation to buy, sell or hold any security, investment strategy or market sector, and should not be assumed to be profitable. Janus Henderson Investors, its affiliated advisor, or its employees, may have a position in the securities mentioned. Past performance does not predict future returns. The value of an investment and the income from it can fall as well as rise and you may not get back the amount originally invested. The information in this article does not qualify as an investment recommendation. There is no guarantee that past trends will continue, or forecasts will be realised. Marketing Communication.
Queste sono le opinioni dell'autore al momento della pubblicazione e possono differire da quelle di altri individui/team di Janus Henderson Investors. I riferimenti a singoli titoli non costituiscono una raccomandazione all'acquisto, alla vendita o alla detenzione di un titolo, di una strategia d'investimento o di un settore di mercato e non devono essere considerati redditizi. Janus Henderson Investors, le sue affiliate o i suoi dipendenti possono avere un’esposizione nei titoli citati.
Le performance passate non sono indicative dei rendimenti futuri. Tutti i dati dei rendimenti includono sia il reddito che le plusvalenze o le eventuali perdite ma sono al lordo dei costi delle commissioni dovuti al momento dell'emissione.
Le informazioni contenute in questo articolo non devono essere intese come una guida all'investimento.
Non vi è alcuna garanzia che le tendenze passate continuino o che le previsioni si realizzino.
Comunicazione di Marketing.
Important information
Please read the following important information regarding funds related to this article.
- Le Azioni possono perdere valore rapidamente e normalmente implicano rischi più elevati rispetto alle obbligazioni o agli strumenti del mercato monetario. Di conseguenza il valore del proprio investimento potrebbe diminuire.
- Un’esposizione elevata a un determinato paese o a una specifica regione geografica comporta un livello di rischio più elevato rispetto a un Fondo più ampiamente diversificato.
- Qualora il Fondo detenga attività in valute diverse da quella di base del Fondo, o l’investitore detenga azioni/quote di una valuta diversa da quella del Fondo (a meno che non sia coperta, ovvero cerchi di mitigare i movimenti del tasso di cambio tra la valuta della classe di azioni/quote e la valuta di base del Fondo), il valore dell’investimento potrebbe subire le oscillazioni del tasso di cambio.
- I derivati possono essere utilizzati per aiutare a raggiungere l’obiettivo di investimento. Ciò potrebbe determinare una “leva” (livelli più elevati di debito), che potrebbe amplificare i risultati dell’investimento Le perdite o i guadagni potrebbero superare il costo del derivato. I derivati comportano rischi aggiuntivi, in particolare il rischio che la controparte del derivato non adempia ai suoi obblighi contrattuali.
- Se il Fondo, o una sua classe di azioni con copertura, intende attenuare le fluttuazioni del tasso di cambio tra una valuta e la valuta di base, la stessa strategia di copertura potrebbe generare un effetto positivo o negativo sul valore del Fondo, a causa delle differenze di tasso d’interesse a breve termine tra le due valute.
- I titoli potrebbero diventare difficili da valutare o da vendere nel momento e al prezzo desiderati, specialmente in condizioni di mercato estreme caratterizzate da una discesa dei prezzi delle attività, con conseguente incremento del rischio di perdite sull’investimento.
- Potrebbero verificarsi perdite qualora una controparte non intendesse più o non fosse più in grado di adempiere ai propri obblighi, o a causa di un errore o di un ritardo nei processi operativi o di una negligenza di un fornitore terzo.
- L’approccio alla sostenibilità adottato può escludere potenziali investimenti che non soddisfano determinati criteri (ad esempio, criteri non finanziari quali i filtri ESG). Ciò potrebbe comportare differenze in termini di rendimento rispetto a prodotti simili che sono autorizzati a effettuare tali investimenti.