
Key takeaways:
- AI infrastructure spending is accelerating faster than markets expected, with hyperscaler capex forecasts more than doubling since early 2025, driving unprecedented funding requirements.
- Rising tech debt issuance is likely to increase supply pressure, potentially keeping investment grade technology spreads wider than other corporate sectors despite strong underlying company fundamentals.
- This heavy supply may favor allocating to sectors where supply dynamics are more supportive or selectively capturing opportunities in high yield and securitized markets.
Back in November 2025 we warned about the level of capital raising that would be needed to fund the artificial intelligence (AI) buildout and how supply from tech companies – particularly the hyperscalers – was set to reshape the technical picture for corporate credit. While we were right to be cautious, the market, if anything, underestimated the level of tech supply and we argue might still be doing so.
It’s all relative
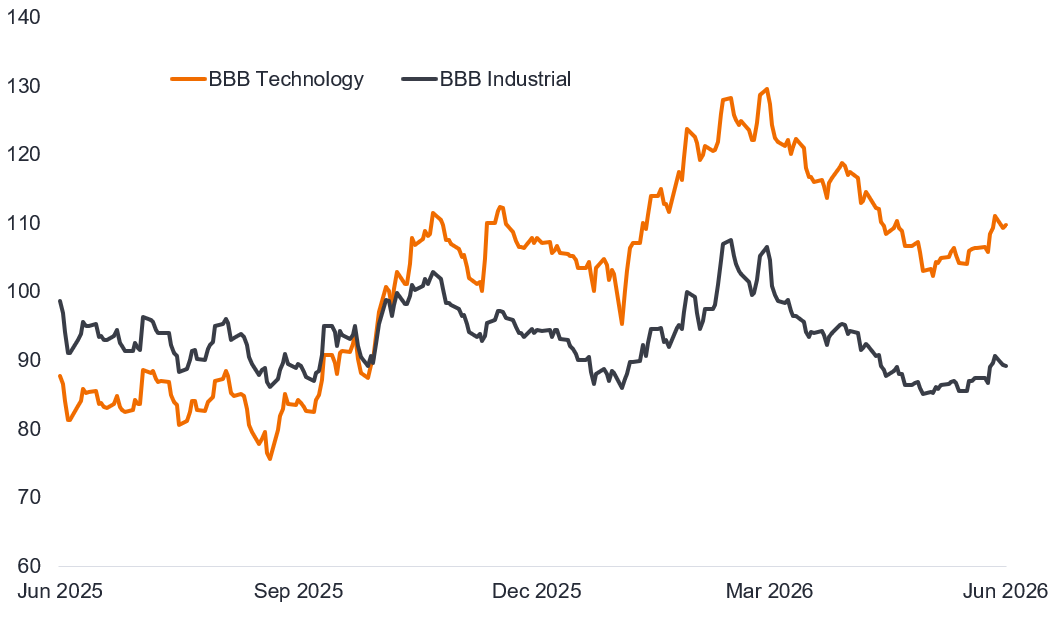
Our caution toward investment grade tech proved to be the right call as spreads on investment grade (IG) industrials have tightened since November while tech has seen a noticeable widening. For example, BBB spreads on tech and industrials were both around 100 basis points back in November, yet tech has gapped 10 basis points wider to end June 2026, while industrials have tightened around the same over that period.
Figure 1: Tech spreads widen versus industrials
US investment grade BBB spreads (basis points)
Source: Bloomberg, Bloomberg US Investment Grade Technology BBB Index, Bloomberg US Investment Grade Industrial BBB Index, Option-adjusted spread (OAS) over Treasuries in basis points, 30 June 2025 to 30 June 2026. One basis point = 0.01%, 100 bps = 1%. Past performance does not predict future returns.
One direction – AI capex trends higher
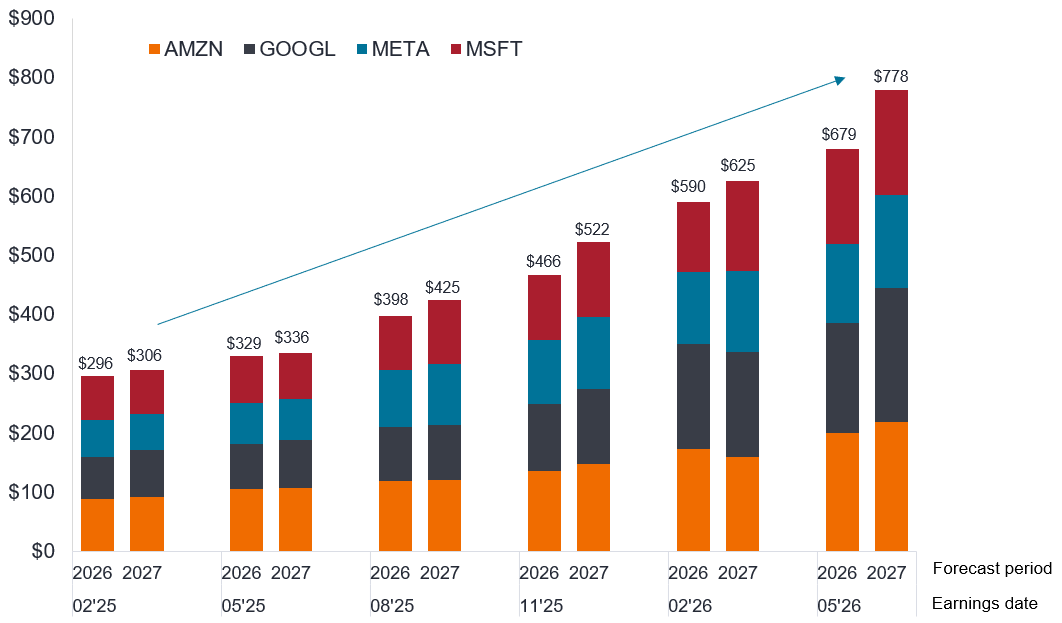
Driving the pressure on tech related spreads has been the sheer scale of capex spending. The following chart reveals how much estimated capex spending projections have risen over the course of the last 18 months. The projections are derived from market estimates around each quarterly earnings period for the Big 4 hyperscalers. Back in February 2025, the market was predicting around US$300 billion in capex in 2026 and 2027. Fast forward to May 2026 and the market is anticipating more than double the level of capex it suggested back in February 2025.
Figure 2: Hyperscaler capex estimates trending higher
Big 4 capex estimates (US$ billion)
Source: Bloomberg, S&P Capital IQ sellside consensus estimates, Janus Henderson Investors, Big 4 = Amazon, Google (Alphabet), Meta, Microsoft, February 2025 to May 2026. References made to individual securities do not constitute a recommendation to buy, sell or hold any security, investment strategy or market sector, and should not be assumed to be profitable. Janus Henderson Investors, its affiliated advisor, or its employees, may have a position in the securities mentioned. There is no guarantee that past trends will continue, or forecasts will be realized.
The race to build out AI is unlikely to ease, particularly as some of the questions around payback may begin to fade. One of the big AI companies, Anthropic (only founded as recently as 2021) has seen its revenue balloon and is anticipating moving into quarterly operating profit for the first time, potentially as soon as its next set of results.1 Anthropic is one of several large clients of the hyperscalers, so strong unit economics combined with unprecedented growth at scale should underpin continued demand. More anecdotally, companies are noticing that if they are not using AI they risk being left behind. This is increasing uptake and leading to heavy demand for the level of compute available, particularly as more users use advanced agents rather than simpler chat. Monetising compute is therefore becoming less of a concern, but users are noticing that bills are rising as greater usage outstrips the fall in the cost of tokens (the basic metric of AI input and output). The bottleneck remains available compute, creating demand for the AI buildout.
Working with big numbers
Organic cash flow can pay for some of the AI capex but even the cash-generative hyperscalers are having to tap capital markets. Barclays reckons the Big 4 hyperscalers together with Oracle, will issue around $240 billion in IG bonds this year alone.2
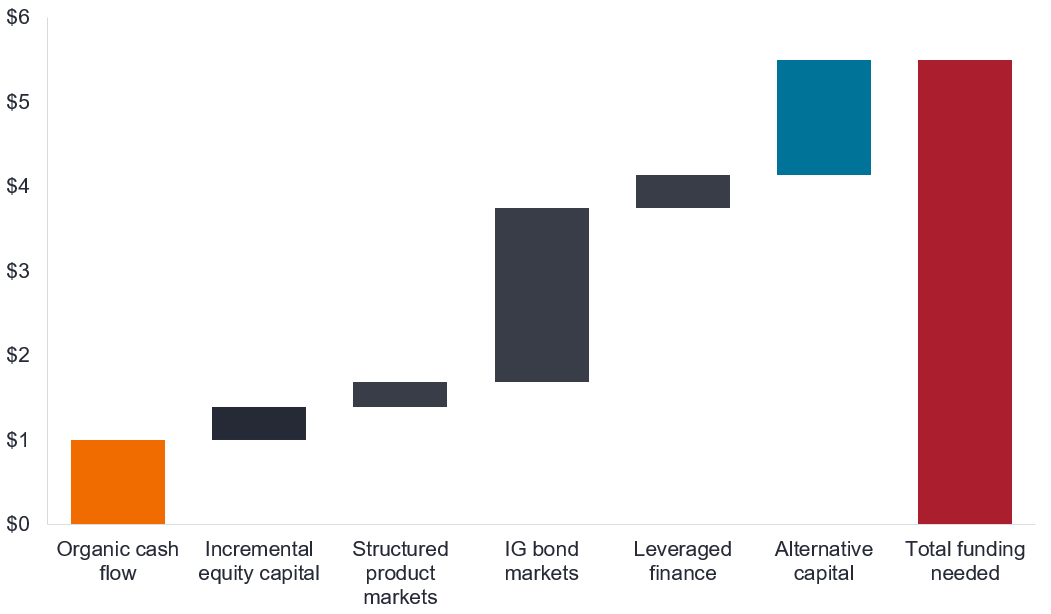
Widening the remit more broadly to cover hyperscalers, data center owners and potential chip financing and J.P. Morgan reckons organic cash flow will represent around one fifth of $5.5 trillion of capex funding over the next five years, with IG bonds needing to fund almost two fifths, around $2.1 trillion, and incremental equity capital around $400 billion. The rest to be made up of funding from leveraged finance, securitized markets and alternative capital.3
Figure 3: Anticipated AI capex funding sources (US$ trillion)
Source: J.P. Morgan, 17 June 2026. There is no guarantee that past trends will continue, or forecasts will be realized.
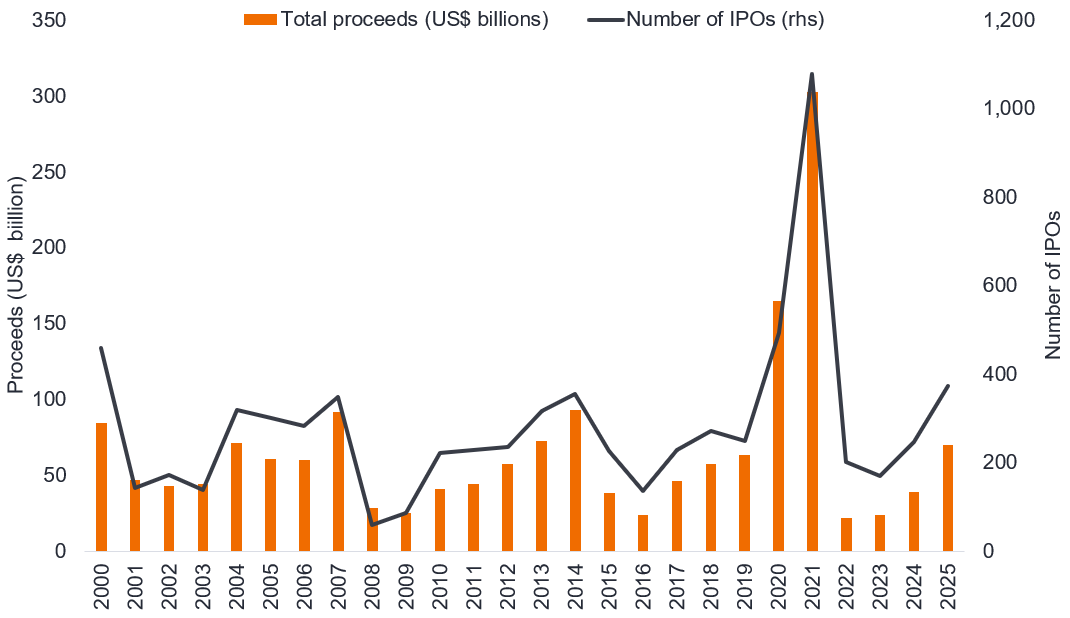
These are all big numbers. The demands on the IG bond market are coming at a time when the US equity market is set to make a bigger call on investors. Many of the hyperscalers are beginning to undo years of carefully manicured capital allocation, with share buybacks now making way for share issues. Alphabet alone raised US$85 billion in equity in the first half of 2026.4 Meanwhile, SpaceX raised US$86 billion through its initial public offering (IPO) once over-allotments are included.5 Based on the chart below the SpaceX IPO alone would catapult 2026 into the biggest year for IPO proceeds since 2021. The second half of this year already has potentially huge IPOs from Anthropic and OpenAI (ChatGPT) waiting in the wings, although the latter may delay until 2027.
Figure 4: US IPO proceeds (US$ billion) and number
Source: SEC, US Initial public offering (IPO) proceeds, calendar years, 2000 to 2025.
Credit markets, therefore, are not just competing for attention among fixed income investors but also having to contend with an equity market that is itself looking for historically high levels of funding. And this comes at a time when the US economy is showing signs of a pickup, so demands for working capital increase.
Diversification and concentration
The pressure on companies is reflected in the diversification in funding. Jumbo issues are being denominated in multiple currencies. In some respects, this is helpful because it widens exposure of the AI story to European investors looking for EUR and GBP issues. It is also creating opportunities within high yield and securitized, both directly in AI capex and wider infrastructure and energy requirements. Returning to the earlier point on monetisation, it is possible that some of the high yield-rated projects might get upgraded to investment grade as they near completion – ironically further swelling the proportion of tech within investment grade.
As of 30 June 2026, technology made up ~10% of the US Corporate Index (banking is the highest at ~22%). The US Corp Index is US$7.6 trillion in size, while tech is ~US$767 billion.6 So three years of $250bn+ (on the conservative side) in issuance doubles the technology market and likely pencils to a high-teens percentage of the index, or double where it is today. Investors tend to be wary of sectors that see an explosion of debt (think telecoms or energy in the mid-2010s) and typically demand a premium for lending. While many of larger AI-related borrowers retain enviably strong balance sheets, it is challenging not to envision spreads on IG tech going wider.
1Source: Wall Street Journal “Mind-blowing growth is about to propel anthropic into its first profitable quarter”, 20 May 2026.
2Source: Barclays, 21 May 2026. There is no guarantee that past trends will continue, or forecasts will be realized.
3Source: J.P. Morgan, 17 June 2026. There is no guarantee that past trends will continue, or forecasts will be realized.
4Source: Alphabet press release, 2 June 2026.
5Source: SpaceX press release, 15 June 2026.
6Source: Bloomberg, Bloomberg US Corporate Index, market value weights in US dollars,30 June 2026.
Note: Après-moi, le déluge (After me, the deluge) is a phrase attributed to King Louis XV of France. This phrase of indifference to excess was seen as a portend of the revolution to come.
Fixed income securities are subject to interest rate, inflation, credit and default risk. The bond market is volatile. As interest rates rise, bond prices usually fall, and vice versa. The return of principal is not guaranteed, and prices may decline if an issuer fails to make timely payments or its credit strength weakens.
High-yield or “junk” bonds involve a greater risk of default and price volatility and can experience sudden and sharp price swings.
Securitized products, such as mortgage- and asset-backed securities, are more sensitive to interest rate changes, have extension and prepayment risk, and are subject to more credit, valuation and liquidity risk than other fixed-income securities.
Bloomberg US Corporate Bond Index: This measures the investment grade, fixed rate, taxable, corporate bond market. It includes USD denominated securities publicly issued by US and non-US industrial, utility and financial issuers.
Balance sheet: Typically an accounting reference relating to assets versus liabilities for an entity, whether a household or a corporation.
Capex: Money a business spends on major, long-term assets such as property and equipment (tangible assets) or technology, software, trademarks, patents etc (intangible assets) to facilitate new projects or investments that support business growth and expansion.
Cash flow: The net balance of cash that moves in and out of a company. Positive cash flow shows more money is moving in than out, while negative cash flow means more money is moving out than into the company.
Corporate bond: A bond issued by a company. Bonds offer a return to investors in the form of periodic payments and the eventual return of the original money invested at issue on the maturity date.
Credit rating: A score given by a credit rating agency such as S&P Global Ratings, Moody’s and Fitch on the creditworthiness of a borrower. For example, S&P ranks investment grade bonds from the highest AAA down to BBB and high yields bonds from BB through B down to CCC in terms of declining quality and greater risk, i.e. CCC rated borrowers carry a greater risk of default.
Credit spread: The difference in yield between securities with similar maturity but different credit quality. Widening spreads generally indicate deteriorating creditworthiness of corporate borrowers, and narrowing indicate improving.
Default: The failure of a debtor (such as a bond issuer) to pay interest or to return an original amount loaned when due.
Hyperscaler: Technology providers that provide IT architectures that scale dynamically to handle exponential increases in workload and data. Apart from capacity, they offer enterprise-grade cloud services, flexible hardware resources, and robust software environments that support a broad range of AI applications.
High yield bond: Also known as a sub-investment grade bond, or ‘junk’ bond. These bonds usually carry a higher risk of the issuer defaulting on their payments, so they are typically issued with a higher interest rate (coupon) to compensate for the additional risk.
Inflation: The rate at which prices of goods and services are rising in the economy.
Investment grade bond: A bond typically issued by governments or companies perceived to have a relatively low risk of defaulting on their payments, reflected in the higher rating given to them by credit ratings agencies.
IPO, or initial public offering: The term for the first time that a private company sells shares of its stock to the public on a stock exchange.
Issuance: The act of making bonds available to investors by the borrowing (issuing) company, typically through a sale of bonds to the public or financial institutions.
Jumbo issue: A large bond issue, typically above US$1 billion in size.
Leveraged finance: Sub-investment grade debt, such as high yield bonds and leveraged loans.
Fundamentals: In the context of corporate debt, “fundamentals” refer to the essential financial health indicators and characteristics of a company that suggest its ability to meet debt obligations.
Securitization: The process in which certain types of assets are pooled so that they can be repackaged into interest-bearing securities. The interest and principal payments from the assets are passed through to the purchasers of the securities.
Share buyback: Where a company buys back their own shares from the market.
Technicals: The overall demand (appetite from investors) and supply (issuance of bonds and debt securities from borrowers) environment.
Treasuries/US Treasury securities: Debt obligations issued by the US government. Treasury bills and US government bonds are guaranteed by the full faith and credit of the US government. They are generally considered to be free of credit risk and typically carry lower yields than other securities.
Unit economics: Direct revenues and costs of a business measured on a per unit basis. It can relate to different variables but is often associated with customer lifetime value (the average amount of money earned per customer over the lifetime of the business relationship) divided by the customer acquisition cost.
Working capital: The money available in a business to fund daily operations and meet short-term obligations.
Yield: The level of income on a security over a set period, typically expressed as a percentage rate.
Queste sono le opinioni dell'autore al momento della pubblicazione e possono differire da quelle di altri individui/team di Janus Henderson Investors. I riferimenti a singoli titoli non costituiscono una raccomandazione all'acquisto, alla vendita o alla detenzione di un titolo, di una strategia d'investimento o di un settore di mercato e non devono essere considerati redditizi. Janus Henderson Investors, le sue affiliate o i suoi dipendenti possono avere un’esposizione nei titoli citati.
Le performance passate non sono indicative dei rendimenti futuri. Tutti i dati dei rendimenti includono sia il reddito che le plusvalenze o le eventuali perdite ma sono al lordo dei costi delle commissioni dovuti al momento dell'emissione.
Le informazioni contenute in questo articolo non devono essere intese come una guida all'investimento.
Non vi è alcuna garanzia che le tendenze passate continuino o che le previsioni si realizzino.
Comunicazione di Marketing.
Important information
Please read the following important information regarding funds related to this article.
- Gli emittenti di obbligazioni (o di strumenti del mercato monetario) potrebbero non essere più in grado di pagare gli interessi o rimborsare il capitale, ovvero potrebbero non intendere più farlo. In tal caso, o qualora il mercato ritenga che ciò sia possibile, il valore dell’obbligazione scenderebbe.
- L’aumento (o la diminuzione) dei tassi d’interesse può influire in modo diverso su titoli diversi. Nello specifico, i valori delle obbligazioni si riducono di norma con l'aumentare dei tassi d'interesse. Questo rischio risulta di norma più significativo quando la scadenza di un investimento obbligazionario è a più lungo termine.
- Pur offrendo tassi di interesse generalmente più elevati rispetto alle obbligazioni investment grade, le obbligazioni ad alto rendimento (non-investment grade) sono più speculative e più sensibili a variazioni sfavorevoli delle condizioni di mercato.
- Titoli garantiti da attività (ABS) e altre forme di investimenti cartolarizzati possono essere soggetti a maggiori rischi di credito/inadempienza, liquidità, tasso d’interesse e di rimborso anticipato e proroga rispetto ad altri investimenti come i titoli di Stato o le obbligazioni emesse da società; ciò può avere un impatto negativo sul rendimento realizzato dall’investimento nei titoli.
- Alcune obbligazioni (obbligazioni callable) consentono ai loro emittenti il diritto di rimborsare anticipatamente il capitale o di estendere la scadenza. Gli emittenti possono esercitare tali diritti laddove li ritengano vantaggiosi e, di conseguenza, il valore del Fondo può esserne influenzato.
- Un’esposizione elevata a un determinato paese o a una specifica regione geografica comporta un livello di rischio più elevato rispetto a un Fondo più ampiamente diversificato.
- I derivati possono essere utilizzati per aiutare a raggiungere l’obiettivo di investimento. Ciò potrebbe determinare una “leva” (livelli più elevati di debito), che potrebbe amplificare i risultati dell’investimento Le perdite o i guadagni potrebbero superare il costo del derivato. I derivati comportano rischi aggiuntivi, in particolare il rischio che la controparte del derivato non adempia ai suoi obblighi contrattuali.
- Se il Fondo, o una sua classe di azioni con copertura, intende attenuare le fluttuazioni del tasso di cambio tra una valuta e la valuta di base, la stessa strategia di copertura potrebbe generare un effetto positivo o negativo sul valore del Fondo, a causa delle differenze di tasso d’interesse a breve termine tra le due valute.
- I titoli potrebbero diventare difficili da valutare o da vendere nel momento e al prezzo desiderati, specialmente in condizioni di mercato estreme caratterizzate da una discesa dei prezzi delle attività, con conseguente incremento del rischio di perdite sull’investimento.
- Il Fondo può sostenere un livello di costi di operazione più elevato per effetto dell’investimento su mercati caratterizzati da una minore attività di contrattazione o meno sviluppati rispetto a un fondo che investa su mercati più attivi/sviluppati.
- Il prelievo dal capitale di tutte le spese correnti, o di una parte di esse, e di altri costi del Fondo può erodere il capitale o ridurre il suo potenziale di crescita.
- Oltre al reddito, questa classe di azioni può distribuire plusvalenze di capitale realizzate e non realizzate e il capitale inizialmente investito. Sono dedotti dal capitale anche commissioni, oneri e spese. Entrambi i fattori possono comportare l’erosione del capitale e un potenziale ridotto di crescita del medesimo. Si richiama l’attenzione degli investitori anche sul fatto che le distribuzioni di tale natura possono essere trattate (e quindi imponibili) come reddito, secondo la legislazione fiscale locale.
- Potrebbero verificarsi perdite qualora una controparte non intendesse più o non fosse più in grado di adempiere ai propri obblighi, o a causa di un errore o di un ritardo nei processi operativi o di una negligenza di un fornitore terzo.