Chart to Watch: Growth stocks fell in Q1 – but earnings didn’t
Portfolio Manager Jeremiah Buckley examines why growth stocks lagged value in the first quarter despite strong earnings prospects – and why this disconnect may offer long-term investors an attractive entry point into high-quality secular growth companies.
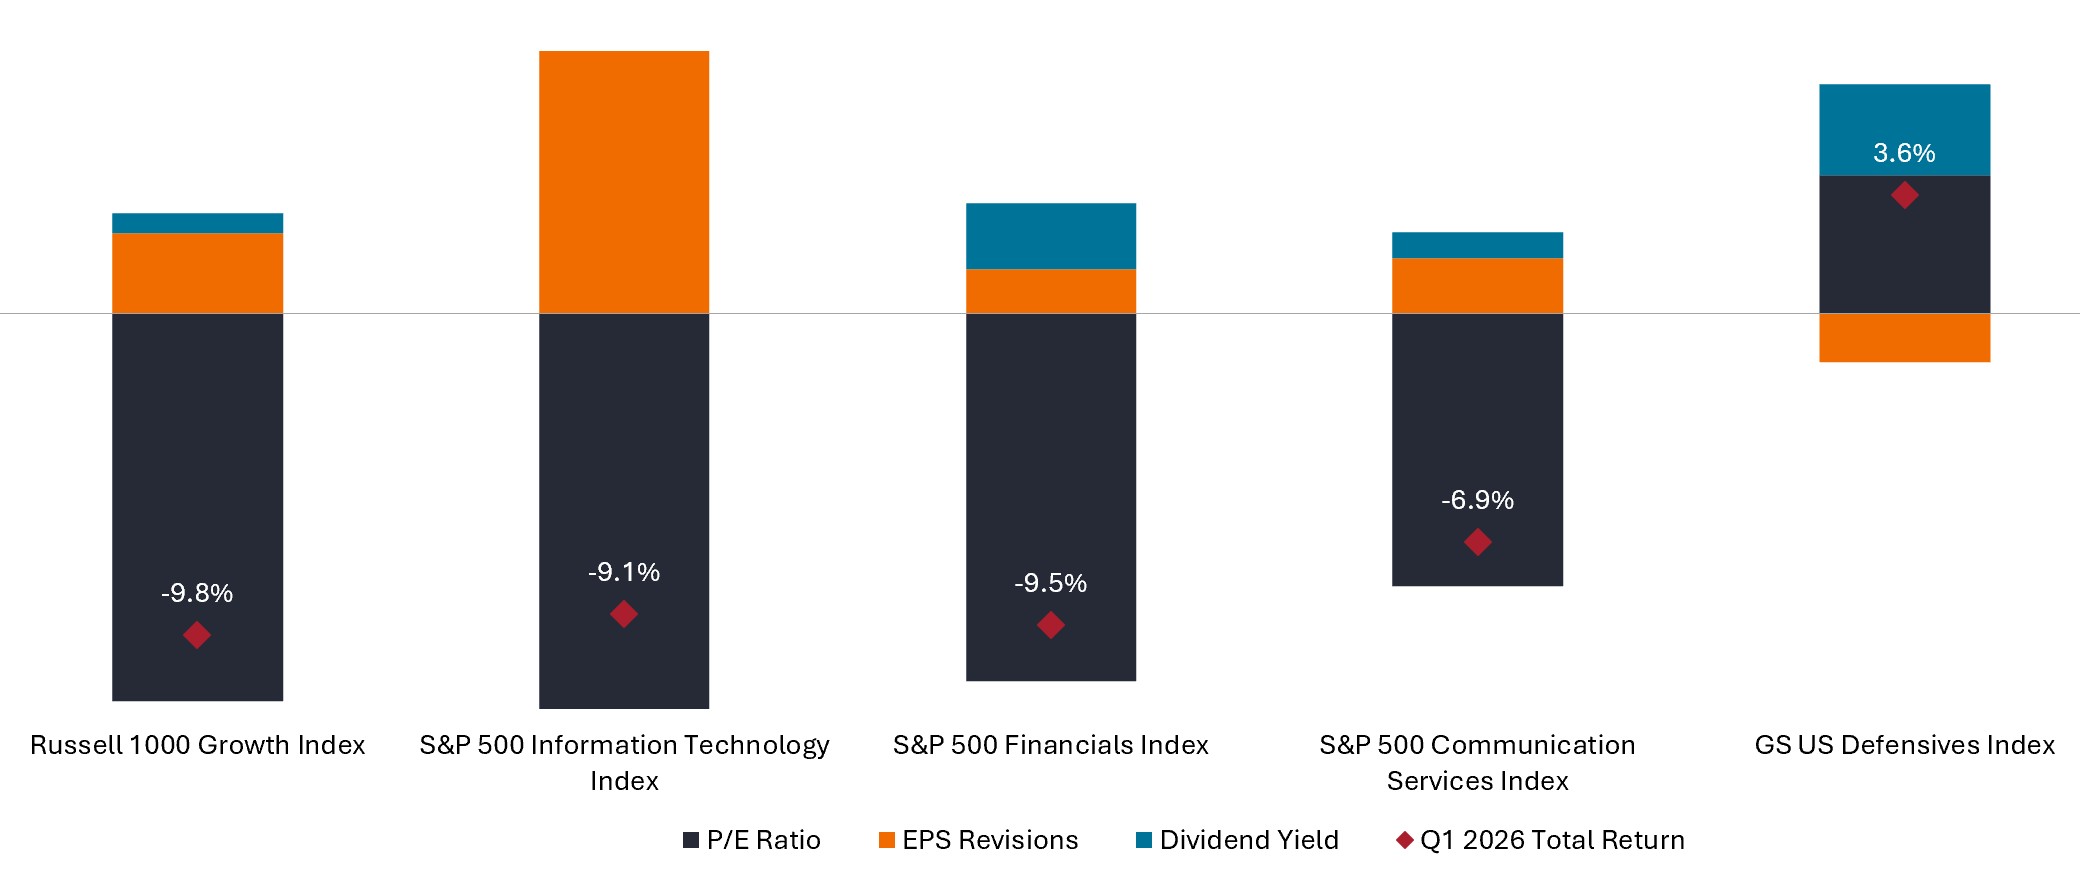
Source: Bloomberg, as of 31 March 2026. Cumulative total return from 1 January 2026 to 31 March 2026. There is no guarantee that past trends will continue, or forecasts will be realized. Note: Contribution categories provide approximation of total returns for given period; not drawn to scale. U.S. Price-to-Earnings (P/E) Ratio measures share price compared to earnings per share for a stock or stocks in a portfolio. Earnings per share (EPS): The portion of a company’s profit attributable to each share in the company. It is one of the most popular ways for investors to assess a company’s profitability. Past performance does not predict future returns.
We believe equities follow earnings in the long term, but in the first quarter, the market wasn’t reflecting that. Growth stocks have been sold off even as their earnings estimates are holding up and, in many cases, improving. But that kind of disconnect doesn't last forever. For patient, long-term investors, we think this looks like an opportunity. – Jeremiah Buckley
Key Takeaways
- Defensive and value stocks significantly outperformed growth stocks in the first quarter amid geopolitical uncertainty – even as growth sectors posted strong EPS revisions.
- We believe the performance divergence is overextended and was driven largely by sentiment and multiple contraction rather than the underlying earnings picture.
- We view the first-quarter rotation as an opportunity: Secular growth companies now trade at more attractive valuations, and we believe long-term secular trends are a far more powerful driver of returns than short-term macro swings.
Defensive and value sectors posted gains in the first quarter of 2026, materially outperforming the broader market as geopolitical uncertainty and the potential implications for employment and economic growth drove investors to perceived safe assets. Large-cap growth stocks – particularly technology, financial services, communication services – lagged despite maintaining superior earnings profiles.
One metric we monitor closely is the trajectory of earnings estimates. Year to date, defensive stocks (as represented by the GS US Defensives Index) have seen downward revisions, while growth sectors have seen material upward revisions. The notable exception has been the energy sector, where ongoing geopolitical conflict is likely to push estimates higher.
Yet the market’s response has been counterintuitive. The Russell 1000 Value Index, which carries more defensive exposure, has outperformed the Russell 1000 Growth Index by 11.8% year to date – a divergence driven largely by multiple contraction that we believe is overextended. Large-cap growth continues to lead value on both earnings growth and operating margins.1
We view the first quarter’s indiscriminate rotation as excessive. Growth sectors with rising estimates were penalized while defensives with falling estimates were rewarded. That disconnect creates an attractive entry point into secular growth companies, where we believe long-term trends – not short-term macro noise – will ultimately drive returns.
1 10-year EPS CAGR: U.S. large cap growth 10.3% vs U.S. large cap value 5.6%. Operating margin average: U.S. large cap growth 15.9% vs U.S. large cap value 11.2%. Source: Bloomberg as of March 31, 2026.
GS US Defensives Index consists of S&P 500 equities with a beta to US Gross Domestic Product (GDP) growth (via the GS US MAP score of economic data surprises) lower than the S&P 500’s beta excluding commodity input cost and other equities impacted by macro environment.
Russell 1000® Growth Index reflects the performance of U.S. large-cap equities with higher price-to-book ratios and higher forecasted growth values.
Russell 1000® Value Index reflects the performance of U.S. large-cap equities with lower price-to-book ratios and lower expected growth values.
IMPORTANT INFORMATION
Growth stocks are subject to increased risk of loss and price volatility and may not realize their perceived growth potential.
Value stocks can continue to be undervalued by the market for long periods of time and may not appreciate to the extent expected.
Equity securities are subject to risks including market risk. Returns will fluctuate in response to issuer, political and economic developments.
Queste sono le opinioni dell'autore al momento della pubblicazione e possono differire da quelle di altri individui/team di Janus Henderson Investors. I riferimenti a singoli titoli non costituiscono una raccomandazione all'acquisto, alla vendita o alla detenzione di un titolo, di una strategia d'investimento o di un settore di mercato e non devono essere considerati redditizi. Janus Henderson Investors, le sue affiliate o i suoi dipendenti possono avere un’esposizione nei titoli citati.
Le performance passate non sono indicative dei rendimenti futuri. Tutti i dati dei rendimenti includono sia il reddito che le plusvalenze o le eventuali perdite ma sono al lordo dei costi delle commissioni dovuti al momento dell'emissione.
Le informazioni contenute in questo articolo non devono essere intese come una guida all'investimento.
Non vi è alcuna garanzia che le tendenze passate continuino o che le previsioni si realizzino.
Comunicazione di Marketing.
Important information
Please read the following important information regarding funds related to this article.
- Le Azioni/Quote possono perdere valore rapidamente e di norma implicano rischi più elevati rispetto alle obbligazioni o agli strumenti del mercato monetario. Di conseguenza il valore del proprio investimento potrebbe diminuire.
- Gli emittenti di obbligazioni (o di strumenti del mercato monetario) potrebbero non essere più in grado di pagare gli interessi o rimborsare il capitale, ovvero potrebbero non intendere più farlo. In tal caso, o qualora il mercato ritenga che ciò sia possibile, il valore dell'obbligazione scenderebbe.
- L’aumento (o la diminuzione) dei tassi d’interesse può influire in modo diverso su titoli diversi. Nello specifico, i valori delle obbligazioni si riducono di norma con l'aumentare dei tassi d'interesse. Questo rischio risulta di norma più significativo quando la scadenza di un investimento obbligazionario è a più lungo termine.
- Il Fondo investe in obbligazioni ad alto rendimento (non investment grade) che, sebbene offrano di norma un interesse superiore a quelle investment grade, sono più speculative e più sensibili a variazioni sfavorevoli delle condizioni di mercato.
- Un Fondo che presenta un’esposizione elevata a un determinato paese o regione geografica comporta un livello maggiore di rischio rispetto a un Fondo più diversificato.
- Il Fondo potrebbe usare derivati al fine di conseguire il suo obiettivo d'investimento. Ciò potrebbe determinare una "leva", che potrebbe amplificare i risultati dell'investimento, e le perdite o i guadagni per il Fondo potrebbero superare il costo del derivato. I derivati comportano rischi aggiuntivi, in particolare il rischio che la controparte del derivato non adempia ai suoi obblighi contrattuali.
- Se il Fondo, o una sua classe di azioni con copertura, intende attenuare le fluttuazioni del tasso di cambio tra una valuta e la valuta di base, la stessa strategia di copertura potrebbe generare un effetto positivo o negativo sul valore del Fondo, a causa delle differenze di tasso d’interesse a breve termine tra le due valute.
- I titoli del Fondo potrebbero diventare difficili da valutare o da vendere al prezzo e con le tempistiche desiderati, specie in condizioni di mercato estreme con il prezzo delle attività in calo, aumentando il rischio di perdite sull'investimento.
- Le spese correnti possono essere prelevate, in tutto o in parte, dal capitale, il che potrebbe erodere il capitale o ridurne il potenziale di crescita.
- Il Fondo potrebbe perdere denaro se una controparte con la quale il Fondo effettua scambi non fosse più intenzionata ad adempiere ai propri obblighi, o a causa di un errore o di un ritardo nei processi operativi o di una negligenza di un fornitore terzo.
- Oltre al reddito, questa classe di azioni può distribuire plusvalenze di capitale realizzate e non realizzate e il capitale inizialmente investito. Sono dedotti dal capitale anche commissioni, oneri e spese. Entrambi i fattori possono comportare l’erosione del capitale e un potenziale ridotto di crescita del medesimo. Si richiama l’attenzione degli investitori anche sul fatto che le distribuzioni di tale natura possono essere trattate (e quindi imponibili) come reddito, secondo la legislazione fiscale locale.