
Key takeaways:
- The unprecedented artificial intelligence (AI) buildout is increasingly financed through investment grade credit, meaning passive bond investors risk accumulating greater exposure to the same AI theme dominating equity markets.
- The level of hyperscaler borrowing is increasing concentration risk, potentially undermining the diversification investors traditionally expect from their fixed income allocation.
- Active credit selection can counter index concentration by limiting exposure to hyperscalers while targeting issuers engaged in deleveraging and improving their credit quality, potentially enhancing diversification and alpha.
The world is suffering from a major concentration problem. Only we are not talking about the effects of too much screen time… we are talking about markets. The S&P 500 Index carries concentration of artificial intelligence (AI) exposure at 40%.1 That rivals peak concentration levels of the Tech, Media, Telecoms (TMT) sector in 1999 and the Nifty Fifty in the 1970s. Fixed income is supposed to offer your portfolio diversification and ballast. With yields at the upper end of where they have been the past two decades, it is poised to do exactly that. But the indices that underly fixed income have a fatal flaw in this goal. They inherently weight the most indebted companies the highest rather than the most creditworthy companies.
Out of this world
The capital expenditure on the artificial intelligence (AI) buildout could dwarf anything in modern history. Predictions are the capital spending could average around 3.6% of gross domestic product annually over the buildout period between now and 2032 (see Exhibit 1). This is an unparalleled level that would leave even the railroads boom of the late 1800s in its wake.
Exhibit 1: The biggest buildout in U.S. history
Size of capital spending as a % of GDP
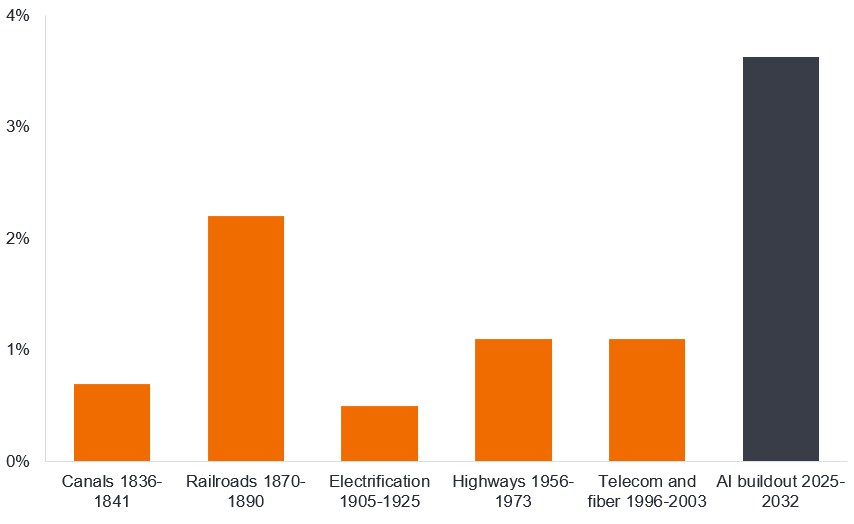
Source: Stijn Van Nieuwerburgh, Columbia Business School, Brookings Papers on Economic Activity, September 2026. Size is average annual capital expenditure as a percentage of GDP over the indicated period. AI buildout includes projected spending. There is no guarantee that past trends will continue, or forecasts will be realised.
The investment grade market is the epicenter of the AI capex buildout financing. The massive depth of this capital has allowed the hyperscalers to fund mega deals in a matter of hours to the tune of tens of billons of dollars. Hyperscaler capex is expected to balloon to more than US$1.1 trillion in 2027 and continue to grow from there (see Exhibit 2). The primary funding source is the credit market, meaning the ongoing capex spend will flood the investment grade market for years.
Exhibit 2: This is only the beginning
Hyperscaler capital expenditure (US$bn)
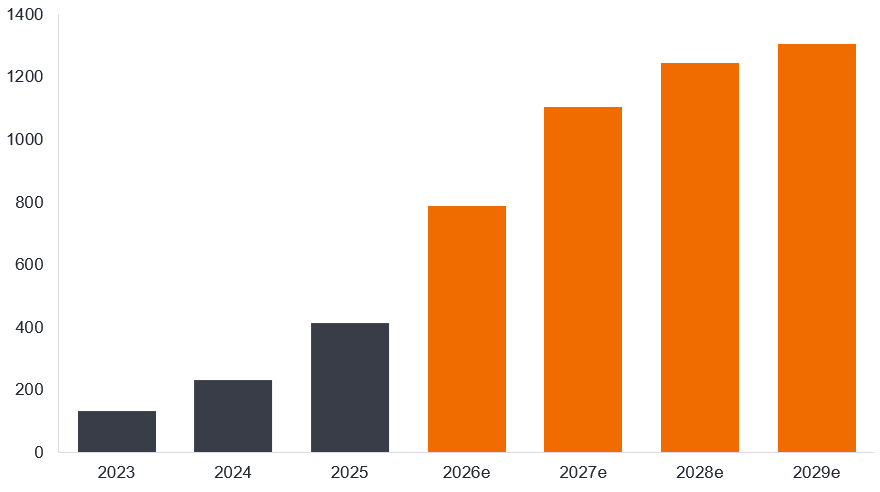
Source: Bloomberg, Bloomberg Intelligence, as of 19 August 2026. Figures from 2026 onwards are estimated. Hyperscalers represented here are Amazon, Google, Microsoft, Meta, Oracle. There is no guarantee that past trends will continue, or forecasts will be realised.
More of the same
Within the equity markets, the AI Big 10 (Magnificent 7 + Micron, AMD and Broadcom) already represent 40% of the S&P 500 Index.1 This level of equity index concentration has significance. Bank of America noted that equity market concentration typically peaked around this level during equity market bubbles. For example, TMT reached 41% of the S&P 500 Index at its peak in 2000, Japan reached 44% of the MSCI All Countries World Index at its peak in 1989, and the Nifty Fifty stocks reached 40% of the S&P 500 in 1972.2 With the technology sector expected to represent 79% of the growth in S&P 500 earnings in 2027 this might provide some explanation for the concentrated index weight.3 Yet the starkness of this figure underscores the vulnerability of the U.S equity market to any disappointment from AI-related companies.
Credit indices are not immune to this concentration problem. All that newly created debt rolls into the index. The concentration of hyperscalers and AI-related exposure will continue to grow in credit indices. Just at a time when you might want diversification from a concentrated equity market the fixed income index is bringing you ever more AI exposure. The technology sector already sits at around 10% of investment grade indices exposure today – and is higher still once you include the hyperscalers that sit outside the tech classification.
Exhibit 3: Selected AI-related exposure (% weight in index)
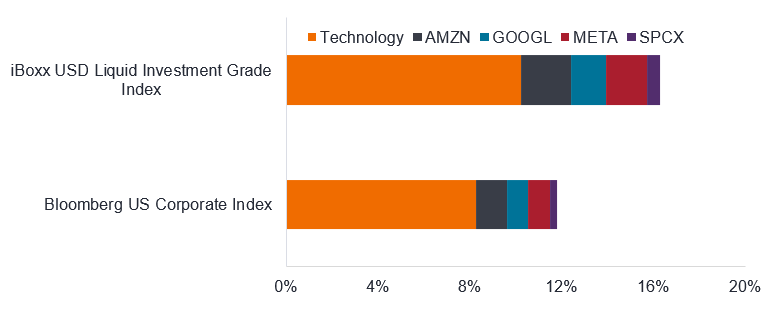
Source: Janus Henderson calculations, Bloomberg, iBoxx USD Liquid Investment Grade Index, Bloomberg US Corporate Index, Bloomberg sector classifications, Amazon comes under consumer discretionary, Alphabet (Google), Meta and SpaceX under communications, weights at 29 October 2026. Weights may vary over time. References made to individual securities do not constitute a recommendation to buy, sell or hold any security, investment strategy or market sector, and should not be assumed to be profitable. Janus Henderson Investors, its affiliated advisor, or its employees, may have a position in the securities mentioned.
Issuance will continue to move higher from these cohorts. As such, we expect the technology sector (including hyperscalers) to go from around a mid-teen weighting in the iBoxx index above to potentially around 20%+ by 2028.4
Due to the long duration tenors among hyperscaler issuance, this is likely to push up index risk as measured by duration times spread (DTS), something we are already seeing. Hyperscaler DTS already rivals that of the Big 6 U.S. banks within U.S corporate credit (see Exhibit 4).
Exhibit 4: Hyperscalers have surpassed the Big 6 banks in terms of DTS
Percent of index distribution times spread (DTS) represented by sector
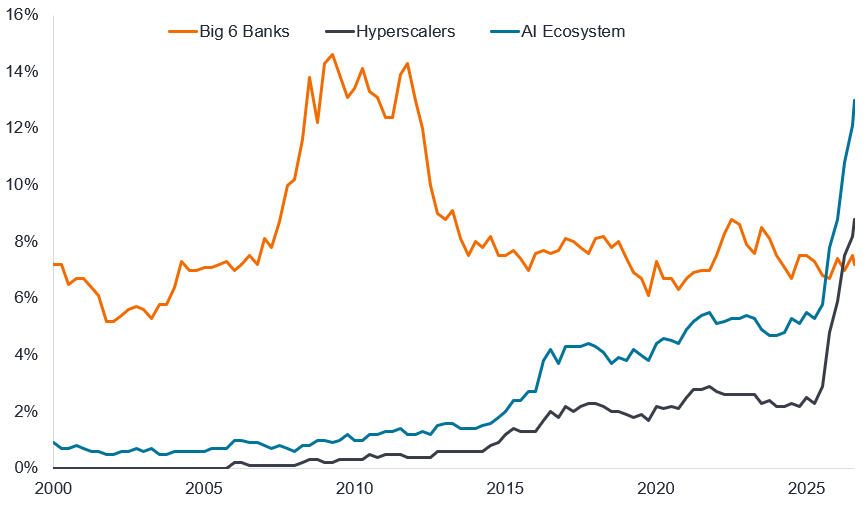
Source: Barclays, 23 October 2026. Data uses the Bloomberg US Corporate Bond Index (LUAC+144a). This index tracks both publicly registered US dollar-denominated investment grade, fixed rate, taxable corporate bonds, and privately placed debt issued under SEC rule 144a (a legal safe harbor that allows institutional investors to trade privately placed, unregistered corporate bonds with one another).
Understanding Duration Times Spread (DTS)
Duration times spread is a method for measuring the credit volatility of a corporate bond. It is calculated by multiplying two bond characteristics: the spread duration and the credit spread of a bond or portfolio. Its usefulness is that credit spreads tend to change relatively and not absolutely, allowing portfolio managers to better understand the relative risk of positions. For example, a bond with one year duration and a spread of 500 basis points (bps) has the same expected volatility (1 x 500 = 500) as a bond with five-year duration and a spread of 100 basis points (5 x 100 = 500). For a portfolio, the DTS is calculated as the market value weighted average of the individual securities’ DTS. The higher the DTS of a bond or portfolio the more its returns would be expected to decline when credit spreads widen and vice versa.
Managing concentration risk
The rapid growth of hyperscaler debt is introducing a new concentration risk into the investment grade universe. Barclays notes that a year ago AI ecosystem spreads were below the IG average by around 10 basis points (bps), but now trade wide by around 35bps, with hyperscalers having led the deterioration.5 Simply tracking an index exposes investors to this growing concentration risk.
That does not mean going to the other extreme and adopting a zero weighting to hyperscalers. In our view, episodes like the recent sell-off can create tactical opportunities, but it does mean recognising that as a grouping this area of the market is aggravating risk at a time when equities are facing similar challenges. Outside of the hyperscalers, there are ample opportunities in corporate credit to invest in companies focused on improving their balance sheets, engaging in deleveraging and increasing their credit ratings. An active management approach, with skilled credit selectors, offers the potential to navigate this evolving market by selecting attractive credits that reduce these concentration risks while driving alpha and achieving the diversification an investor expects from a bond allocation.
1Source: Janus Henderson, Bloomberg, S&P 500 Index, 28 October 2026.
2Source: BofA Global Research, GFD Finaeon, Bloomberg, 22 October 2026.
3Source: LSEG Lipper, I/B/E/S earnings estimates for S&P 500 Index, 28 October 2026. There is no guarantee that past trends will continue, or forecasts will be realised.
4Source: Janus Henderson Investors calculations and forecast, 30 October 2026. There is no guarantee that past trends will continue, or forecasts will be realised.
5Source: Barclays, US Credit Alpha, 23 October 2026.
Active managed portfoliosmay fail to produce the intended results. No investment strategy can ensure a profit or eliminate the risk of loss.
Fixed income securities are subject to interest rate, inflation, credit and default risk. The bond market is volatile. As interest rates rise, bond prices usually fall, and vice versa. The return of principal is not guaranteed, and prices may decline if an issuer fails to make timely payments or its credit strength weakens.
iBoxx USD Liquid Investment Grade Index: This measures the USD denominated, investment grade, corporate bond market.
S&P 500 Index: An investment management approach where a fund manager actively aims to outperform or beat a specific index or benchmark through research, analysis, and the investment choices they make.
Bloomberg US Corporate Index: An index that tracks the 500 largest publicly traded companies listed on stock exchanges in the U.S.
Active investing: This measures the investment grade, fixed rate, taxable corporate bond market. It includes USD denominated securities publicly issued by U.S. and non-U.S. industrial, utility and financial issuers.
Alpha: Alpha is the difference between a portfolio’s return and its benchmark index after adjusting for the level of risk taken.
Capital expenditure: Money invested to acquire or upgrade fixed assets such as buildings, machinery, equipment, or vehicles in order to maintain or improve operations and foster future growth.
Concentration risk: Refers to the danger an organisation faces when it relies too heavily on a limited number of sources or entities for key aspects of its business.
Credit spread: The difference in yield between securities with similar maturity but different credit quality, often used to describe the difference in yield between corporate bonds and government bonds. Widening spreads generally indicate deteriorating creditworthiness of corporate borrowers, while narrowing spreads indicate improving creditworthiness.
Duration: Duration can measure how long it takes, in years, for an investor to be repaid a bond’s price by the bond’s total cash flows. Duration can also measure the sensitivity of a bond’s or fixed-income portfolio’s price to changes in interest rates.
Duration times spread (DTS): A figure used to compare credit risk across a range of bonds. It is calculated by multiplying the spread duration on a bond and its credit spread.
Exposure: The amount invested in an asset or market, and which could potentially be lost should an investment fail. It is another way of describing financial risk.
Gross domestic product (GDP): The value of all finished goods and services produced by a country within a specific time period, usually quarterly or annually. GDP is a broad measure of the size and health of a country’s economy.
Hyperscaler: A very large technology company that operates extensive cloud-computing and data-centre infrastructure at scale.
Index: A statistical measure of a group or basket of securities or other financial instruments. Each index has its own calculation method, usually expressed as a change from a base value.
Investment grade: A bond typically issued by governments or companies perceived to have a relatively low risk of defaulting on their payments, which is reflected in the higher rating given by credit ratings agencies.
Passive investing: An investment approach that involves tracking a particular market or index. It is called passive because it seeks to mirror an index, either fully or partially replicating it, rather than actively picking or choosing securities to hold.
Portfolio: A grouping of financial assets such as equities, bonds, commodities, properties, or cash. Also often called a fund.
Security: A broad term that refers to shares, bonds, or any other financial instrument.
Volatility: The rate and extent at which the price of a portfolio, security or index moves up and down. If the price swings up and down with large movements, it has high volatility. If the price moves more slowly and to a lesser extent, it has lower volatility.
Yield: The level of income on a security over a set period, typically expressed as a percentage rate. For a bond, in its simplest form, this is calculated as the coupon payment divided by the current bond price.
Queste sono le opinioni dell'autore al momento della pubblicazione e possono differire da quelle di altri individui/team di Janus Henderson Investors. I riferimenti a singoli titoli non costituiscono una raccomandazione all'acquisto, alla vendita o alla detenzione di un titolo, di una strategia d'investimento o di un settore di mercato e non devono essere considerati redditizi. Janus Henderson Investors, le sue affiliate o i suoi dipendenti possono avere un’esposizione nei titoli citati.
Le performance passate non sono indicative dei rendimenti futuri. Tutti i dati dei rendimenti includono sia il reddito che le plusvalenze o le eventuali perdite ma sono al lordo dei costi delle commissioni dovuti al momento dell'emissione.
Le informazioni contenute in questo articolo non devono essere intese come una guida all'investimento.
Non vi è alcuna garanzia che le tendenze passate continuino o che le previsioni si realizzino.
Comunicazione di Marketing.
Important information
Please read the following important information regarding funds related to this article.
- Gli emittenti di obbligazioni (o di strumenti del mercato monetario) potrebbero non essere più in grado di pagare gli interessi o rimborsare il capitale, ovvero potrebbero non intendere più farlo. In tal caso, o qualora il mercato ritenga che ciò sia possibile, il valore dell’obbligazione scenderebbe.
- L’aumento (o la diminuzione) dei tassi d’interesse può influire in modo diverso su titoli diversi. Nello specifico, i valori delle obbligazioni si riducono di norma con l'aumentare dei tassi d'interesse. Questo rischio risulta di norma più significativo quando la scadenza di un investimento obbligazionario è a più lungo termine.
- Pur offrendo tassi di interesse generalmente più elevati rispetto alle obbligazioni investment grade, le obbligazioni ad alto rendimento (non-investment grade) sono più speculative e più sensibili a variazioni sfavorevoli delle condizioni di mercato.
- Titoli garantiti da attività (ABS) e altre forme di investimenti cartolarizzati possono essere soggetti a maggiori rischi di credito/inadempienza, liquidità, tasso d’interesse e di rimborso anticipato e proroga rispetto ad altri investimenti come i titoli di Stato o le obbligazioni emesse da società; ciò può avere un impatto negativo sul rendimento realizzato dall’investimento nei titoli.
- Alcune obbligazioni (obbligazioni callable) consentono ai loro emittenti il diritto di rimborsare anticipatamente il capitale o di estendere la scadenza. Gli emittenti possono esercitare tali diritti laddove li ritengano vantaggiosi e, di conseguenza, il valore del Fondo può esserne influenzato.
- Un’esposizione elevata a un determinato paese o a una specifica regione geografica comporta un livello di rischio più elevato rispetto a un Fondo più ampiamente diversificato.
- I derivati possono essere utilizzati per aiutare a raggiungere l’obiettivo di investimento. Ciò potrebbe determinare una “leva” (livelli più elevati di debito), che potrebbe amplificare i risultati dell’investimento Le perdite o i guadagni potrebbero superare il costo del derivato. I derivati comportano rischi aggiuntivi, in particolare il rischio che la controparte del derivato non adempia ai suoi obblighi contrattuali.
- Se il Fondo, o una sua classe di azioni con copertura, intende attenuare le fluttuazioni del tasso di cambio tra una valuta e la valuta di base, la stessa strategia di copertura potrebbe generare un effetto positivo o negativo sul valore del Fondo, a causa delle differenze di tasso d’interesse a breve termine tra le due valute.
- I titoli potrebbero diventare difficili da valutare o da vendere nel momento e al prezzo desiderati, specialmente in condizioni di mercato estreme caratterizzate da una discesa dei prezzi delle attività, con conseguente incremento del rischio di perdite sull’investimento.
- Il Fondo può sostenere un livello di costi di operazione più elevato per effetto dell’investimento su mercati caratterizzati da una minore attività di contrattazione o meno sviluppati rispetto a un fondo che investa su mercati più attivi/sviluppati.
- Il prelievo dal capitale di tutte le spese correnti, o di una parte di esse, e di altri costi del Fondo può erodere il capitale o ridurre il suo potenziale di crescita.
- Oltre al reddito, questa classe di azioni può distribuire plusvalenze di capitale realizzate e non realizzate e il capitale inizialmente investito. Sono dedotti dal capitale anche commissioni, oneri e spese. Entrambi i fattori possono comportare l’erosione del capitale e un potenziale ridotto di crescita del medesimo. Si richiama l’attenzione degli investitori anche sul fatto che le distribuzioni di tale natura possono essere trattate (e quindi imponibili) come reddito, secondo la legislazione fiscale locale.
- Potrebbero verificarsi perdite qualora una controparte non intendesse più o non fosse più in grado di adempiere ai propri obblighi, o a causa di un errore o di un ritardo nei processi operativi o di una negligenza di un fornitore terzo.
Specific risks
- Gli emittenti di obbligazioni (o di strumenti del mercato monetario) potrebbero non essere più in grado di pagare gli interessi o rimborsare il capitale, ovvero potrebbero non intendere più farlo. In tal caso, o qualora il mercato ritenga che ciò sia possibile, il valore dell’obbligazione scenderebbe.
- L’aumento (o la diminuzione) dei tassi d’interesse può influire in modo diverso su titoli diversi. Nello specifico, i valori delle obbligazioni si riducono di norma con l'aumentare dei tassi d'interesse. Questo rischio risulta di norma più significativo quando la scadenza di un investimento obbligazionario è a più lungo termine.
- I CoCo (Obbligazioni contingent convertible) possono subire brusche riduzioni di valore in caso d’indebolimento della solidità finanziaria di un emittente e qualora un evento trigger prefissato comporti la conversione delle obbligazioni in azioni dell’emittente o il loro storno parziale o totale.
- Qualora il Fondo detenga attività in valute diverse da quella di base del Fondo, o l’investitore detenga azioni/quote di una valuta diversa da quella del Fondo (a meno che non sia coperta, ovvero cerchi di mitigare i movimenti del tasso di cambio tra la valuta della classe di azioni/quote e la valuta di base del Fondo), il valore dell’investimento potrebbe subire le oscillazioni del tasso di cambio.
- I derivati possono essere utilizzati per aiutare a raggiungere l’obiettivo di investimento. Ciò potrebbe determinare una “leva” (livelli più elevati di debito), che potrebbe amplificare i risultati dell’investimento Le perdite o i guadagni potrebbero superare il costo del derivato. I derivati comportano rischi aggiuntivi, in particolare il rischio che la controparte del derivato non adempia ai suoi obblighi contrattuali.
- Se il Fondo, o una sua classe di azioni con copertura, intende attenuare le fluttuazioni del tasso di cambio tra una valuta e la valuta di base, la stessa strategia di copertura potrebbe generare un effetto positivo o negativo sul valore del Fondo, a causa delle differenze di tasso d’interesse a breve termine tra le due valute.
- I titoli potrebbero diventare difficili da valutare o da vendere nel momento e al prezzo desiderati, specialmente in condizioni di mercato estreme caratterizzate da una discesa dei prezzi delle attività, con conseguente incremento del rischio di perdite sull’investimento.
- Il prelievo dal capitale di tutte le spese correnti, o di una parte di esse, e di altri costi del Fondo può erodere il capitale o ridurre il suo potenziale di crescita.
- Potrebbero verificarsi perdite qualora una controparte non intendesse più o non fosse più in grado di adempiere ai propri obblighi, o a causa di un errore o di un ritardo nei processi operativi o di una negligenza di un fornitore terzo.