
Key takeaways:
- The current small-cap cycle is being driven by broad, real earnings growth, not just a valuation rebound.
- We believe this earnings-driven, inflation-linked backdrop makes the rally structurally different from prior periods and not reliant on falling interest rates.
- We think investors that are underweight small caps have room to revisit that positioning, since valuations remain historically cheap and these cycles can persist for years.
In 2025, small-cap stocks ended large caps’ decade-plus run of dominant performance, and the shift has carried over into 2026. Since the market lows following Liberation Day in early April 2025, the Russell 2000 Index has outperformed the S&P 500® Index by roughly 14%, and it remains ahead by about 7% year to date.1
The move has drawn less attention than it might have, given how much focus has gone to artificial intelligence (AI) and the mega-cap companies driving the capital spending cycle. Nonetheless, after roughly 14 years in large caps’ shadow, small caps have quietly turned a corner.
An extreme valuation disconnect helped create the conditions for the reversal, and since then the fundamental backdrop has continued to build. In our view, the combination of an attractive valuation starting point, improving earnings, and a supportive economic backdrop suggests this cycle may have staying power.
Discounted entry points still available
Despite the rally, we do not believe investors have missed the opportunity. Small caps had become exceptionally inexpensive relative to large cap over a roughly four-year period leading up to April 2025, trading among the cheapest 5% of relative valuation observations in decades of data. That gap has narrowed, but it hasn’t closed. On a forward price-to-earnings basis, the relative valuation still sits at a historically appealing level (Exhibit 1).
Exhibit 1: Small cap premium/discount to large cap based on forward P/E
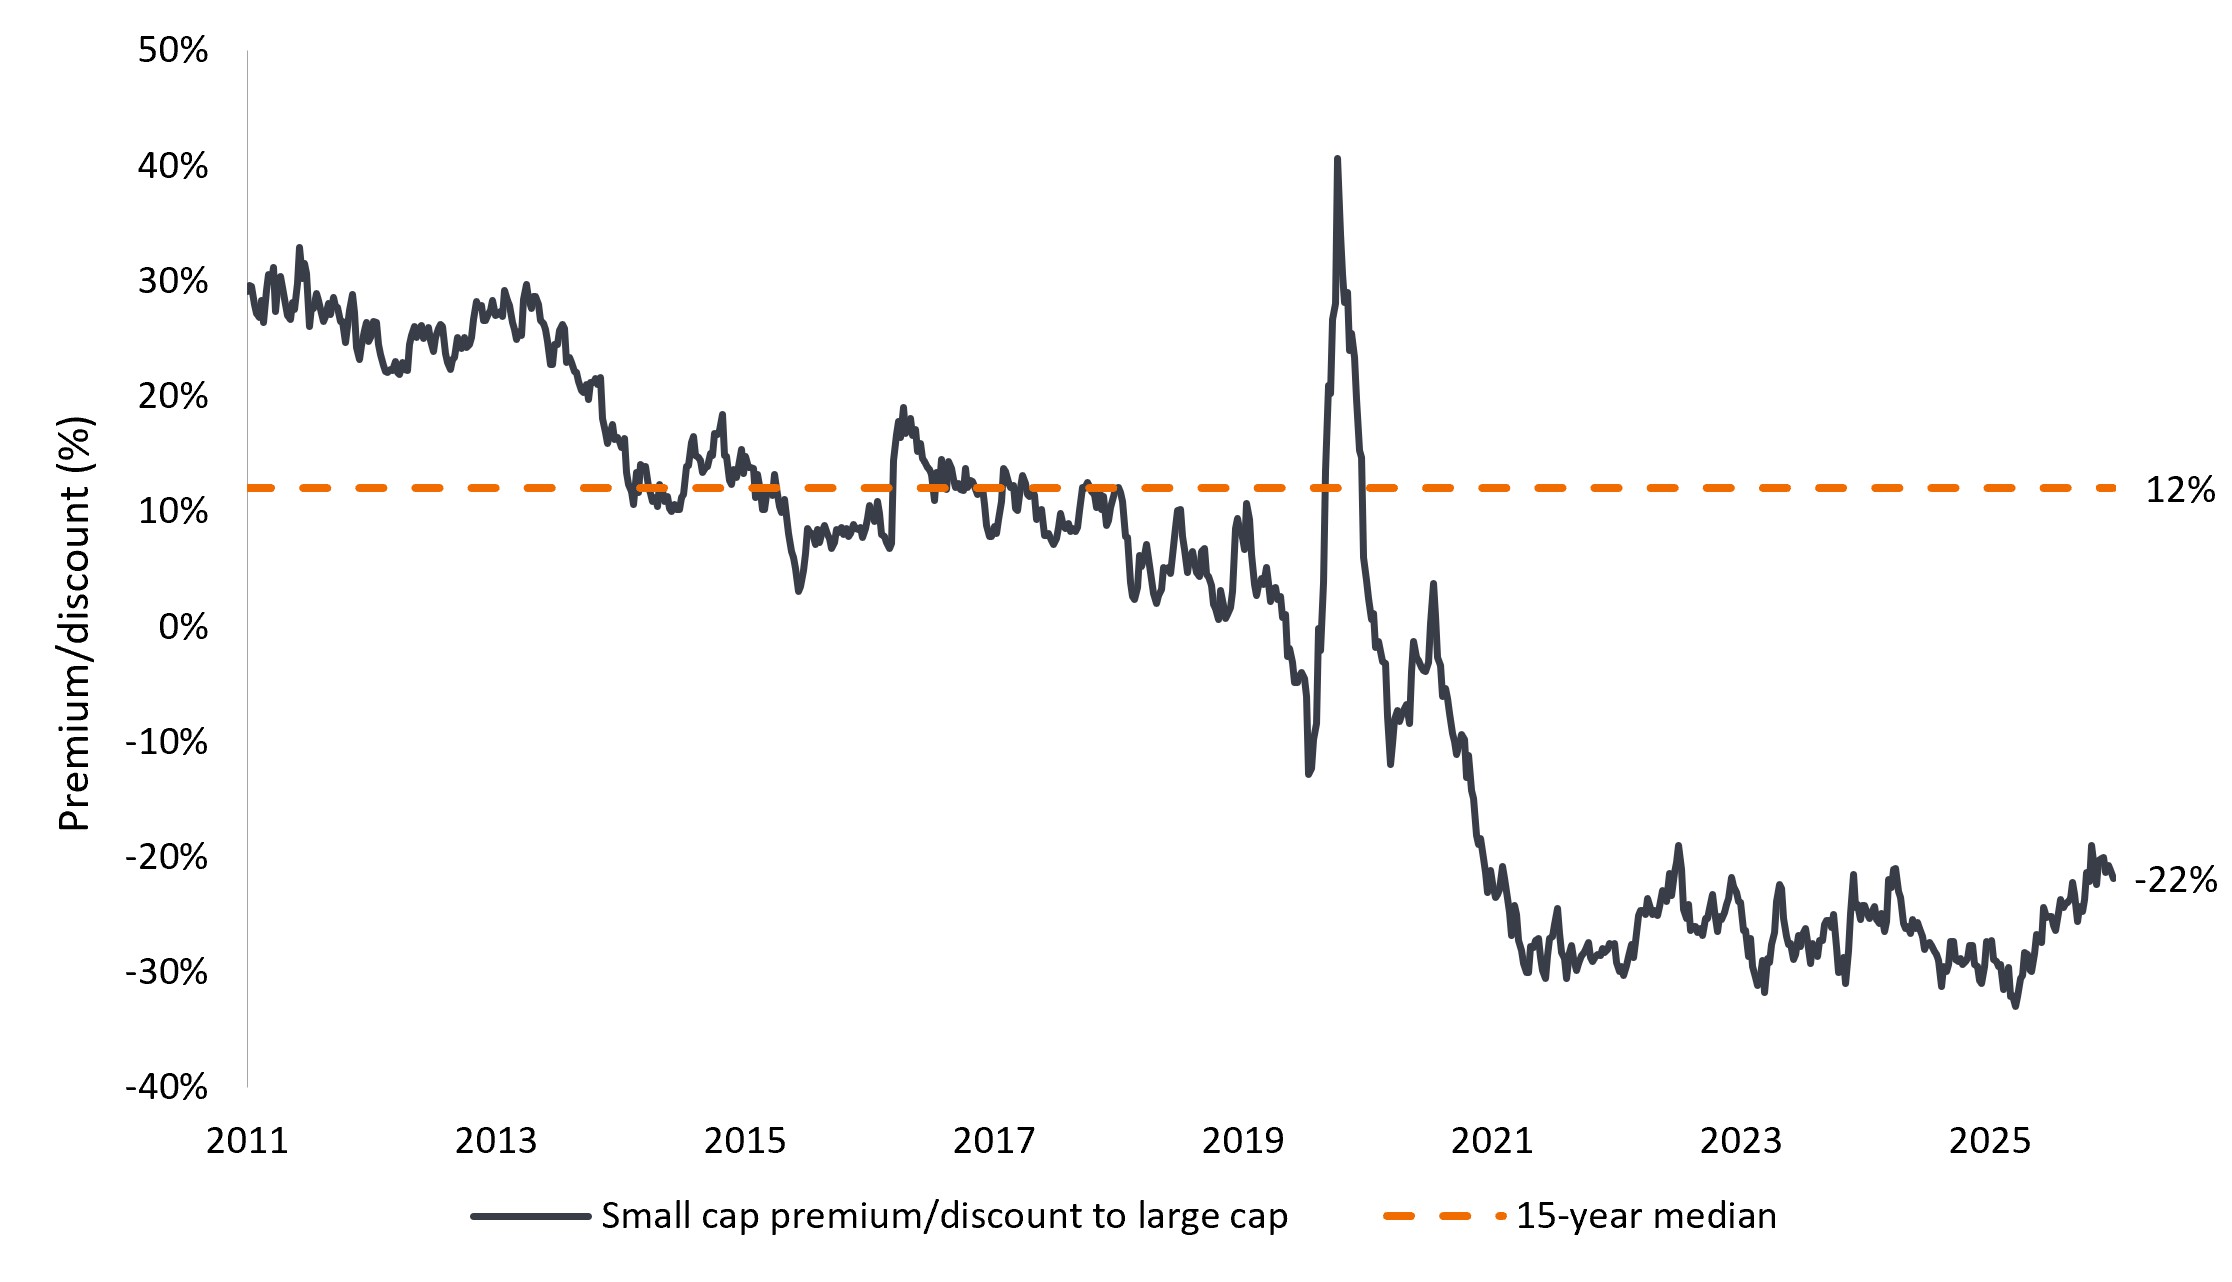
Source: Bloomberg; data reflect forward 12-month price-to-earnings (P/E) ratios. Data are weekly from 2 September 2011 to 2 September 2026. Large cap = S&P 500 Index, small cap = S&P 600 Index.
Earnings catch up
Valuation alone rarely sustains a multiyear cycle. What has changed is earnings: Second-quarter 2026 earnings per share for the Russell 2000 grew roughly 43%, well ahead of expectations near 26%, and about two-thirds of companies beat on both revenue and earnings estimates. Trailing 12-month earnings for the index also reached a new high.2
The S&P 500 also posted one of its best cap-weighted earnings seasons on record, but that strength was concentrated at the top: The median company in the index grew earnings at only about a quarter (13.8%) of the cap-weighted index pace (53%).3
Small-cap strength, by contrast, has been broad. Financials have benefited from a steeper yield curve, industrials from AI-related infrastructure spending and a manufacturing recovery, semiconductors from that same buildout, and healthcare from robust demand growth.
Exhibit 2: Small cap vs. large cap 2Q 2026 YoY earnings growth
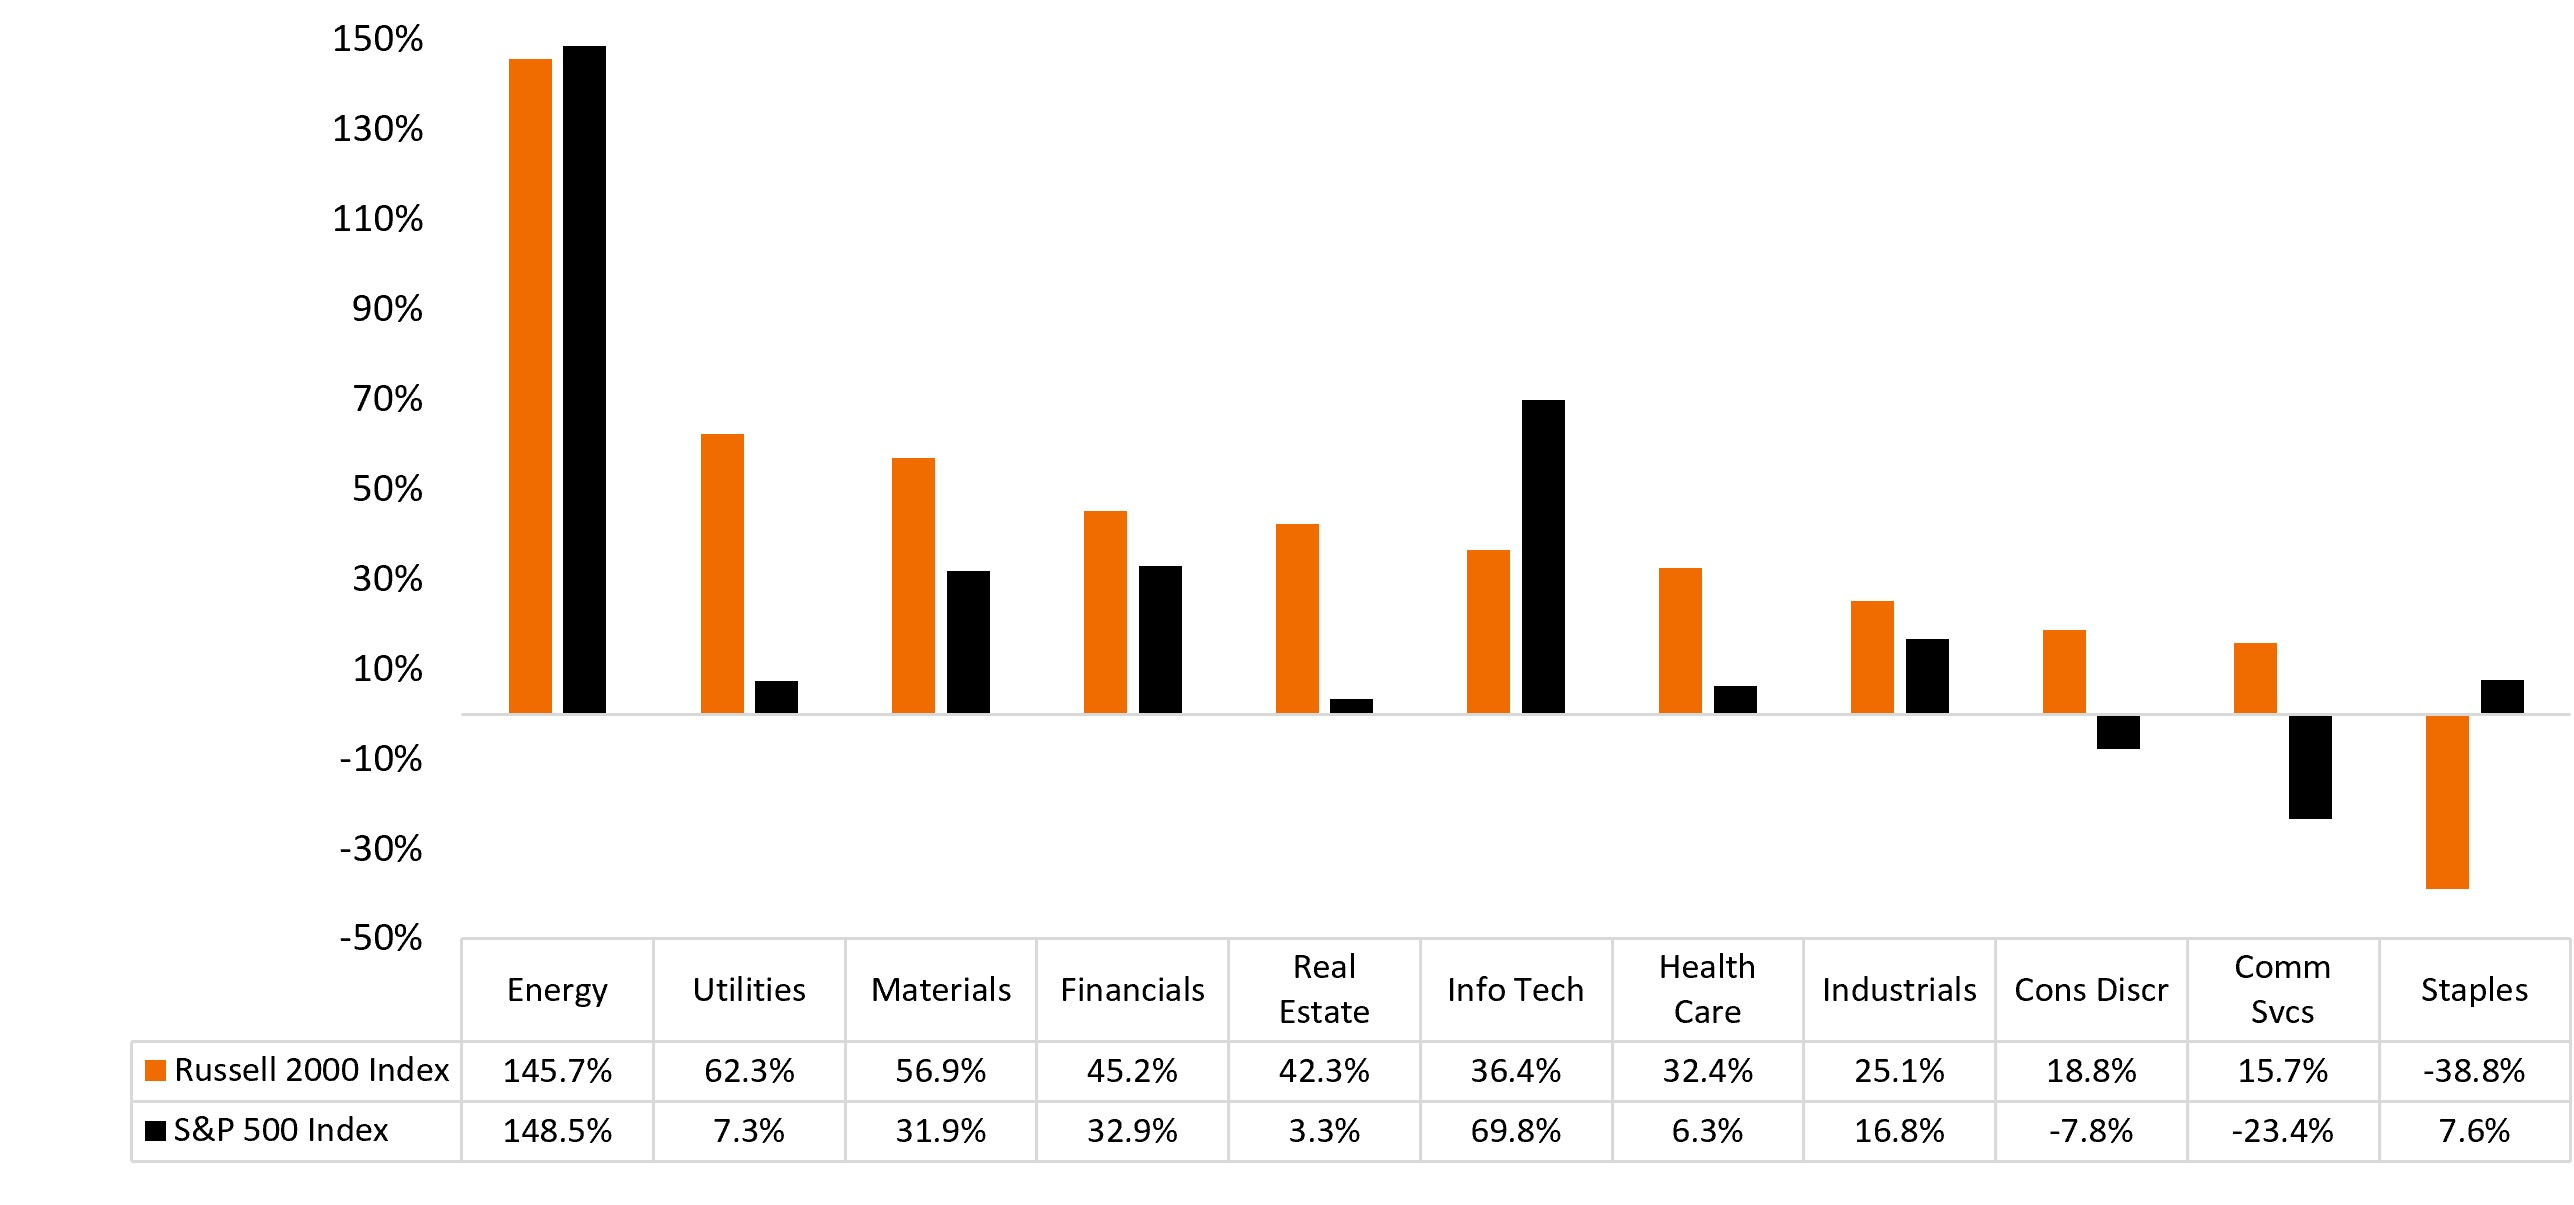
Source: Furey Research Partners and FactSet. Based on current constituents; unusual and other one-time expenses/gains removed where possible. Data as of 13 August 2026.
This breadth suggests the small-cap recovery is not dependent on a single industry. It also distinguishes the current environment from earlier periods when small caps appeared inexpensive but lacked the earnings growth needed to close the valuation gap.
Current estimates suggest small-cap earnings could grow faster than large-cap earnings in 2027 (21.8% vs. 10.6%, respectively).4 If that occurs, investors would have two potential drivers of return: earnings growth and additional valuation normalization.
AI is also a small-cap catalyst
AI is often viewed primarily as a large-cap opportunity, but small companies are participating too. Many industrial and technology businesses supply the equipment, components, and services required for data centers and other AI infrastructure. These “picks and shovels” companies are collecting revenue today as large tech firms build out capacity.
A separate, longer-term catalyst is small caps’ role as second-order AI beneficiaries. As AI tools become more broadly deployed across the economy, they could bring productivity gains and margin expansion for companies of all sizes. Because small caps generally start from a lower operating margin base, the same amount of margin expansion can translate into a much larger percentage increase in earnings. For example, a 200 basis-point margin expansion delivers roughly 33% earnings growth for a company with 6% operating margins, but only about 10% for a company with 20% operating margins.
Myth: Small caps need low rates to outperform
One of the most persistent misconceptions about small caps is that they require very low interest rates to outperform. History suggests otherwise.
Two of the strongest periods for small-cap relative performance over the past several decades occurred during the 1970s and the first decade of the 2000s. Both featured higher interest rates and persistent inflationary pressures.
Exhibit 3: Higher rate environments when small caps outperformed large caps
The 2000s (total return)
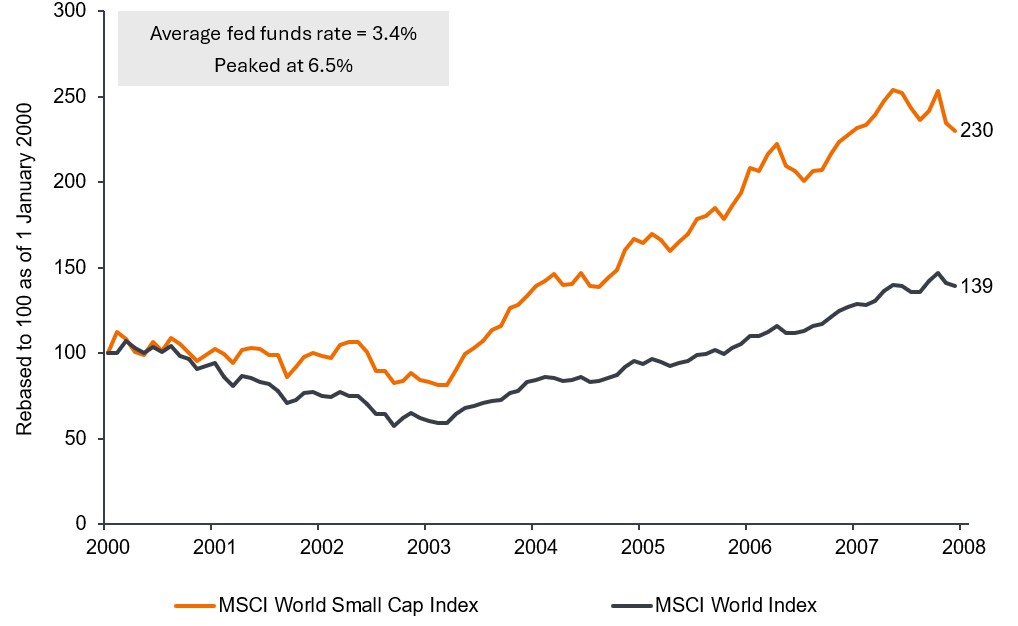
Source: Bloomberg, Janus Henderson Investors Analysis, as of 31 December 2025. Rebased to 100 as of 1 January 2000. Past performance does not predict future returns.
1970 – 1984 (price return)
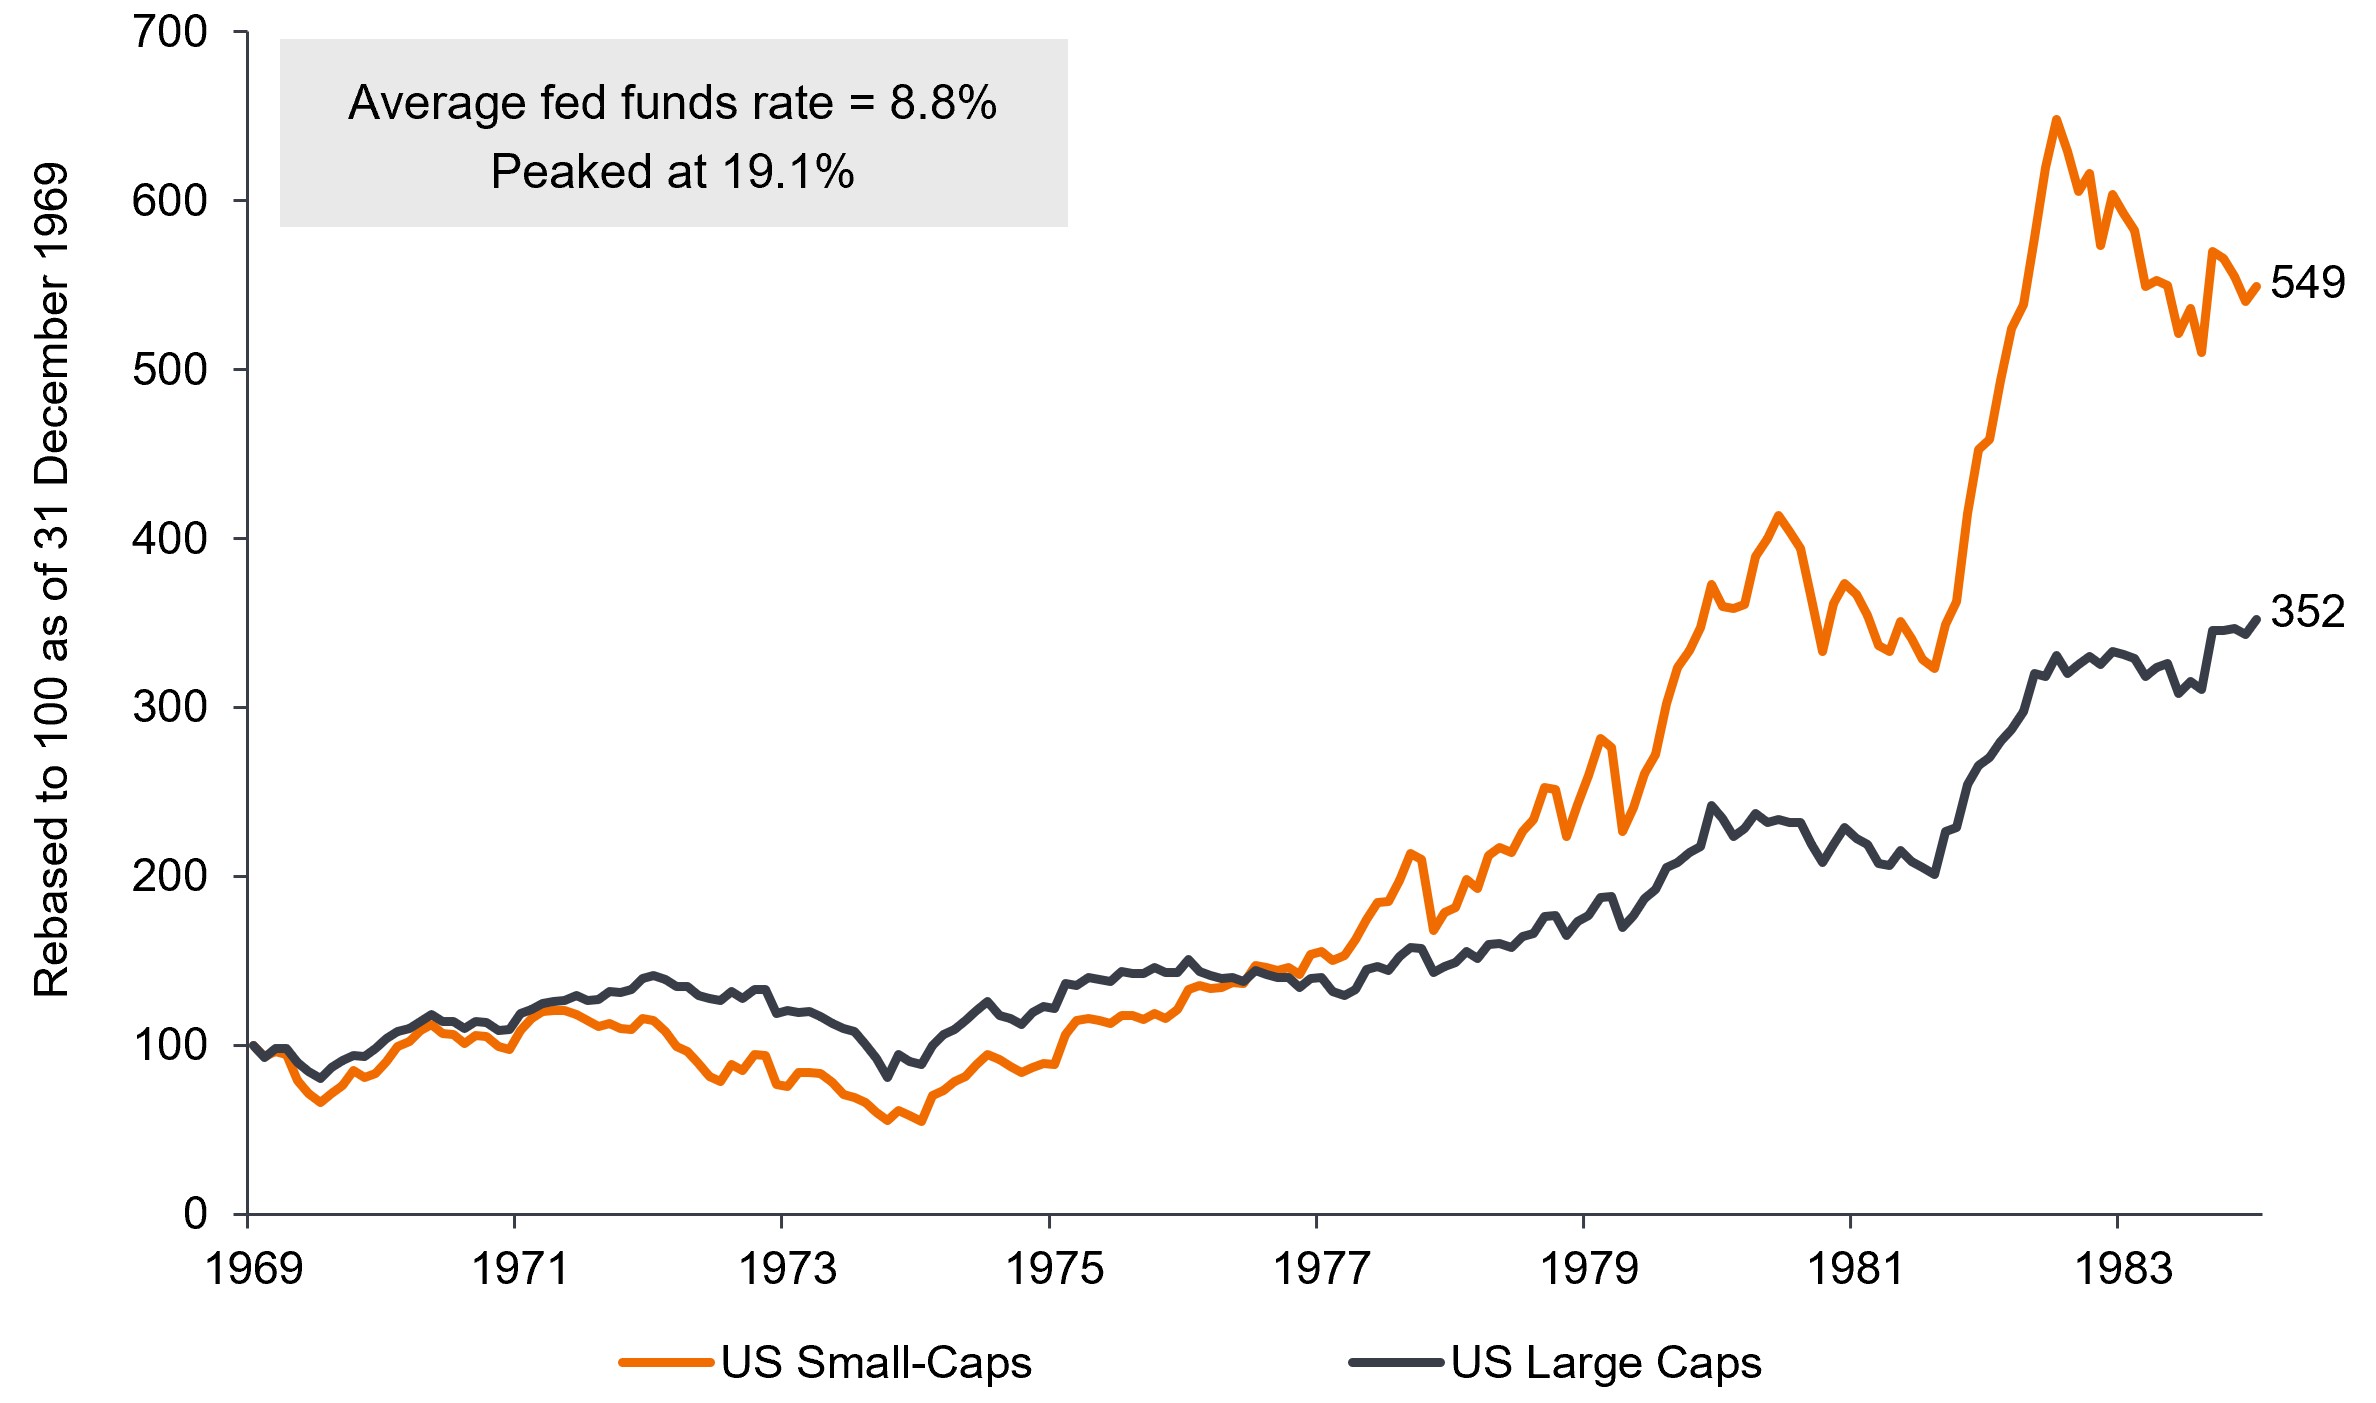
Source: Furey Research Partners, Ibbotson and FactSet. Small-cap returns use Ibbotson monthly returns up until Dec 1978, Russell 2000 thereafter; large-cap returns based upon the S&P 500. Rebased to 100 as of 31 December 1969. Past performance does not predict future returns.
We believe this partly reflects pricing and operating leverage. In a low-inflation environment, small companies may struggle to raise prices because they generally have less pricing power than large companies. When inflation is more widespread, businesses of all sizes are better able to adjust prices to cover rising costs.
That can have an outsized effect on small-company earnings. Small caps typically begin with operating margins in the single digits, while large-cap margins are often much higher. As a result, even modest margin improvement can produce a much larger percentage increase in small-cap earnings.
Current inflationary pressures may prove persistent. Tariffs, labor supply constraints, and the gradual fracturing of globalization could keep costs and rates elevated for years, regardless of which party holds office. In a potentially higher-for-longer interest rate environment, we favor companies with strong cash flow generation, solid balance sheets, and the ability to internally fund growth – characteristics that can provide resilience if financing conditions remain tight.
A new phase for small caps
For more than a decade, large-cap performance gave investors a good reason to concentrate their exposure up the capitalization spectrum, leaving portfolios more underweight small caps than most probably intended. These performance cycles tend to run long, often eight to 14 years. With earnings breadth improving and valuations still attractive, we believe the emerging small-cap cycle has room to run and gives investors reason to revisit that positioning.
Price-to-Earnings (P/E) Ratio measures share price compared to earnings per share for a stock or stocks in a portfolio. Premium/Discount indicates whether a security is currently trading above (at a premium to) or below (at a discount to) its net asset value. Russell 2000® Index reflects the performance of U.S. small-cap equities. S&P 500® Index reflects U.S. large-cap equity performance and represents broad U.S. equity market performance. 1 Source: Bloomberg, as of 31 August 2026.
2 Source: Furey Research Partners (FRP) and FactSet. Based on FRP’s capital loss earnings model using historical constituents. Data as of 13 August 2026.
3 Source: Seaport Research Partners, as of 14 August 2026.
4 Source: Furey Research Partners (FRP) and FactSet. Based on FRP’s capital loss earnings model using historical constituents. Data as of 13 August 2026.
IMPORTANT INFORMATION
Artificial intelligence (“AI”) focused companies, including those that develop or utilize AI technologies, may face rapid product obsolescence, intense competition, and increased regulatory scrutiny. These companies often rely heavily on intellectual property, invest significantly in research and development, and depend on maintaining and growing consumer demand. Their securities may be more volatile than those of companies offering more established technologies and may be affected by risks tied to the use of AI in business operations, including legal liability or reputational harm.
Smaller capitalization securities may be less stable and more susceptible to adverse developments, and may be more volatile and less liquid than larger capitalization securities.
Queste sono le opinioni dell'autore al momento della pubblicazione e possono differire da quelle di altri individui/team di Janus Henderson Investors. I riferimenti a singoli titoli non costituiscono una raccomandazione all'acquisto, alla vendita o alla detenzione di un titolo, di una strategia d'investimento o di un settore di mercato e non devono essere considerati redditizi. Janus Henderson Investors, le sue affiliate o i suoi dipendenti possono avere un’esposizione nei titoli citati.
Le performance passate non sono indicative dei rendimenti futuri. Tutti i dati dei rendimenti includono sia il reddito che le plusvalenze o le eventuali perdite ma sono al lordo dei costi delle commissioni dovuti al momento dell'emissione.
Le informazioni contenute in questo articolo non devono essere intese come una guida all'investimento.
Non vi è alcuna garanzia che le tendenze passate continuino o che le previsioni si realizzino.
Comunicazione di Marketing.
Important information
Please read the following important information regarding funds related to this article.
- Le Azioni possono perdere valore rapidamente e normalmente implicano rischi più elevati rispetto alle obbligazioni o agli strumenti del mercato monetario. Di conseguenza il valore del proprio investimento potrebbe diminuire.
- Le azioni di società a piccola e media capitalizzazione possono presentare una maggiore volatilità rispetto a quelle di società più ampie e talvolta può essere difficile valutare o vendere tali azioni al momento e al prezzo desiderati, il che aumenta il rischio di perdite.
- I derivati possono essere utilizzati con l’obiettivo di ridurre il rischio o gestire il portafoglio in modo più efficiente. Tuttavia, questo comporta rischi aggiuntivi, in particolare il rischio che la controparte del derivato non adempia ai suoi obblighi contrattuali.
- Qualora il Fondo detenga attività in valute diverse da quella di base del Fondo, o l’investitore detenga azioni/quote di una valuta diversa da quella del Fondo (a meno che non sia coperta, ovvero cerchi di mitigare i movimenti del tasso di cambio tra la valuta della classe di azioni/quote e la valuta di base del Fondo), il valore dell’investimento potrebbe subire le oscillazioni del tasso di cambio.
- Se il Fondo, o una sua classe di azioni con copertura, intende attenuare le fluttuazioni del tasso di cambio tra una valuta e la valuta di base, la stessa strategia di copertura potrebbe generare un effetto positivo o negativo sul valore del Fondo, a causa delle differenze di tasso d’interesse a breve termine tra le due valute.
- I titoli potrebbero diventare difficili da valutare o da vendere nel momento e al prezzo desiderati, specialmente in condizioni di mercato estreme caratterizzate da una discesa dei prezzi delle attività, con conseguente incremento del rischio di perdite sull’investimento.
- Potrebbero verificarsi perdite qualora una controparte non intendesse più o non fosse più in grado di adempiere ai propri obblighi, o a causa di un errore o di un ritardo nei processi operativi o di una negligenza di un fornitore terzo.
Specific risks
- Le Azioni possono perdere valore rapidamente e normalmente implicano rischi più elevati rispetto alle obbligazioni o agli strumenti del mercato monetario. Di conseguenza il valore del proprio investimento potrebbe diminuire.
- Le azioni di società a piccola e media capitalizzazione possono presentare una maggiore volatilità rispetto a quelle di società più ampie e talvolta può essere difficile valutare o vendere tali azioni al momento e al prezzo desiderati, il che aumenta il rischio di perdite.
- Il Fondo segue uno stile d’investimento di tipo “growth” che privilegia determinati tipi di società. Conseguentemente, il Fondo potrebbe sottoperformare o sovraperformare significativamente la media del mercato.
- Le SPAC sono società di comodo create per acquisire aziende. Essendo complesse e spesso prive della trasparenza delle società consolidate, presentano maggiori rischi per gli investitori.
- Un’esposizione elevata a un determinato paese o a una specifica regione geografica comporta un livello di rischio più elevato rispetto a un Fondo più ampiamente diversificato.
- Qualora il Fondo detenga attività in valute diverse da quella di base del Fondo, o l’investitore detenga azioni/quote di una valuta diversa da quella del Fondo (a meno che non sia coperta, ovvero cerchi di mitigare i movimenti del tasso di cambio tra la valuta della classe di azioni/quote e la valuta di base del Fondo), il valore dell’investimento potrebbe subire le oscillazioni del tasso di cambio.
- I derivati possono essere utilizzati per aiutare a raggiungere l’obiettivo di investimento. Ciò potrebbe determinare una “leva” (livelli più elevati di debito), che potrebbe amplificare i risultati dell’investimento Le perdite o i guadagni potrebbero superare il costo del derivato. I derivati comportano rischi aggiuntivi, in particolare il rischio che la controparte del derivato non adempia ai suoi obblighi contrattuali.
- Se il Fondo, o una sua classe di azioni con copertura, intende attenuare le fluttuazioni del tasso di cambio tra una valuta e la valuta di base, la stessa strategia di copertura potrebbe generare un effetto positivo o negativo sul valore del Fondo, a causa delle differenze di tasso d’interesse a breve termine tra le due valute.
- I titoli potrebbero diventare difficili da valutare o da vendere nel momento e al prezzo desiderati, specialmente in condizioni di mercato estreme caratterizzate da una discesa dei prezzi delle attività, con conseguente incremento del rischio di perdite sull’investimento.
- Potrebbero verificarsi perdite qualora una controparte non intendesse più o non fosse più in grado di adempiere ai propri obblighi, o a causa di un errore o di un ritardo nei processi operativi o di una negligenza di un fornitore terzo.