
Key takeaways:
- The Russell Midcap Growth Index has evolved from a diversified benchmark into what is largely a concentrated collection of the most richly valued stocks in the mid-cap universe.
- The excessive concentration and valuation risk currently embedded in the index makes it a less reliable benchmark for balanced mid-cap growth exposure.
- Rather than relying on the benchmark in aggregate, we believe investors would be better served by staying focused on companies with durable business models, competitive advantages, and valuations that can be supported by long-term earnings power.
Market dynamics can reshape even the most established benchmarks. While we’ve all seen the Magnificent Seven’s imprint on the S&P 500® Index, an even more telling example is the narrowing of the Russell Midcap Growth Index (Growth Index). What was once a diversified representation of growing mid-cap companies has evolved into a concentrated collection of the market’s highest valued names.
This transformation has resulted in a significantly riskier index than just a few years ago. It also raises questions about whether the benchmark remains a reliable measure of broad-based mid-cap growth.
Lopsided performance
The Index’s elevated risk profile becomes clear when examining performance by valuation metrics. In the first half of 2025, the top decile by price-to-sales ratio returned more than 40%, while the second most expensive decile returned about 30%. The remaining 80% of the index posted an average return of just 2.6% (Exhibit 1).
Exhibit 1: YTD total return by price-to-sales decile (%) of Russell Midcap Growth Index
Expensive stocks continue to drive returns in first half of 2025.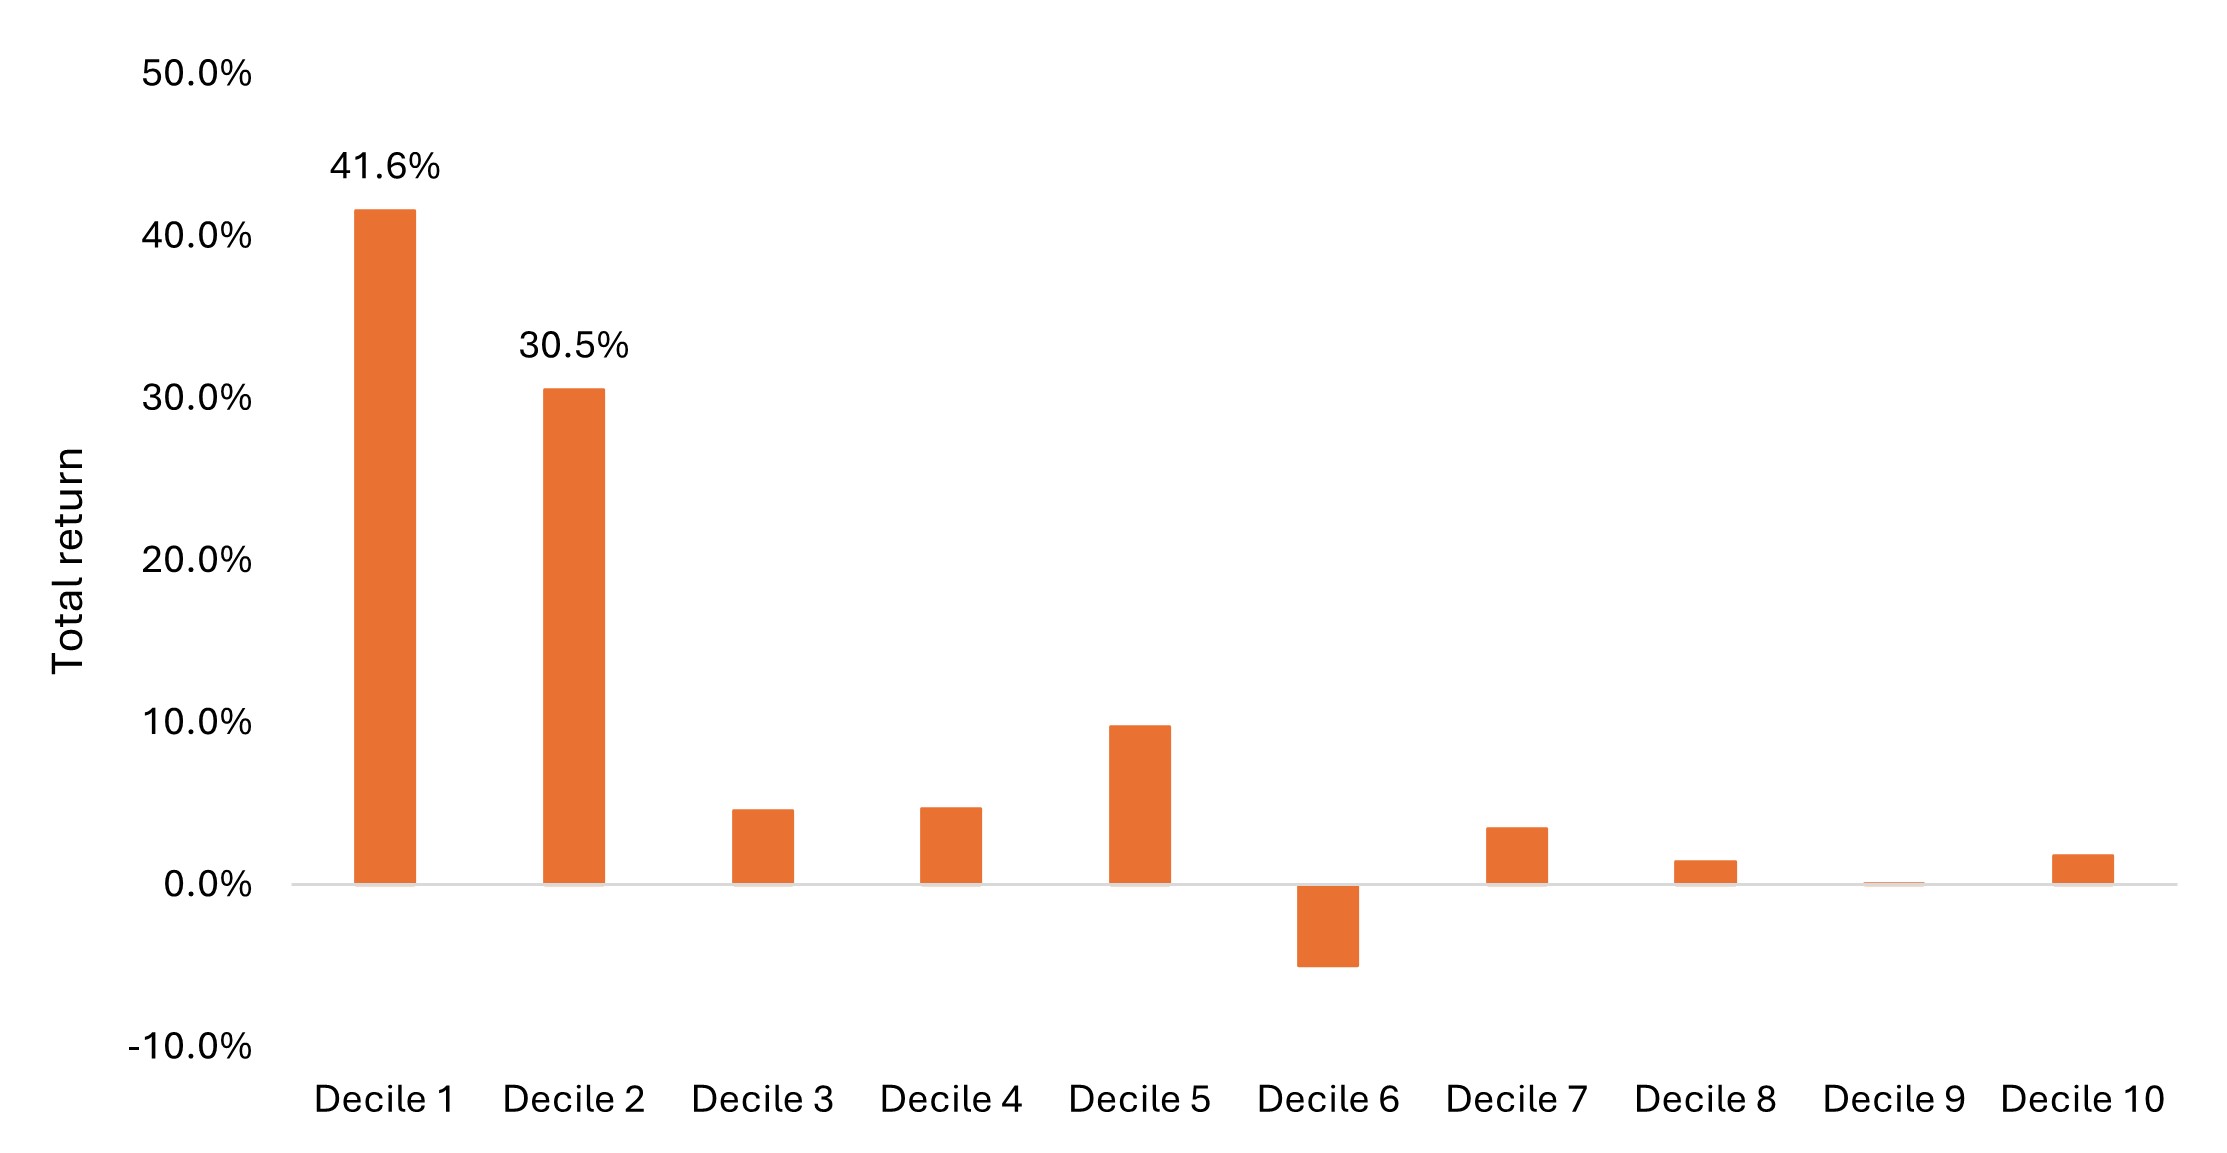
Source: FactSet, Bloomberg, as at 30 June 2025.
This skewed performance pattern isn’t new. Similar dynamics played out in 2020, 2023, and 2024, with the cumulative impact pushing the entire index to historically extreme valuations. While the Growth Index has typically traded between 20 and 22 times expected earnings, over the past seven years its valuation has climbed higher and currently trades at about 38x (Exhibit 2).
Exhibit 2: Forward Price to Earnings, Russell Midcap Growth vs. Russell Midcap Index
The Growth Index’s revaluation has been largely driven by the outsized performance of its most expensive components.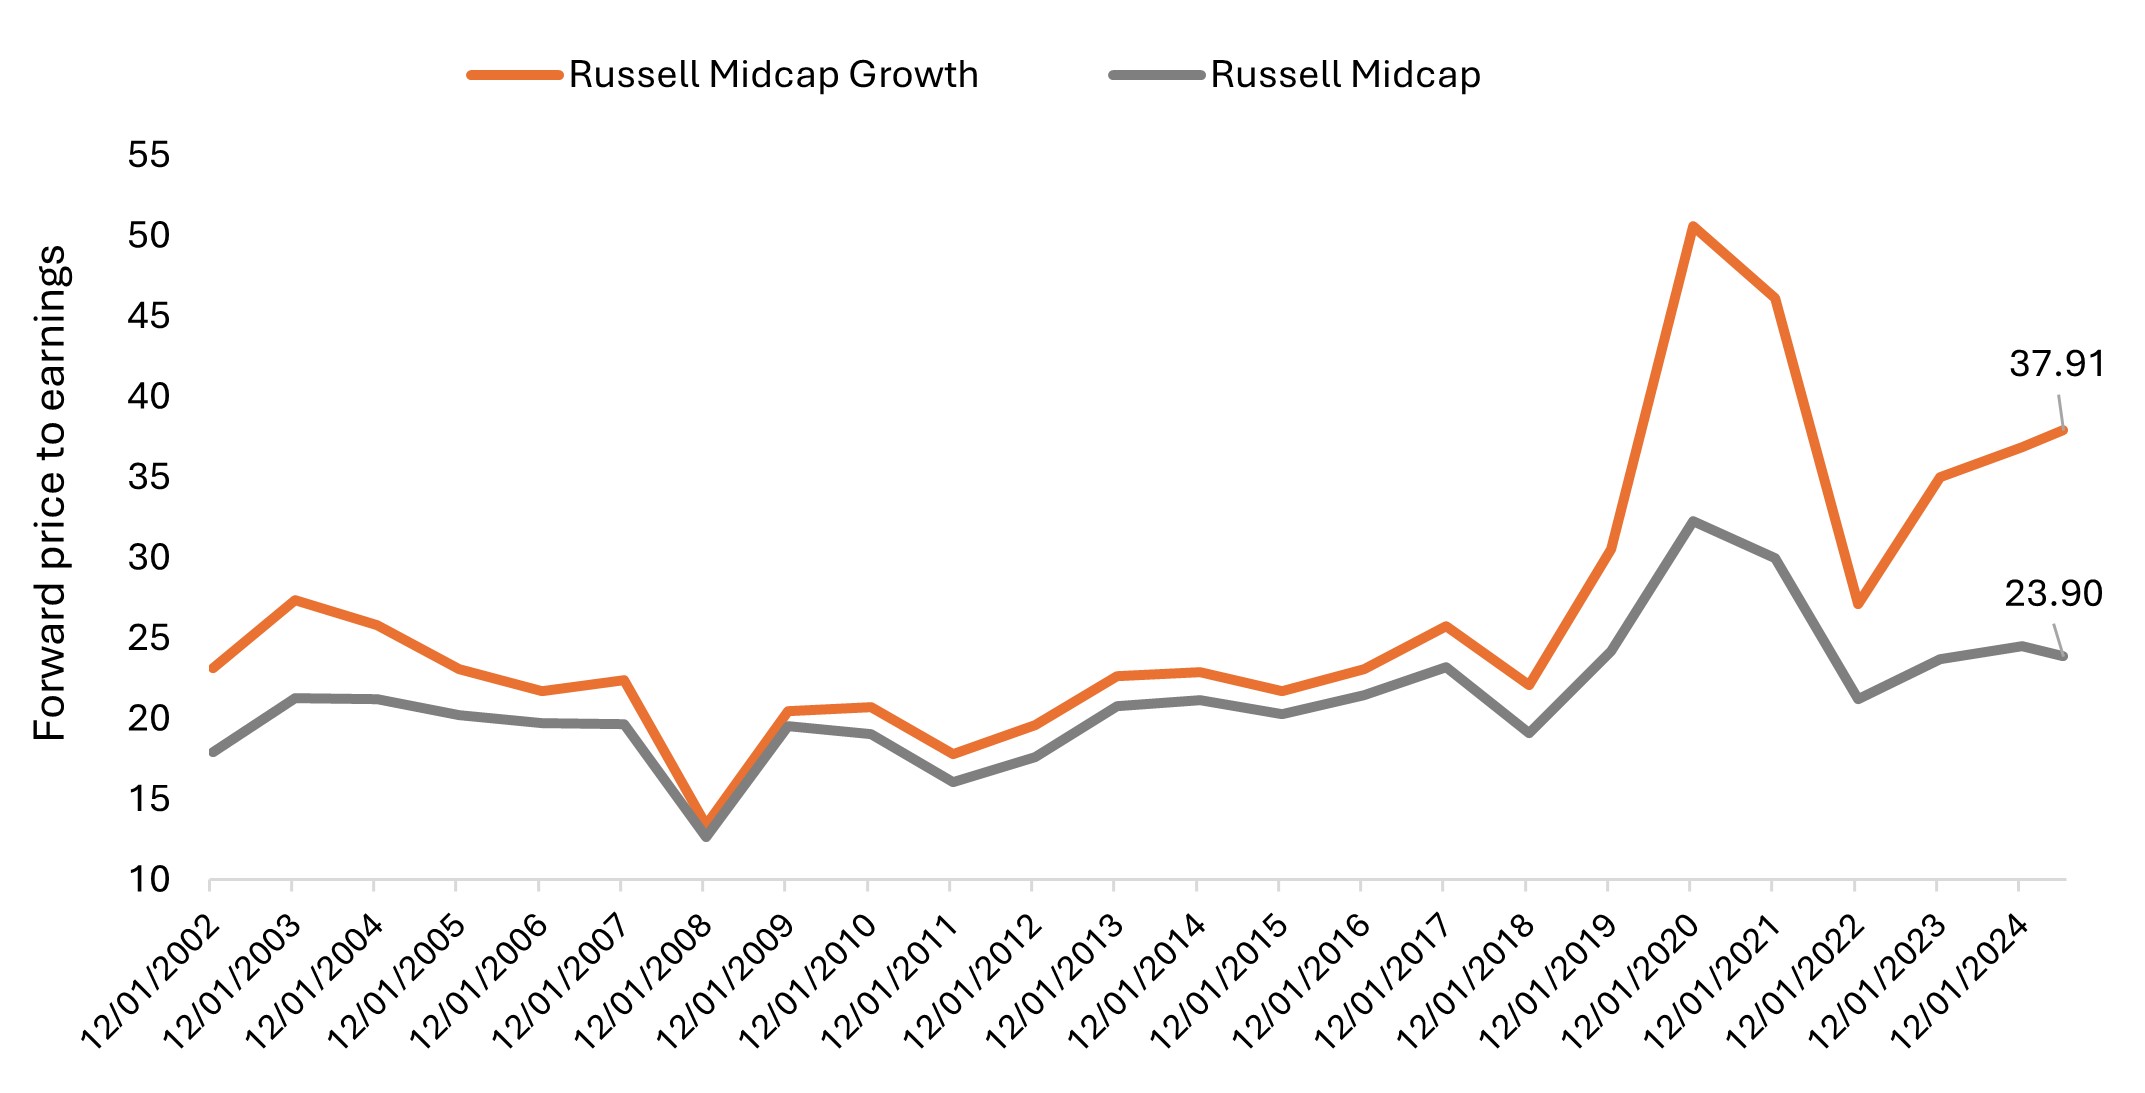
Source: Janus Henderson Investors, as of 30 June 2025. Forward Price to Earnings. Weighted average calculation method.
That near doubling in valuation reflects a dramatic shift in investor sentiment toward speculative growth stories, often at the expense of fundamental discipline. As valuation concerns have been ignored, the index has increasingly reweighted toward the most aggressive and expensive names.
The index’s increased risk has become evident during periods of market stress. During the 2021-2022 drawdown, the Growth Index was the second-worst performing of the nine style box indices, with losses exceeding the tech-heavy Nasdaq Composite Index (Nasdaq). More recently, it again exhibited similar sensitivity during the April 2025 DeepSeek selloff, tracking closely with the Nasdaq.
A shrinking universe
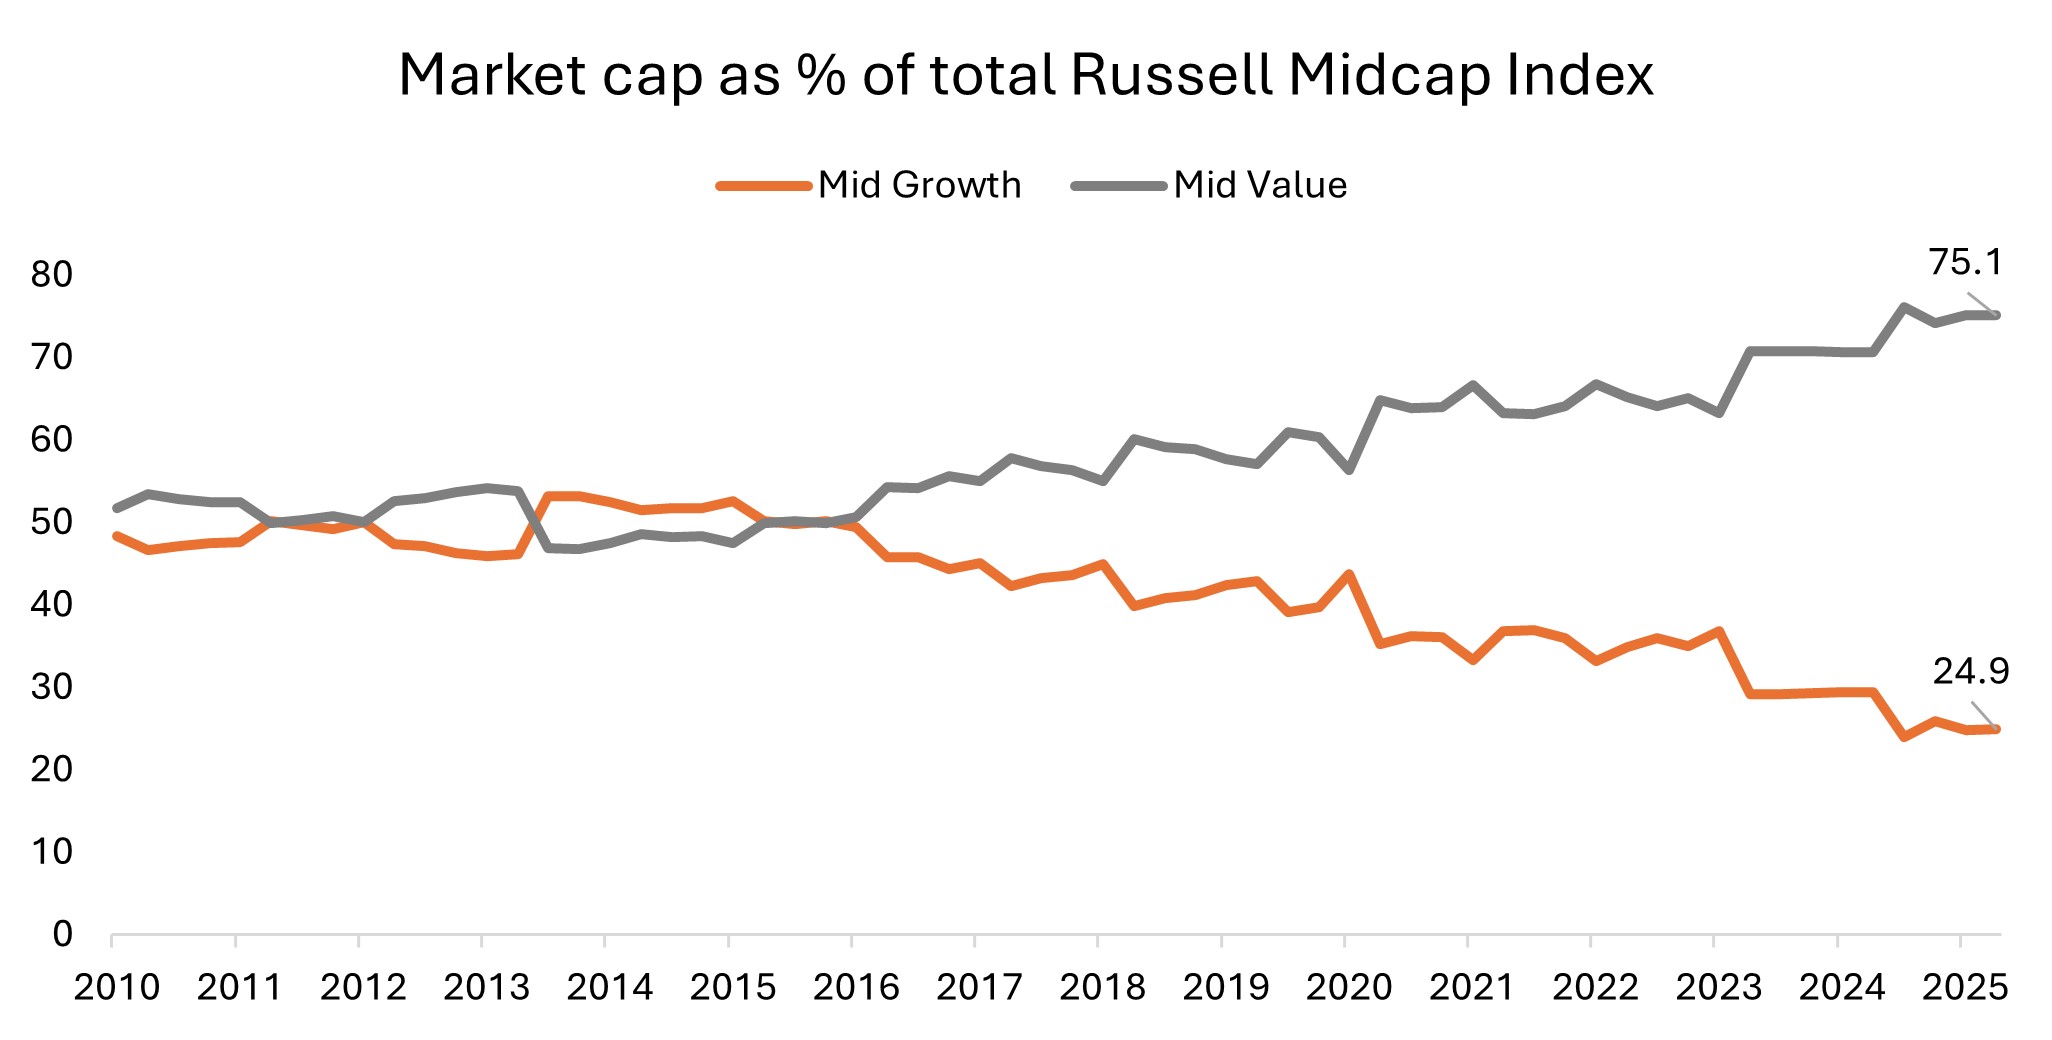
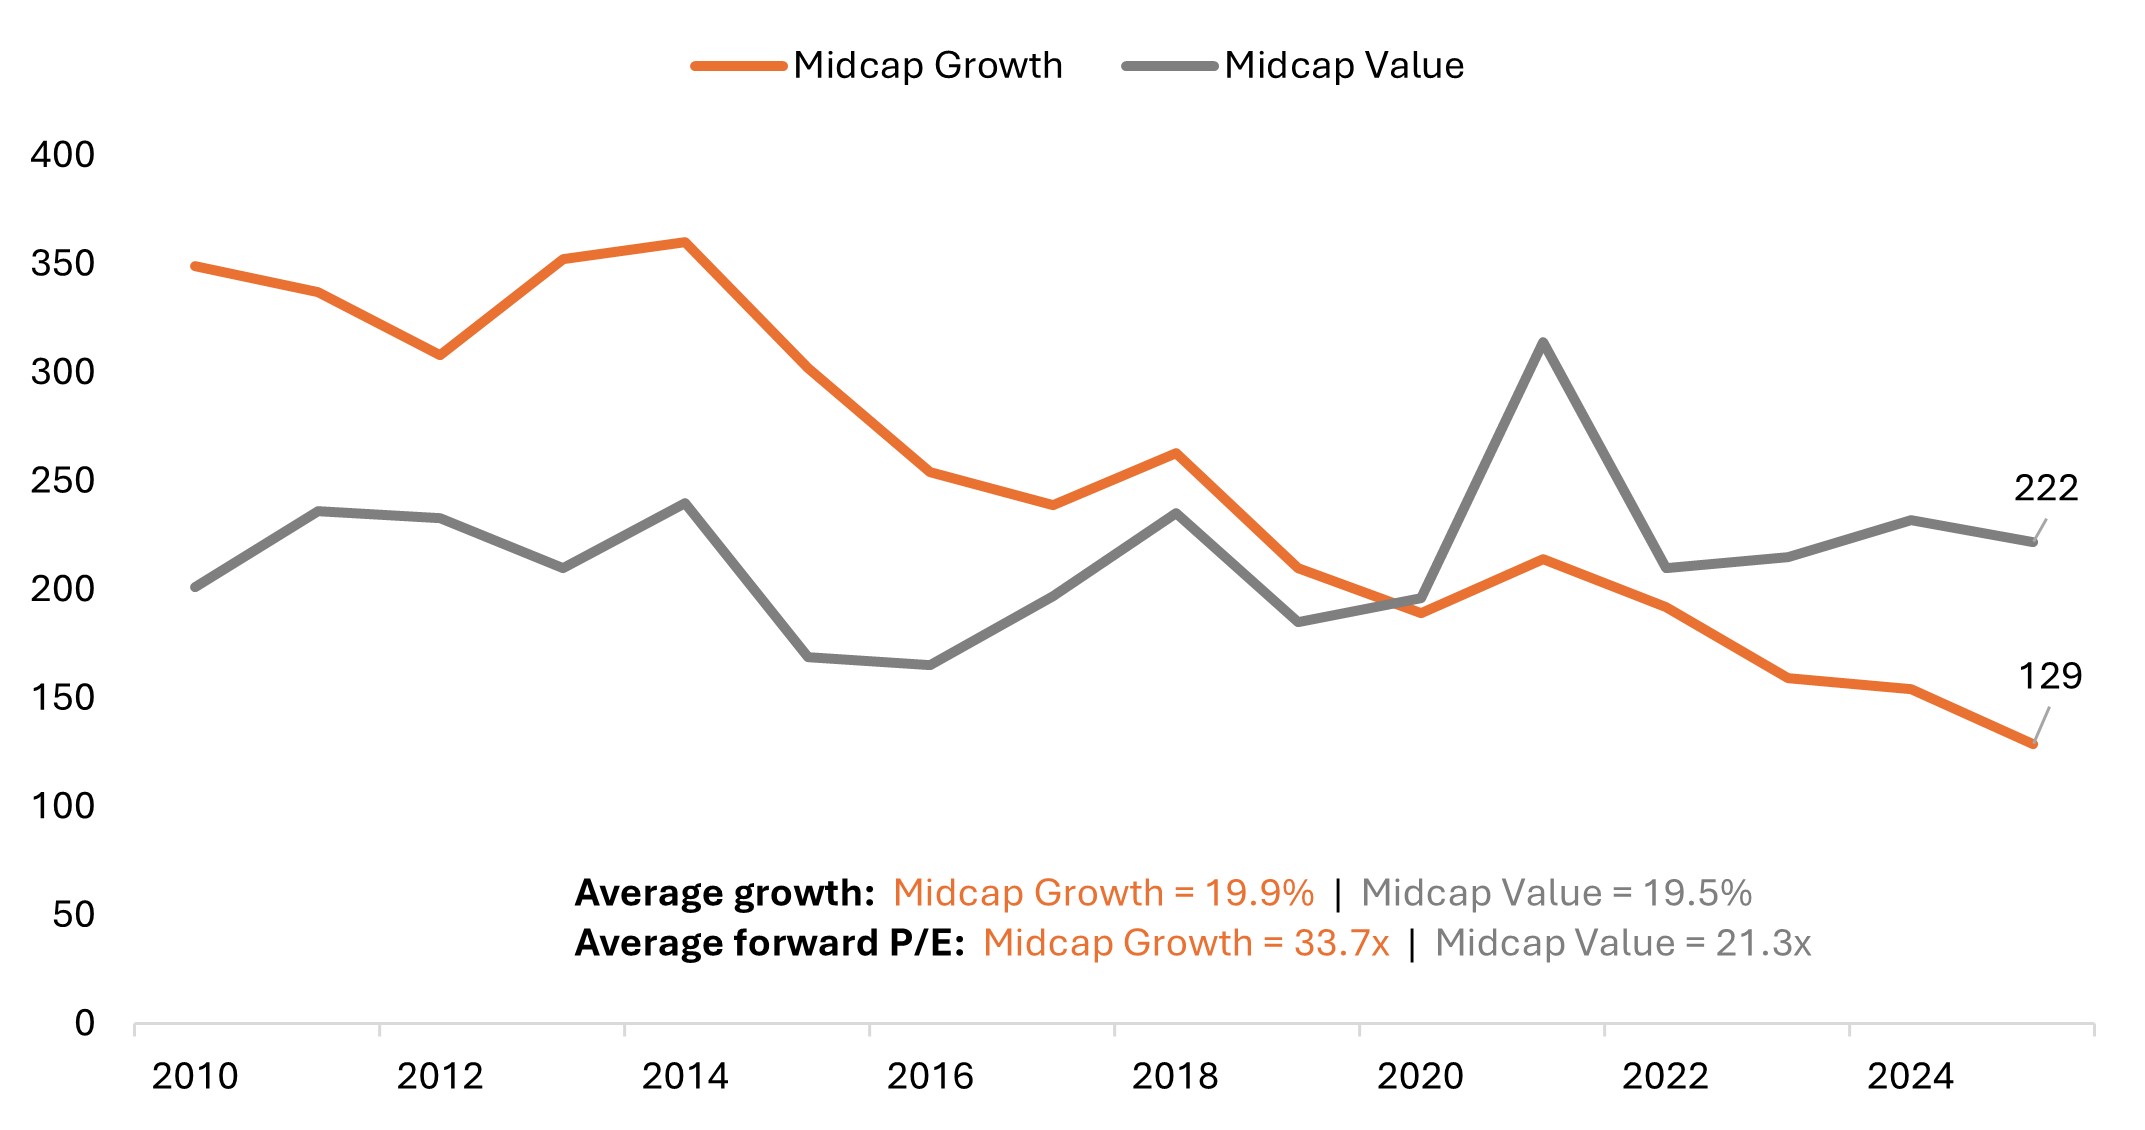
These boom-and-bust performance patterns reflect a fundamental shift in composition. Since 2015, the Growth Index has narrowed considerably and now holds just 276 names compared to 722 in the Russell Midcap Value Index (Value Index). The Growth Index’s total market cap stands at roughly $3 trillion – just one-quarter of the total mid-cap universe market cap (Exhibit 3).
This concentration marks a significant departure from the 2010s, when the index represented the growthier half of mid-cap stocks. Today, it effectively captures only the growthiest fraction, creating a fundamentally different proxy driven by the most speculative names.
Exhibit 3: The Growth Index’s number of companies and market cap as % of total Russell Midcap Index cap have been in steady decline since 2015
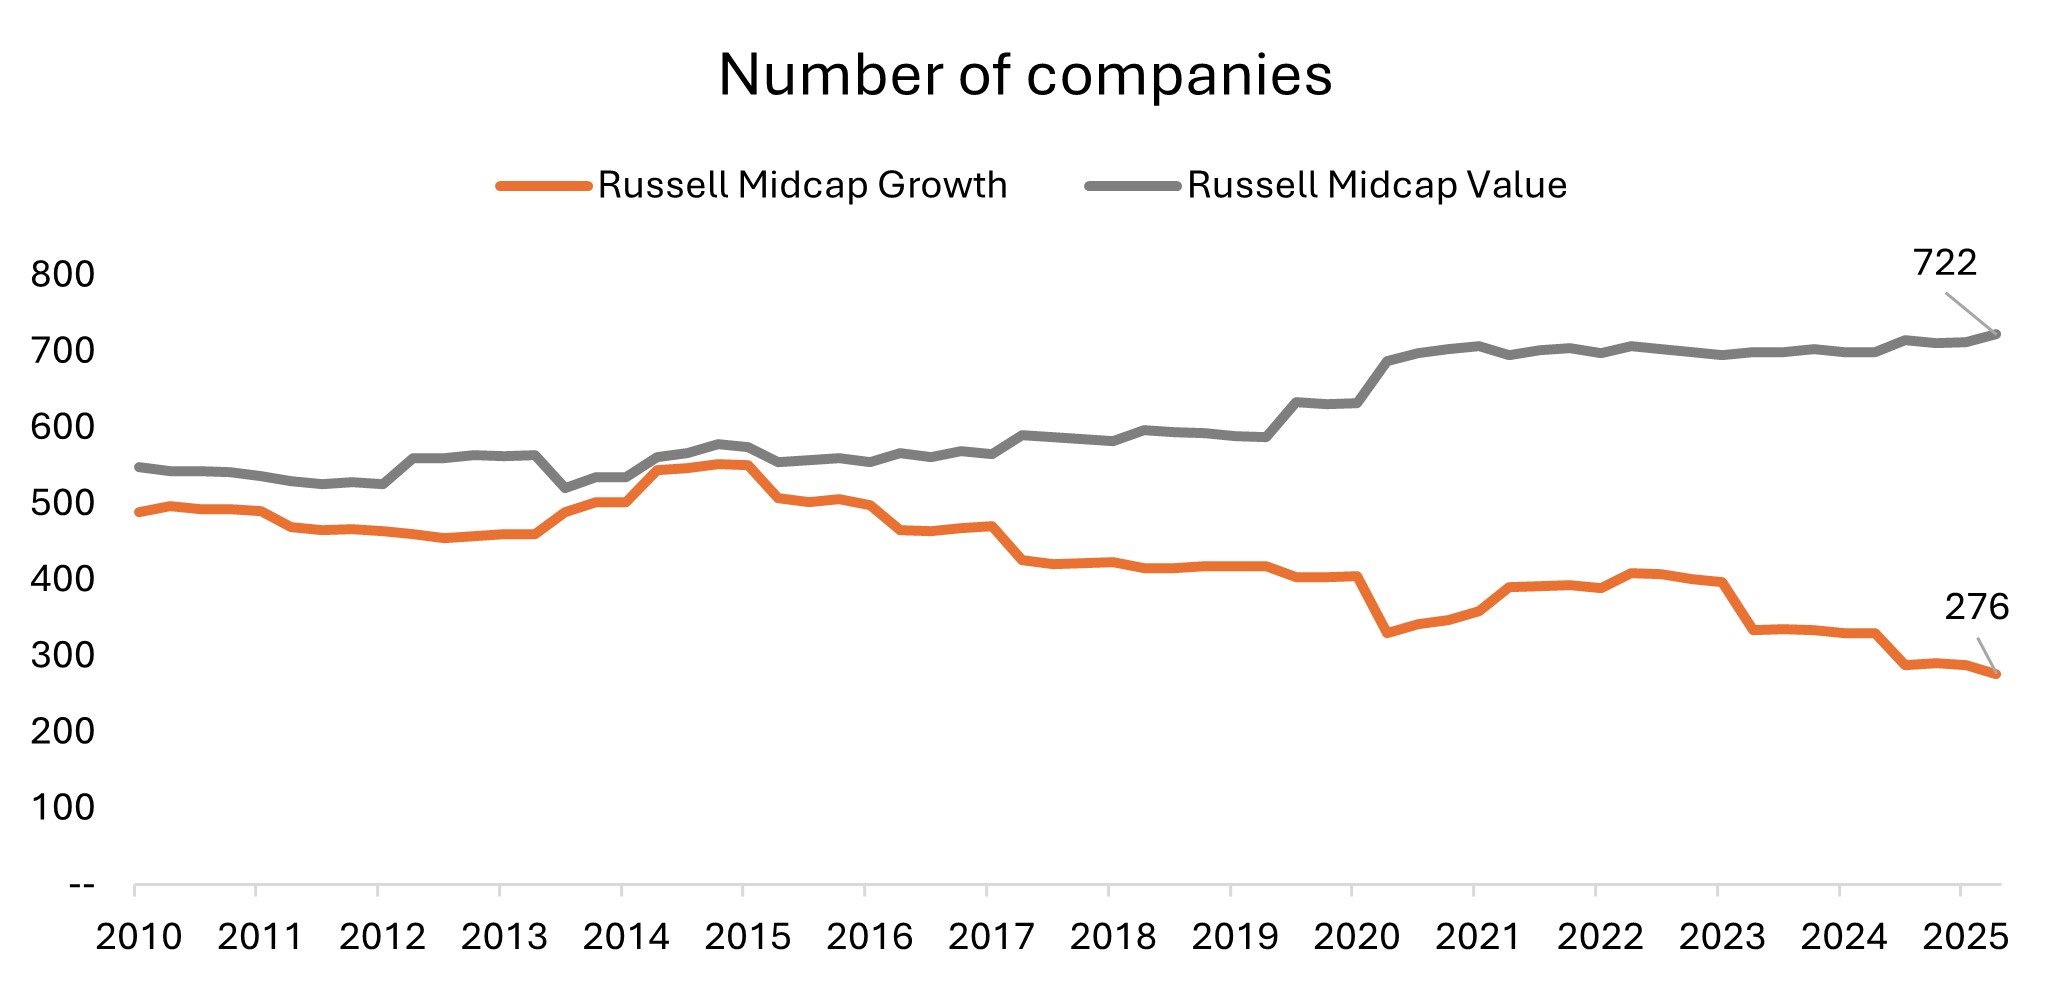
Source: Janus Henderson Investors, FactSet, as 30 June 2025.
The concentration also stems from Russell’s methodology. While the Russell 1000 Index segments the universe 50/50 into growth and value, the Midcap Index is a subset of the Russell 1000 and reflects the actual distribution of growth and value traits within the mid-cap universe, not a forced split of that universe. Also, because of increasing concentration of mega-cap growth companies in the Russell 1000, such as those in the Magnificent Seven, there has been a crowding out of other growth companies.
Zero interest rate policies and negative real yields since late 2019 have compounded this dynamic, particularly benefiting the highest-multiple companies. This created a self-reinforcing cycle where the most speculative names attracted more capital, further concentrating the index.
Compounding the risk of a narrowing index is asset concentration. A greater amount of managed assets is benchmarked to the Midcap Growth Index compared to the Midcap Value Index. This creates a significant imbalance: A large pool of capital is focused on one-quarter of the mid-cap universe based on market cap. This crowding creates vulnerability, where any catalyst causing capital rotation could lead to amplified downside.
Index makeup can shift quickly
The Growth Index’s annual reconstitution on June 27 brought significant changes, most notably data analytics company Palantir’s departure. With a market cap of $340 billion and trading over 75 times revenue and 200 times earnings, Palantir had grown to represent over 9% of the index weight. Its graduation to the Russell Top 200 Index removed a major speculative driver.
Other material adjustments include AppLovin (2.7% weight) also graduating out. Sector weights shifted notably: Technology declined 10.8%, while Consumer Discretionary increased over 8.2%. At the industry level, Hotels, Restaurants & Leisure jumped to 13.2% from 6.7%, and Aerospace & Defense rose to 6.4% from 3.3%.
These changes illustrate how quickly the index makeup – and risk profile – can shift.
Can high valuations be justified?
The critical question is whether highly valued companies dominating the index can realistically grow into their lofty multiples. History suggests this is challenging. Currently, about 31% of the index trades above 10 times Enterprise Value to Sales (EV/S). For a company trading at 10x EV/S to deliver a 10% annualized return, it would need to organically compound revenue at 19% per year for an entire decade, assuming a 30% terminal operating margin. Over the past 10 years, only 6% of public companies have achieved such growth rates, and most of those have done so by way of substantial merger and acquisition (M&A) activity, rather than organically.
While some individual companies may succeed, the aggregate faces a high hurdle. Many stocks carry expectations that will be difficult to meet, making the risk of disappointment acute. Over the long term, the market acts as a “weighing machine”: Companies must eventually justify their value through exceptional growth or significant profitability expansion.
Finding opportunity despite index risk
Despite these index challenges, when approached selectively, opportunities for prudently diversified exposure still exist in the mid-cap space – just not necessarily within the benchmark’s confines. Many companies with strong fundamentals, steady growth, and reasonable valuations happen to be classified as value based on Russell’s methodology (Exhibit 4).
Exhibit 4: Number of companies with estimated 3-5-year EPS growth greater than 10%
Ample growth opportunities still exist within the broader mid-cap universe, including those classified as value by Russell.
Source: Janus Henderson Investors, FactSet, as of June 30, 2025.
Selectivity over index exposure
The Growth Index has evolved into a more speculative and concentrated benchmark heavily weighted toward expensive, high-growth stocks. For investors seeking broad-based exposure to mid-cap growth, the index may no longer serve as an appropriate proxy.
Going forward, we think a more intentional approach is warranted. Staying focused on companies with durable business models, competitive advantages, and valuations that can be supported by long-terms earnings power is key. While the index has moved toward one end of the risk spectrum, the broader mid-cap universe still holds compelling opportunities. They just may lie outside the benchmark.
Enterprise value-to-sales (EV/Sales) ratio indicates whether its stock is overpriced or underpriced by comparing its potential takeover value to its recent sales numbers.
Magnificent 7 includes Apple, Microsoft, Amazon, NVIDIA, Alphabet, Tesla and Meta.
National Association of Securities Dealers Automated Quotation System (NASDAQ) is a nationwide computerized quotation system for over 5,500 over-the-counter stocks. The index is compiled of more than 4,800 stocks that are traded via this system.
Price-to-Sales (P/S) ratio is a valuation metric that compares a company’s stock price to its revenues, providing insight into how much investors are willing to pay for each dollar of sales.
Price-to-Earnings (P/E) ratio measures share price compared to earnings per share for a stock or stocks in a portfolio.
Russell Midcap® Growth Index reflects the performance of U.S. mid-cap equities with higher price-to-book ratios and higher forecasted growth values.
S&P 500® Index reflects U.S. large-cap equity performance and represents broad U.S. equity market performance. Russell Midcap® Index reflects the performance of U.S. mid-cap equities.
The Russell Midcap® Value Index measures the performance of the mid- cap value segment of the US equity universe.
Russell 1000® Index reflects the performance of U.S. large-cap equities.
IMPORTANT INFORMATION
Actively managed investment portfolios are subject to the risk that the investment strategies and research process employed may fail to produce the intended results. Accordingly, a portfolio may underperform its benchmark index or other investment products with similar investment objectives.
Equity securities are subject to risks including market risk. Returns will fluctuate in response to issuer, political and economic developments.
Growth stocks are subject to increased risk of loss and price volatility and may not realize their perceived growth potential.
Smaller capitalization securities may be less stable and more susceptible to adverse developments, and may be more volatile and less liquid than larger capitalization securities.