
Key takeaways:
- S&P 500 Index sectors focused on growth, stability, and defense have grown from about 60% of the index in 2014 to roughly 74% today. Meanwhile, cyclical sectors have shrunk from roughly 40% to 26%.
- U.S. large-cap market multiples are higher than in recent history, but it is worth noting that the mix of industries within major indexes has shifted toward faster-growing, more profitable sectors that typically command higher multiples.
- Fundamentals are helping to support current valuations: The gap in profitability between growth and value indexes has widened over time, helping explain why the valuation gap has grown as well.
Source: Bloomberg, as of 15 October 2025.
The S&P 500® Index looks very different today than it did a decade ago. Sectors focused on growth, stability, and defense1 have grown from about 60% of the index in 2014 to roughly 74% today. Meanwhile, cyclical sectors2 have shrunk from roughly 40% to 26%.
Energy offers a stark example of shifts in market composition: its weight in the S&P 500 has fallen from approximately 11% in 2014 to about 3% today. The bottom line is that the S&P 500 has become growthier, and market valuations have risen accordingly.
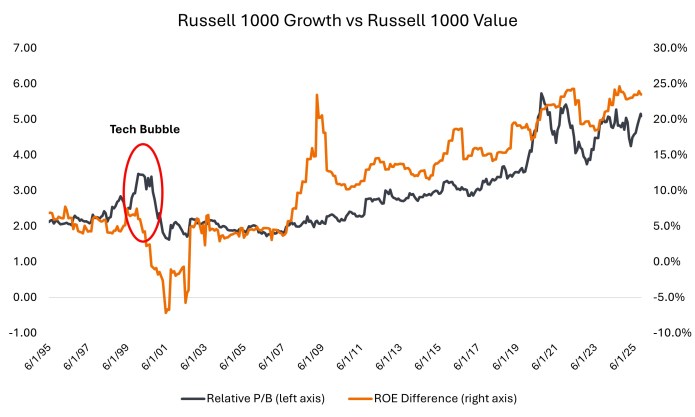
The chart above compares large-cap growth and value indexes on two key measures: valuation (price-to-book ratio, shown on the left axis) and quality (return on equity, shown on the right axis). The comparison highlights a key difference in today’s market versus the tech bubble of 2000.
Growth stocks trade at a wide valuation (price-to-book) premium to value stocks today, but there is a crucial difference from 2000: Fundamentals are helping to support current valuations.
The gap in profitability (return on equity) between growth and value indexes has widened over time, helping explain why the valuation gap has grown as well. Since 2002, increases in price-to-book ratios have been matched by comparable increases in return on equity. During the 2000 tech bubble, by contrast, growth valuations surged without any fundamental support.
U.S. large-cap market multiples are higher than in recent history, but it is worth taking into account that the mix of industries within major indexes has shifted toward faster-growing, more profitable sectors that typically command higher multiples. Strong recent earnings growth – with similar expectations through year end and into next year – also help justify higher valuations.
Sources & definitions
1 Growth, stability and defense sectors represented by technology, communication services, health care, consumer staples, consumer discretionary, utilities, and real estate.
2 Cyclical sectors represented by financials, industrials, materials, and energy.
Return on Equity (ROE) is the measure of a company’s annual return (net income) divided by the value of its total shareholders’ equity, expressed as a percentage. The number represents the total return on equity capital i.e., the profits made for each dollar from shareholders’ equity.
Price-to-Book (P/B) Ratio measures share price compared to book value per share for a stock or stocks in a portfolio.
S&P 500® Index reflects U.S. large-cap equity performance and represents broad U.S. equity market performance.
Russell 1000® Growth Index reflects the performance of U.S. large-cap equities with higher price-to-book ratios and higher forecasted growth values.
Russell 1000® Value Index reflects the performance of U.S. large-cap equities with lower price-to-book ratios and lower expected growth values.
Related insights

All opinions and estimates in this information are subject to change without notice and are the views of the author at the time of publication. Janus Henderson is not under any obligation to update this information to the extent that it is or becomes out of date or incorrect. The information herein shall not in any way constitute advice or an invitation to invest. It is solely for information purposes and subject to change without notice. This information does not purport to be a comprehensive statement or description of any markets or securities referred to within. Any references to individual securities do not constitute a securities recommendation. Past performance is not indicative of future performance. The value of an investment and the income from it can fall as well as rise and you may not get back the amount originally invested.
Whilst Janus Henderson believe that the information is correct at the date of publication, no warranty or representation is given to this effect and no responsibility can be accepted by Janus Henderson to any end users for any action taken on the basis of this information.