
Key takeaways:
- Benchmark indices like the Bloomberg U.S. or Global Aggregate (Agg) are heavily skewed toward interest‑rate risk, concentrated in a small number of sectors, and exclude or underrepresent large portions of the investable fixed income universe – limiting their effectiveness as a true portfolio home base, in our view.
- In contrast, a purpose‑built strategic asset allocation (SAA) emphasizes diversification across sectors, a better balance of interest‑rate and credit‑spread risk, and exposure to areas of the market that have historically offered more attractive risk‑return trade‑offs.
- Over time, multisector fixed income strategies have delivered higher returns with lower volatility than the U.S. and Global Agg, highlighting the potential benefits of diversified income sources combined with active, research‑driven portfolio construction.
Investors face a perpetual tradeoff in trying to achieve the highest possible returns with the least amount of risk.
While it is seldom stated so bluntly, the objective of active management is to a) be effective in tailoring an investment portfolio to match a client’s specific goals, and b) achieve that goal in the most efficient manner.
These key tenets of effectiveness and efficiency – coupled with deep fundamental research and sophisticated quantitative processes – form the cornerstone of our approach to constructing diversified fixed income portfolios.
The need for a new home base
When considering an allocation to fixed income, the conventional approach has been to pick a benchmark index as the starting point, such as the Bloomberg U.S. Aggregate Bond Index (U.S. Agg) or the Bloomberg Global Aggregate Bond Index (Global Agg).
The challenge in starting with a benchmark index, however, is that fixed-income indices are inherently structurally limited.
For example, the U.S. Agg is limited in the following ways:
- Risk profile is disproportionately skewed toward interest-rate risk (duration).
- Sector exposure is concentrated in U.S. Treasuries, agency mortgage-backed securities (MBS), and investment-grade corporates.
- Fixed-rate bonds only, no floating-rate exposure.
- Issue size minimums must be met for inclusion.
- Rating by S&P, Moody’s, or Fitch required for inclusion.
- Agency MBS addition in 1986 was the last major improvement to the index.
Benchmark indices may not be aligned with client objectives
An effective portfolio is one that successfully achieves a client’s investment objective. Portfolios should adapt to meet client preferences, not the other way around.
The rigid and static nature of benchmark indices means they do not necessarily cater to a range of client objectives, making them a less-than-ideal home base or starting point for many investors.
The U.S. Agg is heavily skewed toward interest rate risk, with little exposure to credit spread risk. While this might be appropriate for some clients, we have found that many investors’ goals are not effectively achieved by portfolios with unbalanced risk exposure.
Exhibit 1: The U.S. Agg is heavily skewed toward interest rate risk
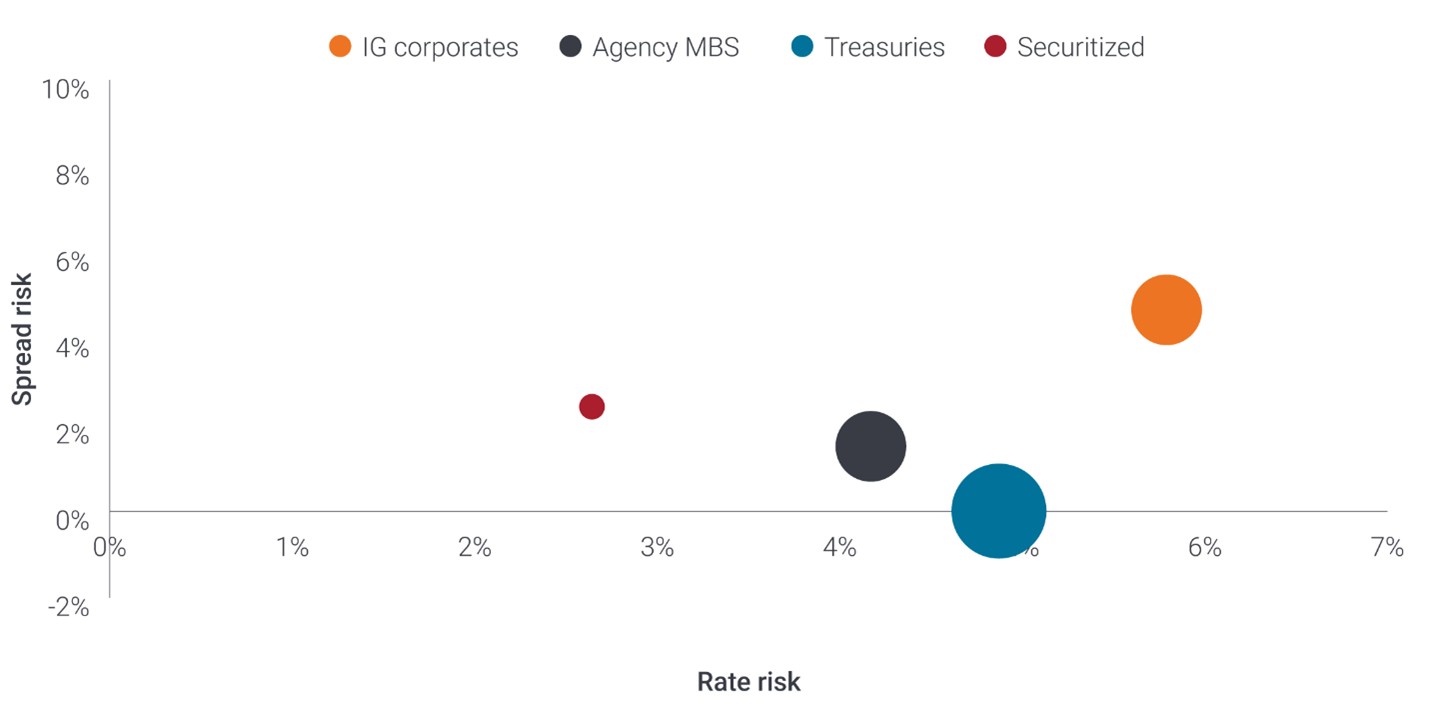
Source: Bloomberg, Janus Henderson Investors, as of 31 January 2026. Rate risk and spread risk based on rate and spread volatility for the 10-year period 31 January 2026. Circle size represents relative market weight. Past performance does not predict future results.
Benchmark indices may not provide adequate exposure to all fixed income markets
More than 97% of the U.S. Agg’s weight is allocated to just three sectors – U.S. Treasuries/Government-related, agency MBS, and investment-grade (IG) corporates. The Global Agg poses a similar concentration issue.
The U.S. and Global Agg exclude large sectors of the fixed income universe, like collateralized loan obligations (CLOs), high-yield corporates, and emerging markets (EM) debt. Further, meaningful segments of securitized credit markets, such as asset-backed securities (ABS) and commercial mortgage-backed securities (CMBS), are underrepresented in the indices relative to their market weight.
Exhibit 2: Benchmark indices are not representative of the market portfolio
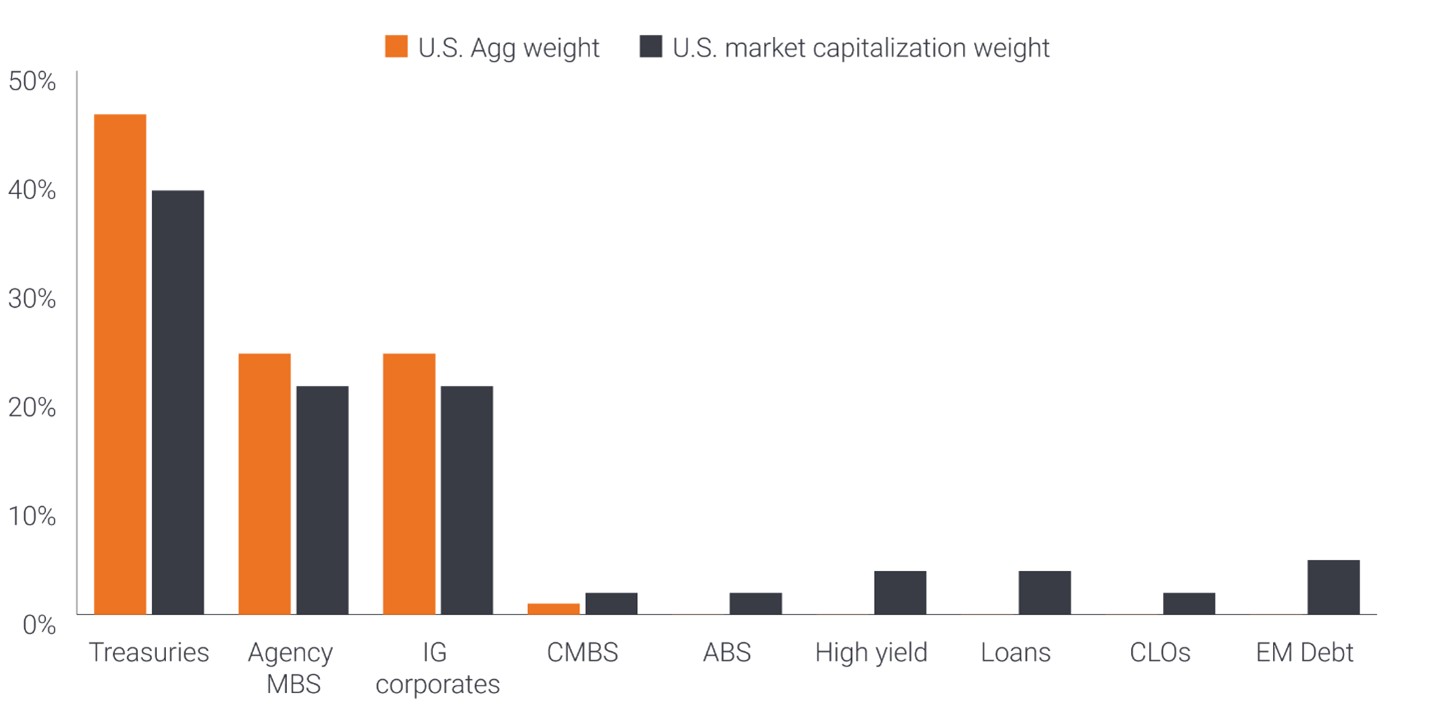
Source: Bloomberg, Janus Henderson Investors, as of 31 January 2026.
The strategic asset allocation as the optimized new home base
As we reflect on the challenges posed by fixed income benchmarks, we set out to build a home base portfolio – or strategic asset allocation (SAA) – to serve as the new starting point.
The objective in building the SAA is to create a more efficient portfolio that better aligns with a client’s goals, and:
1. Has a better overall balance of interest rate risk and credit spread risk.
2. Is better diversified across more sectors that are also less correlated, thereby offering a more accurate reflection of the market portfolio.
3. Focuses its credit spread and interest rate exposures in areas that have historically provided a better risk-return trade off.
Exhibit 3: The fixed income universe comprises many sectors that may be combined to achieve better risk-adjusted outcomes.
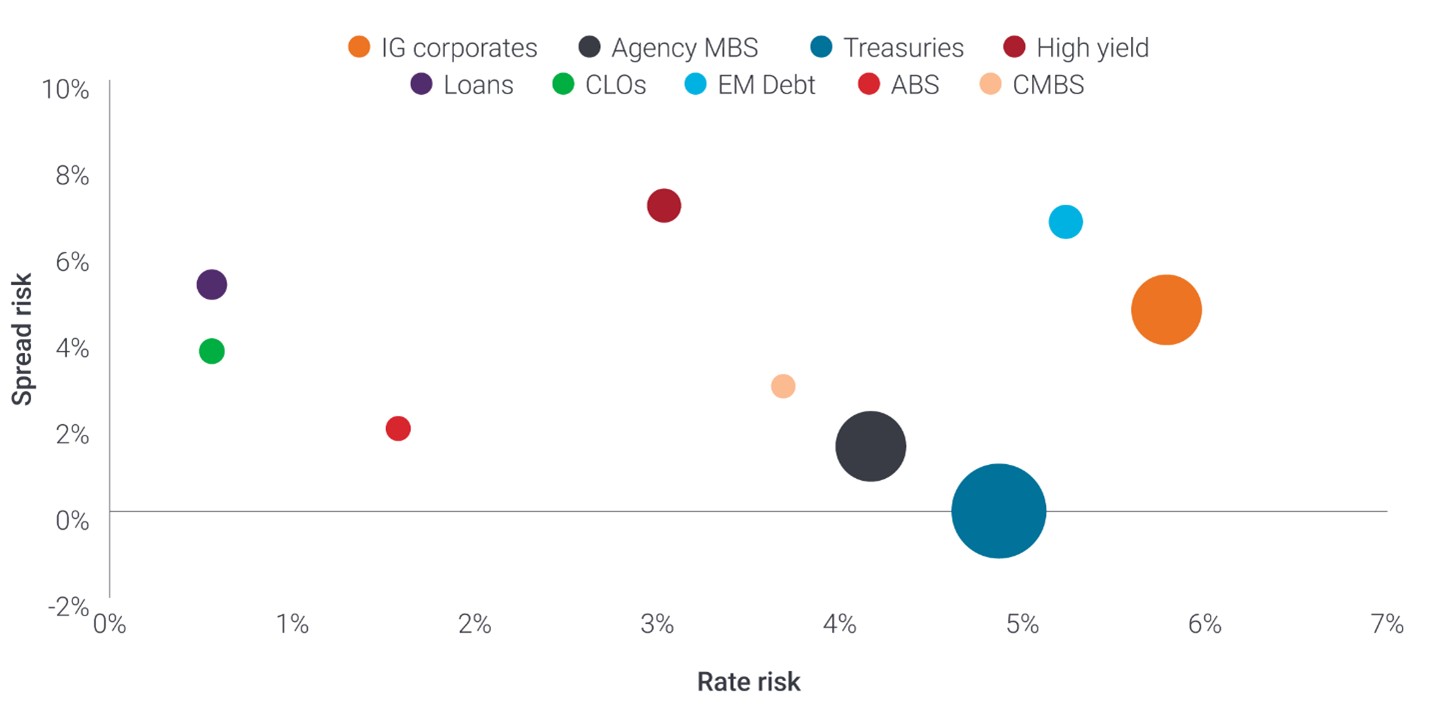
Source: Bloomberg, Janus Henderson Investors, as of 31 January 2026. Rate risk and spread risk based on rate and spread volatility for the 10-year period 31 January 2026. Circle size represents relative market weight. Past performance does not predict future results.
Seeking improved risk-adjusted returns
Over the past 5 years, the Morningstar multi-sector category has outperformed the U.S. Agg by over 3% annualized, with lower volatility. In our view, the outperformance highlights the benefit of having diversified income streams and a better balance of credit-spread and interest-rate risk.
Importantly, Exhibit 4 plots the risk and return for the entire multi-sector peer group. We believe that these results may be further improved by combining the general benefits of a multisector strategy with Janus Henderson’s deep research capabilities and quantitative approach to building optimized portfolios.
Exhibit 4: Multi-sector funds have outperformed the U.S. Agg by over 3% (annualized) over 5 years
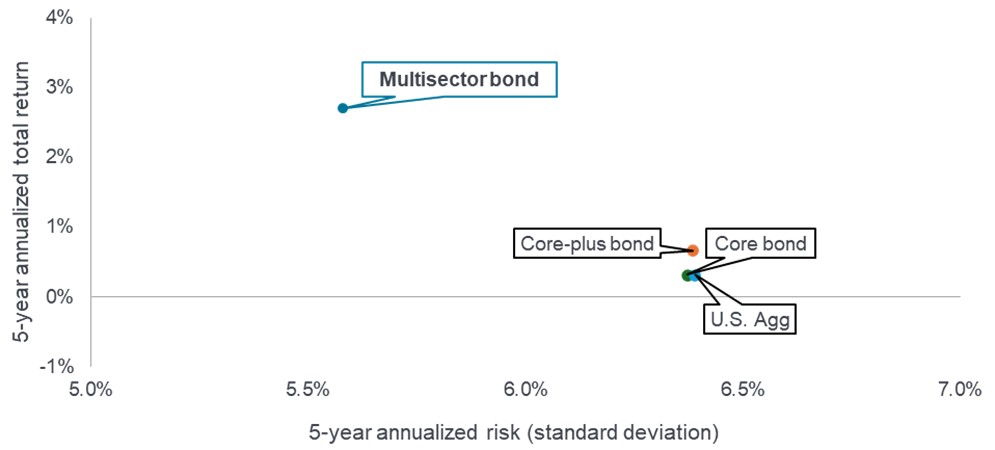
Source: Morningstar, Janus Henderson Investors as of 31 March 2026. Chart represents Morningstar peer group data. Past performance is no guarantee of future returns.
A fully customizable platform
At Janus Henderson, we use a bespoke asset allocation framework across all multi‑sector strategies, including core, core‑plus, multi‑sector, and customized solutions.
The SAA enables tailored client outcomes rather than one‑size‑fits‑all portfolios. It is fully embedded in our portfolio construction process, with risk budgeting, attribution, and daily risk reporting all run relative to the SAA. This integration supports transparency, repeatability, and consistency in decision‑making, ultimately contributing to more reliable portfolio outcomes and returns, in our view.
IMPORTANT INFORMATION
Actively managed portfolios may fail to produce the intended results. No investment strategy can ensure a profit or eliminate the risk of loss.
Diversification neither assures a profit nor eliminates the risk of experiencing investment losses.
Fixed income securities are subject to interest rate, inflation, credit and default risk. The bond market is volatile. As interest rates rise, bond prices usually fall, and vice versa. The return of principal is not guaranteed, and prices may decline if an issuer fails to make timely payments or its credit strength weakens.
Securitized products, such as mortgage-backed securities and asset-backed securities, are more sensitive to interest rate changes, have extension and prepayment risk, and are subject to more credit, valuation and liquidity risk than other fixed-income securities.
Basis point (bp) equals 1/100 of a percentage point. 1 bp = 0.01%, 100 bps = 1%.
The Bloomberg US Aggregate Index is a broad-based flagship benchmark that measures the investment grade, US dollar-denominated, fixed-rate taxable bond market. The index includes Treasuries, government-related and corporate securities, MBS (agency fixed-rate pass-throughs), ABS and CMBS (agency and non-agency).
The Bloomberg Global Aggregate Index is a flagship measure of global investment grade debt from a multitude local currency markets. This multi-currency benchmark includes treasury, government-related, corporate and securitized fixed-rate bonds from both developed and emerging markets issuers.
Correlation measures the degree to which two variables move in relation to each other. A value of 1.0 implies movement in parallel, -1.0 implies movement in opposite directions, and 0.0 implies no relationship.
Credit Spread is the difference in yield between securities with similar maturity but different credit quality. Widening spreads generally indicate deteriorating creditworthiness of corporate borrowers, and narrowing indicate improving.
Credit spread risk is the potential for a financial loss on a debt security due to a widening of the spread (difference in yield) between that security and a risk-free benchmark, such as a U.S. Treasury bond. It represents changes in market value caused by increased market perception of credit risk, distinct from the actual risk of borrower default.
Duration measures a bond price’s sensitivity to changes in interest rates. The longer a bond’s duration, the higher its sensitivity to changes in interest rates and vice versa.
Interest rate risk is the potential for a bond or other fixed-income asset to decline in value when interest rates move in an unfavorable direction.
The Strategic Asset Allocation (SAA) is designed to represent the management style of the strategy and is the starting point for sector allocation decisions. The SAA aligns with the strategy’s objectives and seeks to systematically maximize expected risk-adjusted returns by taking advantage of inefficiencies in the fixed income market and traditional benchmarks. The SAA incorporates objective criteria and proprietary hedging assumptions. The SAA is rebalanced to the neutral allocation monthly and may vary over time with prevailing market conditions. More detail can be provided upon request.
Volatility measures risk using the dispersion of returns for a given investment.
All opinions and estimates in this information are subject to change without notice and are the views of the author at the time of publication. Janus Henderson is not under any obligation to update this information to the extent that it is or becomes out of date or incorrect. The information herein shall not in any way constitute advice or an invitation to invest. It is solely for information purposes and subject to change without notice. This information does not purport to be a comprehensive statement or description of any markets or securities referred to within. Any references to individual securities do not constitute a securities recommendation. Past performance is not indicative of future performance. The value of an investment and the income from it can fall as well as rise and you may not get back the amount originally invested.
Whilst Janus Henderson believe that the information is correct at the date of publication, no warranty or representation is given to this effect and no responsibility can be accepted by Janus Henderson to any end users for any action taken on the basis of this information.