Biotech stocks gain momentum from lower rates, innovation, and M&A
Portfolio Managers Andy Acker and Dan Lyons say after three years of underperformance, the biotech sector is showing signs of a recovery that investors may not want to overlook.


4 minute read
Key takeaways:
- Biotechnology stocks have underperformed the broader market for the last three years, but new drug launches, mergers and acquisitions (M&A), and the potential for lower interest rates could drive a rebound in 2024.
- Historically, biotech recoveries have been substantial, with the sector having realized double-digit gains after significant drawdowns.
- Nevertheless, investors may need to be selective, focusing on firms with promising pipelines and sufficient capital reserves.
The end of 2023 capped three consecutive years of underperformance for the biotechnology sector, with the Nasdaq Biotechnology Index delivering -2% per year compared to 10% per year for the S&P 500® Index. Losses have been worse for the broader S&P Biotechnology Select Industry Index, which includes small- and mid-cap equities, and has returned an annualized -14% over the same period.
This performance stands in sharp contrast to 2020, when low interest rates and excitement about COVID-19 vaccines helped push biotech stocks to new heights. But history shows these drawdowns can take time to run their course (Exhibit 1). The good news: Biotech also has a record of big rebounds, with the sector historically delivering double-digit gains after negative performance. Today, there’s reason to believe a similar recovery could be in the offing.
JHI
Exhibit 1: Biotech and U.S. small-cap equity bear markets
The S&P Biotechnology Select Industry Index’s large share of small- and mid-cap biotech companies could be contributing to the Index’s prolonged pullback.
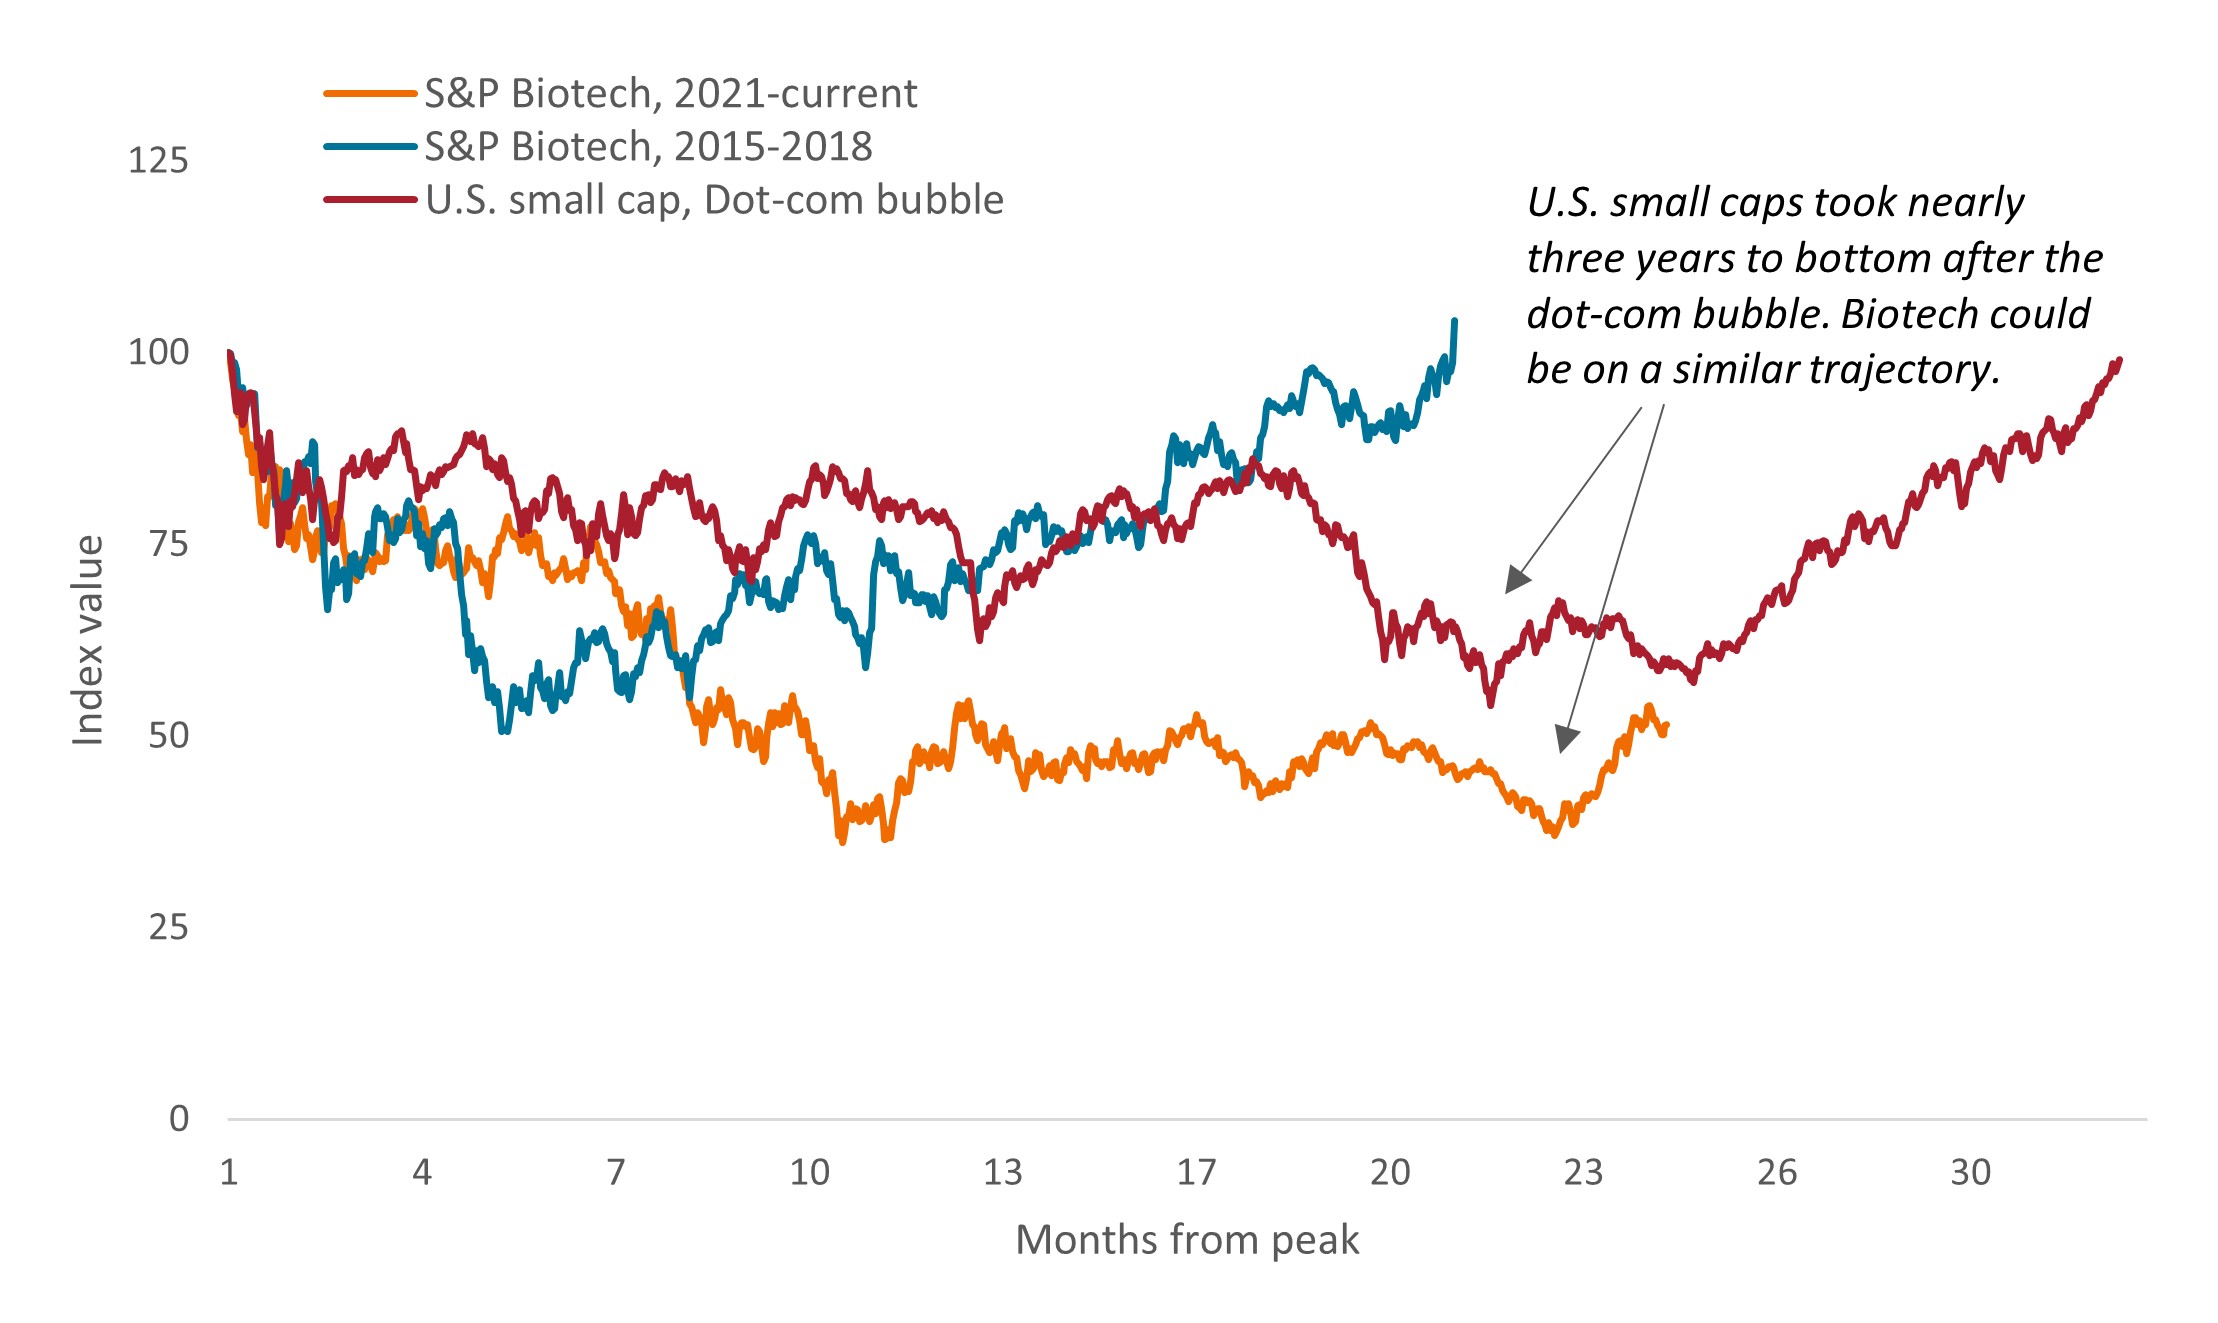
Source: Bloomberg. S&P Biotech, 2021 to current = 8 February 2021 to 23 January 2024; S&P Biotech, 2015-2018 = 17 July 2015 to 22 January 2018; U.S. small cap, Dot-com bubble = 9 March 2000 to 26 January 2004. S&P Biotech = the S&P Biotechnology Select Industry Index. U.S. small cap = Russell 2000 Index, a small-cap U.S. stock market index that makes up the smallest 2,000 stocks in the Russell 3000 Index. Past performance does not predict future returns.
For one, the Federal Reserve (Fed) appears to have ended its campaign of interest rate hikes, and periods of stabilizing or declining rates typically coincide with positive returns for biotech. We saw this relationship begin to play out in the fourth quarter of 2023, with the S&P Biotech Select Index jumping sharply on news the Fed might cut rates in 2024 (Exhibit 2).
Exhibit 2: The rate headwind abates
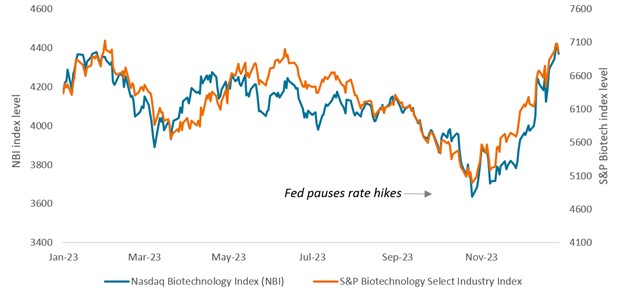
Source: Bloomberg, from 1 January 2023 to 29 December 2023. Past performance does not predict future returns.
At the same time, the sector’s innovation is accelerating. In 2023, the Food and Drug Administration approved a record 73 new therapies. Many of these drugs target large disease categories such as obesity, autoimmune disease, cancer, and Alzheimer’s that represent major new product cycles and could drive revenue growth for the next decade. Furthermore, new drug launches could help offset the earnings drag created by waning COVID-19 product sales, improving investor sentiment toward the sector.
Merger and acquisition (M&A) activity also picked up recently and could maintain momentum. Last year, 22 deals valued at $1 billion or more were announced, double the number in 2022. Nearly half of that M&A occurred in the final three months of the year, spurred in part by the U.S. Federal Trade Commission’s decision to let Amgen complete its $28 billion acquisition of Horizon Therapeutics, removing a regulatory overhang. (The deal was finalized in early October.)
Biopharma companies also face a revenue shortfall as a number of blockbuster1 drugs lose patent protection by the end of the decade. New market opportunities, including GLP-1s (for diabetes and obesity), gene editing, antibody drug conjugates, radiopharma, and cell therapies for cancer and autoimmune diseases could help replace lost revenues. With regulatory headwinds abating, valuations low, and interest rates pulling back, we expect heightened deal activity could continue.
Exhibit 3: M&A volume and deal values doubled in 2023
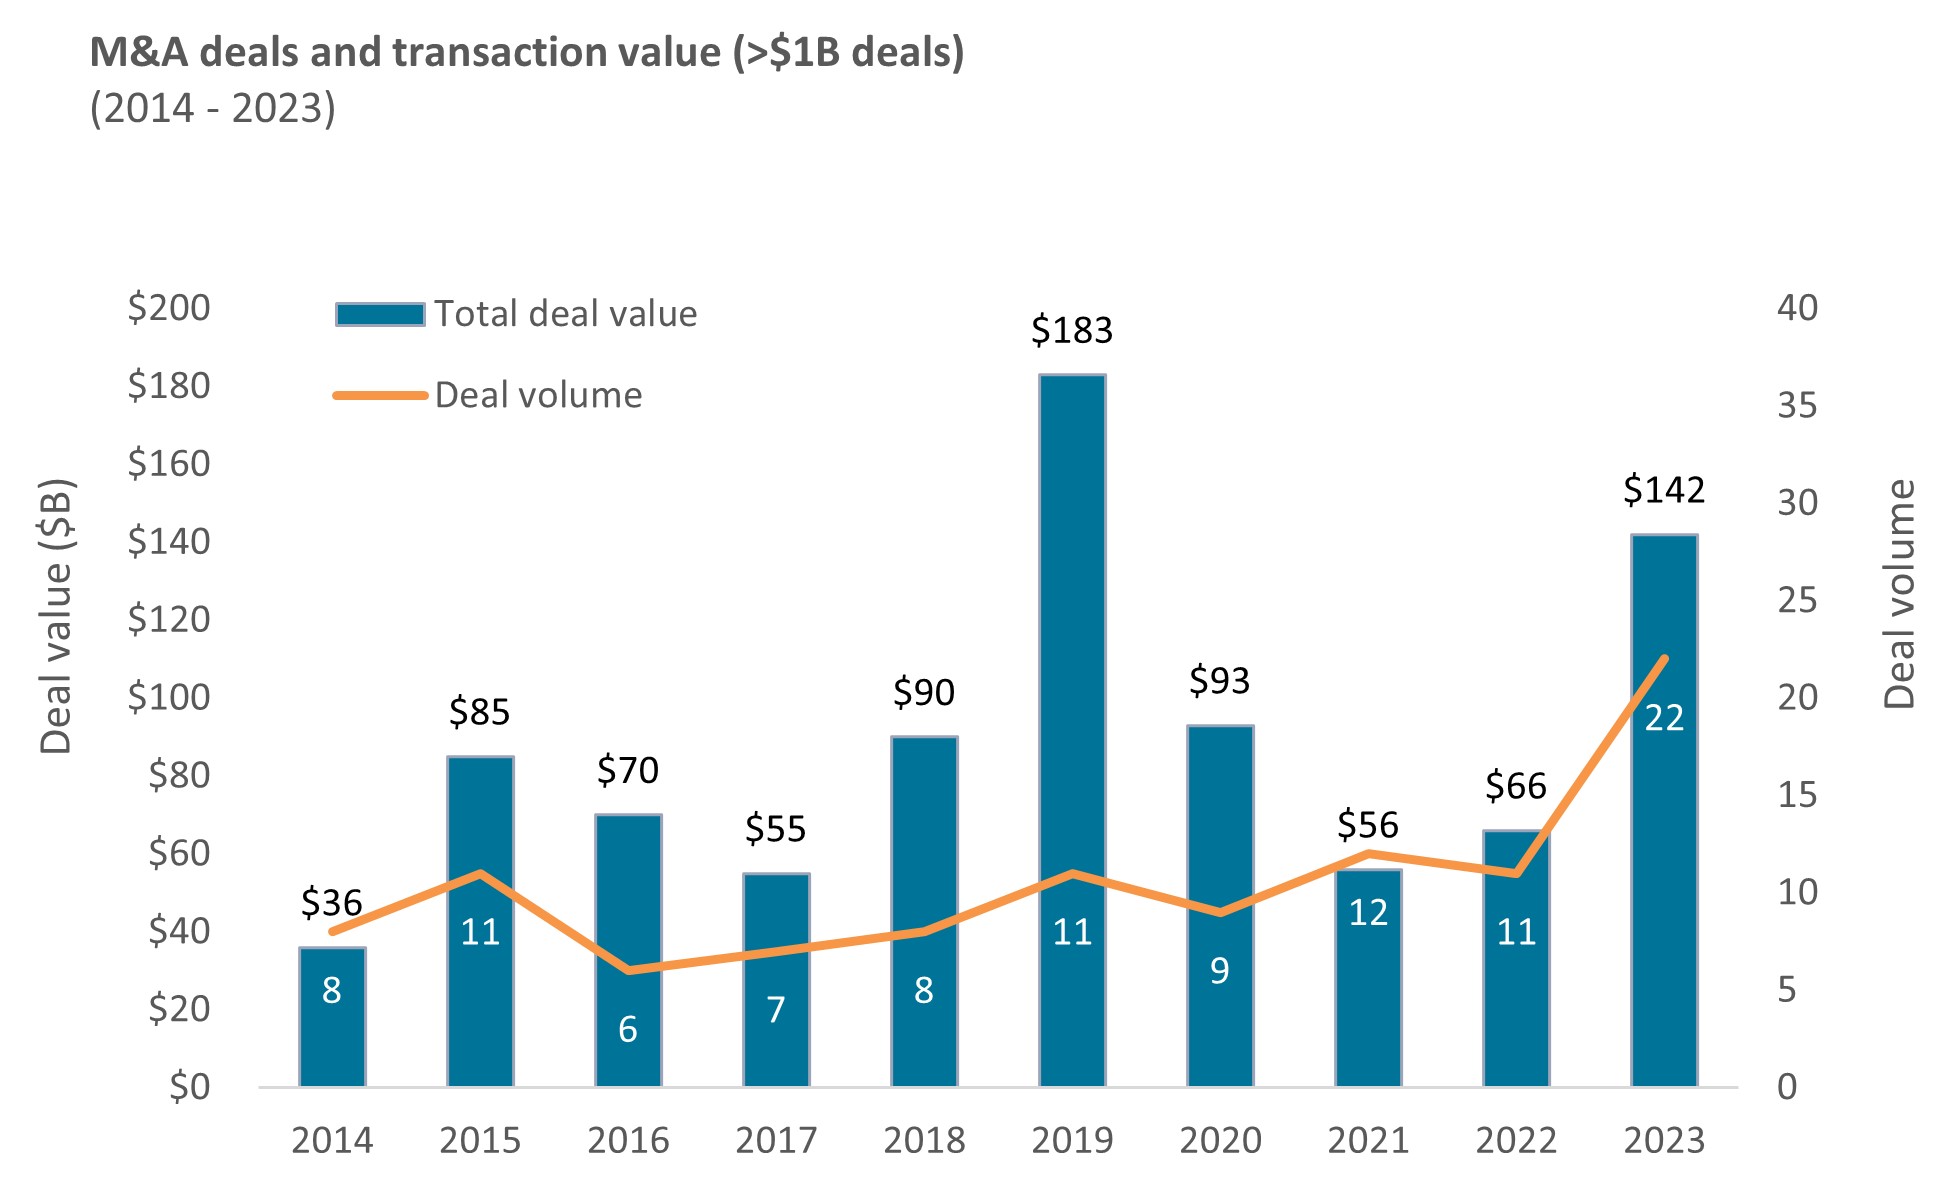
Source: TD Cowen, as of 31 December 2023. Note: Data reflect M&A deals >$1B in transaction value in the biotech sector.
Nevertheless, we do not expect a return to the heady days of the pandemic when biotech stocks could benefit regardless of the quality of a company’s pipeline or balance sheet. Capital markets remain selective, initial public offering activity has yet to rebound, and many firms could face cash shortfalls over the coming 12 to 18 months.
As such, we believe it remains a stock picker’s market – with compelling opportunities available for those investors willing and able to deploy capital in the right opportunities.
IMPORTANT INFORMATION
Health care industries are subject to government regulation and reimbursement rates, as well as government approval of products and services, which could have a significant effect on price and availability, and can be significantly affected by rapid obsolescence and patent expirations.
1 A blockbuster drug has sales of $1 billion or more annually.
S&P 500® Index reflects U.S. large-cap equity performance and represents broad U.S. equity market performance.
The S&P Biotechnology Select Industry Index comprises stocks in the S&P Total Market Index that are classified in the GICS Biotechnology sub-industry.
The NASDAQ Biotechnology Index contains securities of NASDAQ-listed companies classified according to the Industry Classification Benchmark as either Biotechnology or Pharmaceuticals which also meet other eligibility criteria.
This information is issued by Janus Henderson Investors (Australia) Institutional Funds Management Limited (AFSL 444266, ABN 16 165 119 531). The information herein shall not in any way constitute advice or an invitation to invest. It is solely for information purposes and subject to change without notice. This information does not purport to be a comprehensive statement or description of any markets or securities referred to within. Any references to individual securities do not constitute a securities recommendation. Past performance is not indicative of future performance. The value of an investment and the income from it can fall as well as rise and you may not get back the amount originally invested.
Whilst Janus Henderson Investors (Australia) Institutional Funds Management Limited believe that the information is correct at the date of this document, no warranty or representation is given to this effect and no responsibility can be accepted by Janus Henderson Investors (Australia) Institutional Funds Management Limited to any end users for any action taken on the basis of this information. All opinions and estimates in this information are subject to change without notice and are the views of the author at the time of publication. Janus Henderson Investors (Australia) Institutional Funds Management Limited is not under any obligation to update this information to the extent that it is or becomes out of date or incorrect.
4 minute read
Key takeaways:
- Biotechnology stocks have underperformed the broader market for the last three years, but new drug launches, mergers and acquisitions (M&A), and the potential for lower interest rates could drive a rebound in 2024.
- Historically, biotech recoveries have been substantial, with the sector having realized double-digit gains after significant drawdowns.
- Nevertheless, investors may need to be selective, focusing on firms with promising pipelines and sufficient capital reserves.

