Sweating the small stuff – equity repo
Portfolio Managers Natasha Sibley and Jamie Sandells look at the equity repo market, discussing how investors can utilise this increasingly accessible parameter as part of a balanced risk-adjusted allocation to alternatives.


5 minute read
Key takeaways:
- The term-structure dynamic of repo can lead to carry opportunities where an investor can sell long and buy short to ‘earn’ the difference in repo rates.
- The past year has seen dramatic changes in equity repo rates, meaning significant moves in the cost of financing equity futures.
- The repo rate is just a small component of the price of a future, but investors can be well rewarded for focusing on this parameter.
The great draw of alternative investments is their ability to provide investors with a fundamentally different tool set to build their portfolios in an additive way. The potential for greater ‘real’ diversification is the obvious headline benefit, but their use can be tailored to target many different objectives, from hedging against inflation or currency fluctuations, reducing volatility, or simply taking advantage of functional (or opportunistic) needs in the market.
The repo market is one such area of functional need, allowing investors to earn a small return on their cash by lending to parties that own a lot of securities, most commonly for liquidity purposes. While the largest part of the repo market consists of government or corporate bonds, there is an analogous concept in equities. The additional return that holders of physical stocks can get from lending them out (earning borrow rates) is captured in the equity repo rate – this leads to a positive repo rate. However, if the demand for synthetic equity exposure (e.g. futures or swaps) is greater than for physical, this can push the repo rate to be negative. A negative repo rate is equivalent to a positive cost of financing for futures. It is a spread on top of interest rates that captures the relative cost of synthetic versus physical exposure.
Whenever an investor buys a synthetic contract, futures being a common example, the repo rate can be implied from the price by taking account of factors such as the underlying cash equity price, expected dividends and interest rates. When demand for futures is high, the cost of funding rises, and the repo rate becomes negative, to reflect the higher price of the future relative to the underlying cash equity market. Ultimately, the repo rate is a function of the value of providing liquidity and leverage.
The drivers of the equity repo rate vary with the tenor of the instrument:
- Short-term instruments, such as monthly or quarterly expiring futures, are typically driven by directionality from leveraged accounts. Commodity Trading Advisors (CTAs) are an obvious example here – momentum signals in markets can lead CTAs to be buyers or sellers of futures. Enough flow in the same direction can move the repo rate.
- Longer-term instruments are driven by more market-specific flow. In Europe and some Asian markets the prevalence of structured products creates demand for long-dated equity exposure. This means that long-dated equity forwards typically have a higher repo rate than short-dated.
Value for investors
The term-structure dynamic of repo can lead to carry opportunities where an investor can sell long and buy short to ‘earn’ the difference in repo rates. For example, the equity market sell-off in 2022 saw record short positioning in futures markets for the S&P 500 and the EURO STOXX 50. This extreme short positioning meant the repo rate rose – the cost of financing fell. This resulted in the one-year cost of financing (CoF) a future compared to buying the underlying equities moving to decade-long lows (Exhibit 1).
Exhibit 1 – The cost of financing for 1yr EURO STOXX futures fell sharply in late 2022
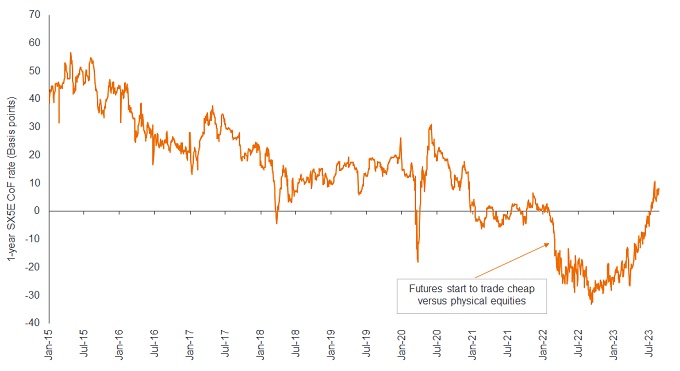
Source: Société Générale data from 2 January 2015 to 22 August 2023. Past performance does not predict future returns.
This situation presented an exceptional opportunity for investors to release cash and make a profit by buying futures rather than the underlying equities. Typically, using leverage has a cost – it is rare indeed to be paid to create the optionality of releasing cash.
As market positioning turned, this dynamic reversed sharply in 2023. This was particularly visible in the S&P 500, where the rapid reversal of the short-term rate caused a spike in the longer part of the term structure (Exhibit 2). This has meant that investors have been paid well to provide long-dated synthetic S&P 500 exposure.
Exhibit 2: The cost of financing longer-dated S&P 500 Index futures rose in 2023
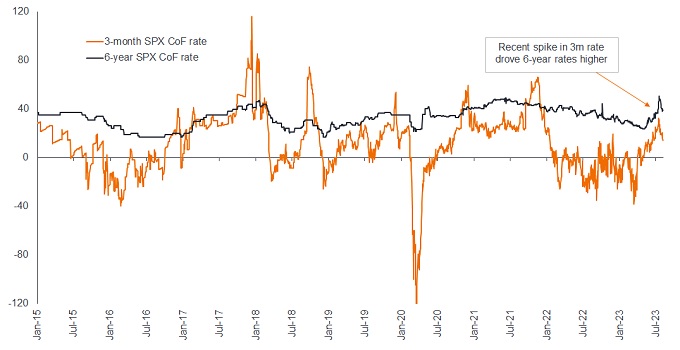
Source: Société Générale, data from 2 January 2015 to 22 August 2023. Past performance does not predict future returns.
The repo market is driven by multiple factors, and has historically seen periods of significant volatility, creating opportunities on both the buy and sell-sides. But these trades, like all others, are not without risk. If the repo spread priced into a longer-dated contract moves further against you, then the carry trade faces the risk of a mark-to-market loss. Similarly, the need to roll the short-dated leg against the long-leg to offset equity exposure means the position is exposed to changes in the short-dated rate, which can eat into the profits from the long leg – and in the worst scenario overtaking them.
Despite these risks, the volatility of such a carry trade is low. Although the repo rate is just a small component of the price of a future, investors can be well rewarded for focusing on this parameter. It has paid historically to ‘sweat the small stuff’.
| Alternatives have benefited from a wave of innovation in the equity repo space. Back in 2016, for example, Eurex (one of the largest futures and options exchanges in the world) launched a listed solution for trading the implied equity repo rate: Total Return Futures (TRFs) on the EURO STOXX 50 Index. The standardisation of a listed contract in the equity repo space eliminated the need for novation, reduced counterparty credit risk and made active trading much simpler. |
Important information
Carry is the excess income earned from holding a higher yielding security relative to another.
Diversification neither assures a profit nor eliminates the risk of experiencing investment losses.
S&P 500® Index reflects U.S. large-cap equity performance and represents broad U.S. equity market performance.
EURO STOXX 50® Index provides a blue-chip representation of supersector leaders in the euro zone. The index covers 50 stocks from 11 euro zone countries: Austria, Belgium, Finland, France, Germany, Ireland, Italy, Luxembourg, the Netherlands, Portugal and Spain.
This information is issued by Janus Henderson Investors (Australia) Institutional Funds Management Limited (AFSL 444266, ABN 16 165 119 531). The information herein shall not in any way constitute advice or an invitation to invest. It is solely for information purposes and subject to change without notice. This information does not purport to be a comprehensive statement or description of any markets or securities referred to within. Any references to individual securities do not constitute a securities recommendation. Past performance is not indicative of future performance. The value of an investment and the income from it can fall as well as rise and you may not get back the amount originally invested.
Whilst Janus Henderson Investors (Australia) Institutional Funds Management Limited believe that the information is correct at the date of this document, no warranty or representation is given to this effect and no responsibility can be accepted by Janus Henderson Investors (Australia) Institutional Funds Management Limited to any end users for any action taken on the basis of this information. All opinions and estimates in this information are subject to change without notice and are the views of the author at the time of publication. Janus Henderson Investors (Australia) Institutional Funds Management Limited is not under any obligation to update this information to the extent that it is or becomes out of date or incorrect.
5 minute read
Key takeaways:
- The term-structure dynamic of repo can lead to carry opportunities where an investor can sell long and buy short to ‘earn’ the difference in repo rates.
- The past year has seen dramatic changes in equity repo rates, meaning significant moves in the cost of financing equity futures.
- The repo rate is just a small component of the price of a future, but investors can be well rewarded for focusing on this parameter.