Chart to Watch: Maximizing income per unit of risk amid higher-for-longer rates
In recent years, the Bloomberg U.S. Aggregate Bond Index (U.S. Agg) has become a proverbial one-trick pony: With 97% of its weighting in just three longer-duration, lower-spread sectors, it is disproportionately skewed toward a high degree of interest-rate, or duration, risk. And in contrast to many securitized credit sectors, the U.S. Agg captures very little credit spread income relative to its duration.
The chart below maps out yield to worst (YTW) versus duration risk across major U.S. fixed income sectors. With the Federal Reserve (Fed) on pause, this landscape takes on new significance for portfolio positioning.
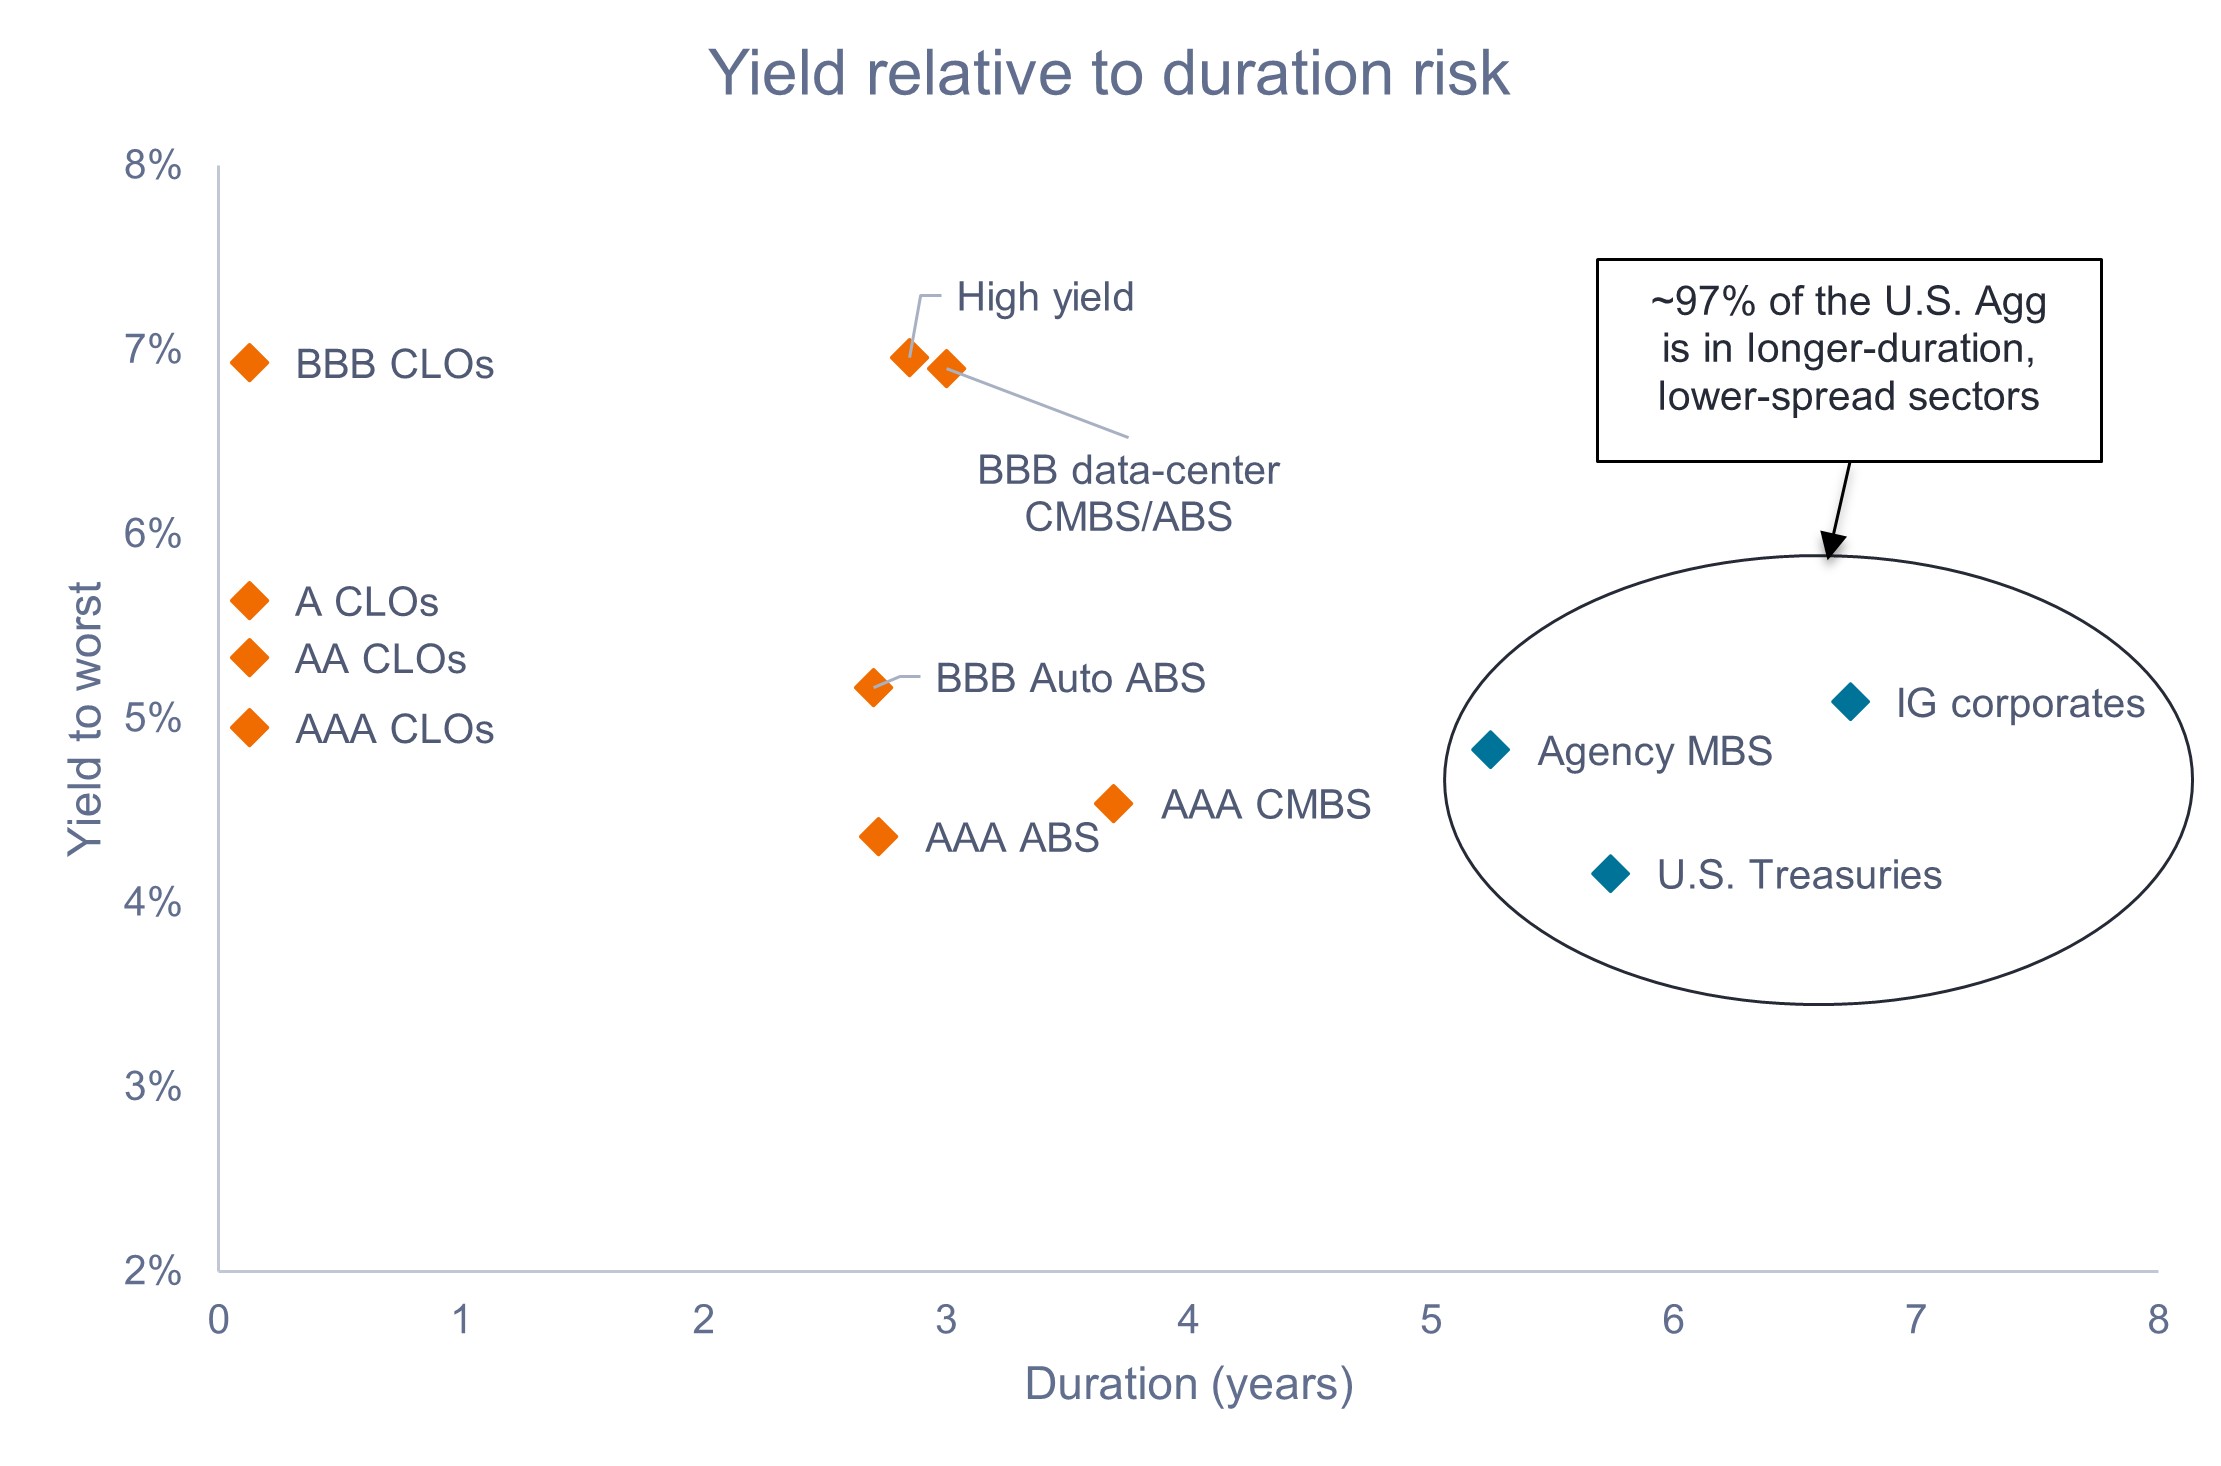
Source: Bloomberg, J.P. Morgan, Janus Henderson Investors, as of 28 April 2026. CLO sectors represented by JP Morgan CLOIE indices. U.S. Treasuries, agency mortgage-backed securities (MBS), IG corporates, asset-backed securities (ABS), commercial mortgage-backed securities (CMBS), and high yield represented by relevant Bloomberg indices. Data-center CMBS/ABS represented by indicative market pricing. Past performance does not predict future results.
Against a backdrop of heightened uncertainty and dispersion, we prioritize selective risk taking and security selection over macro calls or broad beta exposure. The $6 trillion U.S. securitized market ($15 trillion if you include agency MBS) is, in our view, an indispensable toolbox to help investors navigate the fixed income landscape and optimize income per unit of risk. – John Kerschner, Global Head of Securitised Products
Key Takeaways
- With the Fed currently on hold amid the uptick in inflation due to higher energy prices, we believe staying up in credit quality near the front end of the yield curve may offer attractive income with limited rate sensitivity.
- In our view, optimizing income per unit of duration may enhance return consistency and reduce portfolio volatility.
- Given their inherently low duration, attractive spread income, and strong credit quality, we believe securitized credit sectors may combine to help investors maximize income per unit of risk by better balancing duration and credit spread exposure.
IMPORTANT INFORMATION
Actively managed portfolios may fail to produce the intended results. No investment strategy can ensure a profit or eliminate the risk of loss.
Fixed income securities are subject to interest rate, inflation, credit and default risk. The bond market is volatile. As interest rates rise, bond prices usually fall, and vice versa. The return of principal is not guaranteed, and prices may decline if an issuer fails to make timely payments or its credit strength weakens.
High-yield or “junk” bonds involve a greater risk of default and price volatility and can experience sudden and sharp price swings.
Securitized products, such as mortgage- and asset-backed securities, are more sensitive to interest rate changes, have extension and prepayment risk, and are subject to more credit, valuation and liquidity risk than other fixed-income securities.
The Bloomberg U.S. Aggregate Bond Index is a broad-based flagship benchmark that measures the investment grade, US dollar-denominated, fixed-rate taxable bond market.
Credit quality ratings are measured on a scale that generally ranges from AAA (highest) to D (lowest).
A credit spread refers to the difference in yield between two bonds of similar maturity but different credit quality. It acts as a market indicator of credit risk—widening when risk rises and narrowing when it drops—and is typically measured in basis points.
Duration measures a bond’s price sensitivity to interest rate changes, expressed in years. A higher duration means greater price volatility when rates move.
Volatility measures risk using the dispersion of returns for a given investment.
A yield curve is a line that plots the yields, or interest rates, of bonds that have equal credit quality but different maturity dates.
Yield to Worst (YTW) is a bond analysis metric calculating the lowest potential yield an investor can receive on a callable bond without the issuer defaulting. It assumes the bond is paid off at the earliest date allowed by its terms, such as through a call or early redemption.