
Key takeaways:
- Financial markets are being shaped by a higher risk/higher reward mentality; we believe investors may be better served by focusing on less speculative assets.
- Sentiment is beginning to shift toward our non-consensus view from the start of the year that interest rates would not fall as anticipated. Reduced liquidity typically signals the end of speculative periods and a renewed focus on fundamentals.
- Against this backdrop, we favor “boring” investments including dividend-paying stocks, non-U.S. equities, and short-term, high-quality fixed income, which is less susceptible to rising rates.
The financial markets and the betting markets serve vastly different purposes within the economy, but at the mid-point of 2026, it seems clear that there is abnormal speculation in the current economy, because investors are equating the two. In our view, investors would be better served sticking to fundamentals and leaving chance to the betting community.
The financial markets exist for capital formation. Investors take ownership positions in companies or lend to companies, which lowers those companies’ cost of capital and fuels capital investment and employment. The betting markets serve no similar value-added purpose to the broader economy; participants simply wager on an outcome.
Exhibit 1 suggests that total options volume reflects the increasingly speculative nature of the financial markets. The embedded leverage within options provides investors with a higher-risk/higher-return method to potentially increase stock returns. Despite the increased risk of using options, trading volume has more than tripled in the last five years.
Given the speculative backdrop, our 2026 outlook was titled “Boring is Beautiful” and advocated for positions in dividend-paying stocks, non-U.S. stocks, shorter-term higher-quality fixed income, and gold.
Exhibit 1: Spiraling options volumes illustrate the increasingly speculative nature of markets
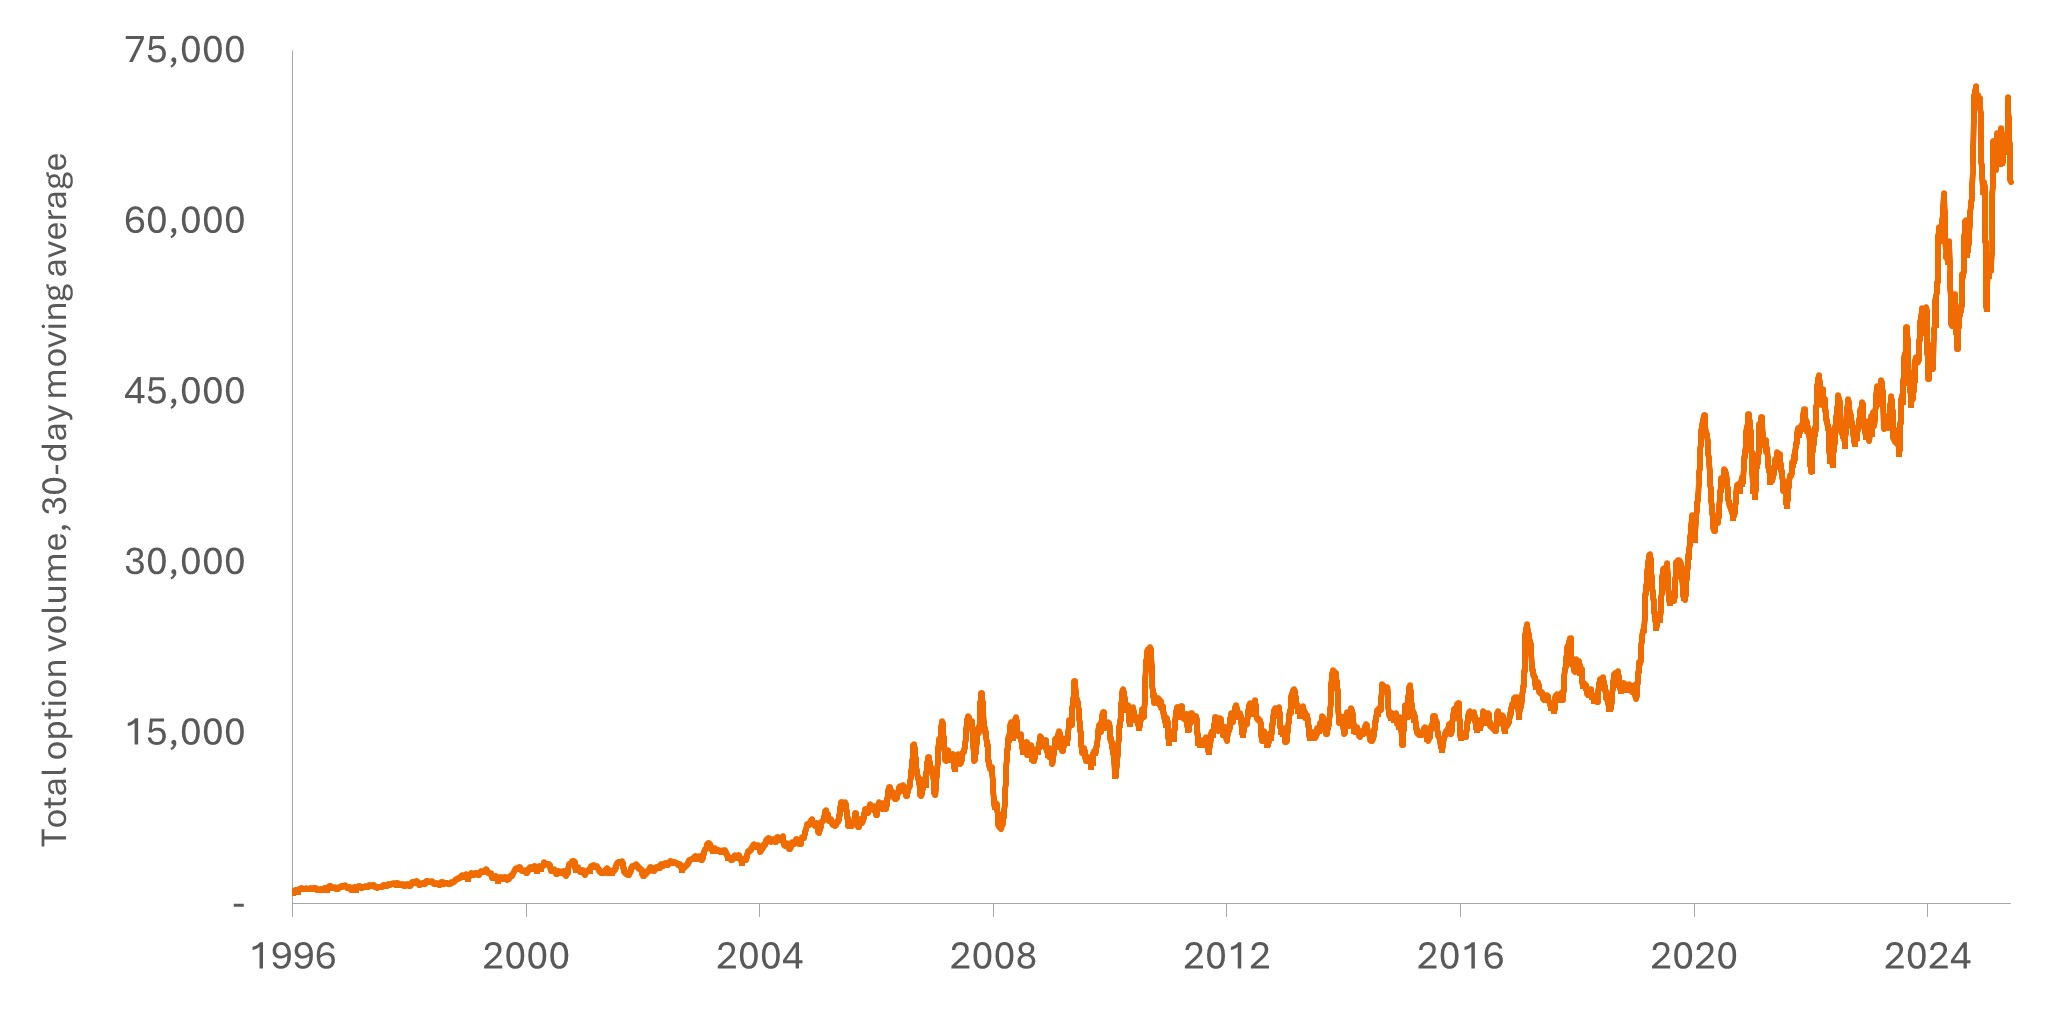
Source: Bloomberg, as at 31 May 2026.
Investors are reassessing the Fed
One of our primary assumptions at the beginning of the year was that the U.S. Federal Reserve (Fed) would not be able to cut rates as rapidly or as demonstrably as was consensus. In fact, we thought there was a probability that the Fed would need to shift course and increase rates.
That out-of-consensus view is apparently becoming more mainstream. Exhibit 2 shows the futures market’s forecast for the federal funds rate. At the end of 2025 (amber line) the markets were predicting the fed funds rate would be lowered during 2026 and would not get back to current levels until 2030. The current view (white line) anticipates much higher rates, with only a small rate cut anticipated this summer and rates following a decidedly upward trajectory over the next five years.
Exhibit 2: A markedly different interest-rate path compared to the beginning of the year
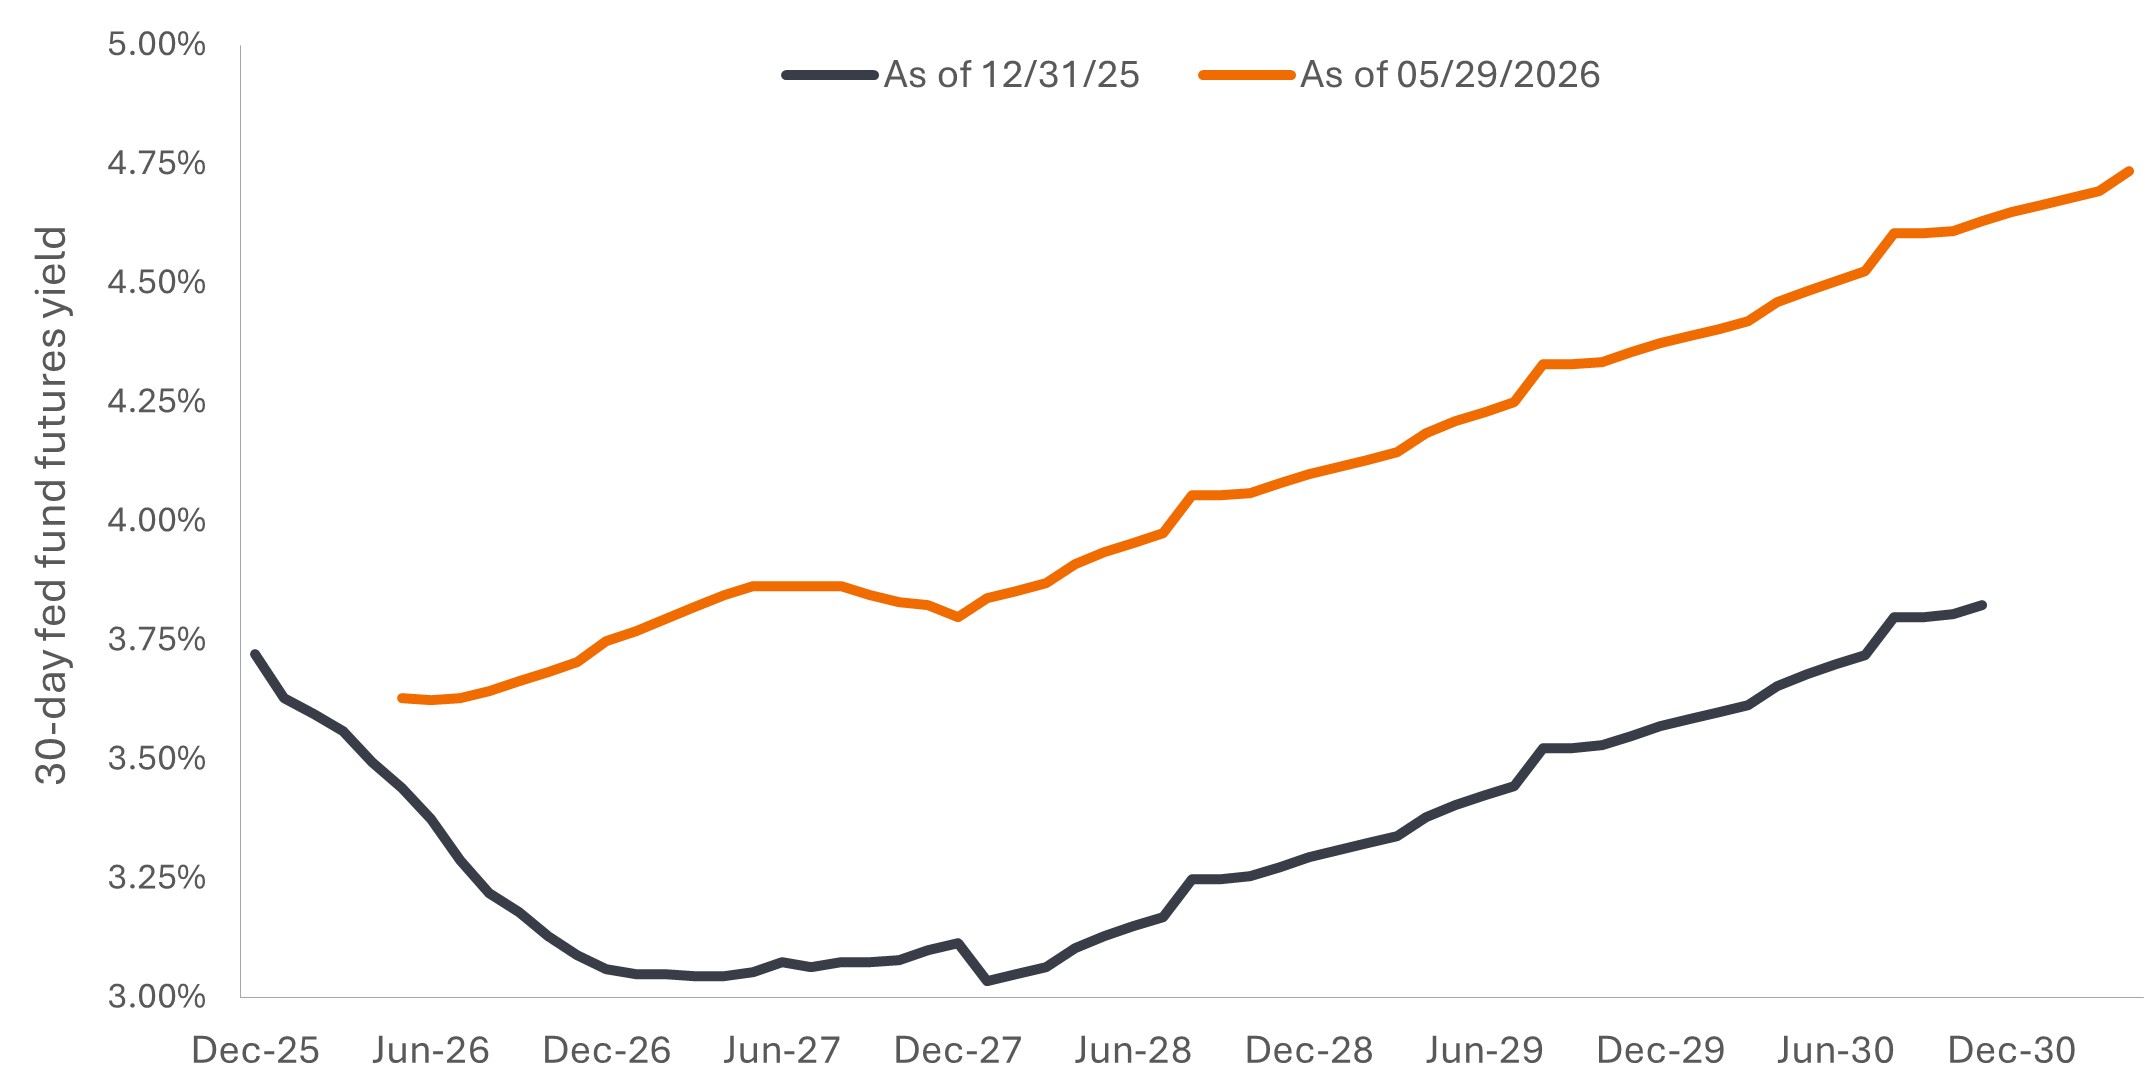
Source: Bloomberg, as at 31 May 2026.
The near-term optimism regarding a potential rate cut might still be too optimistic. Exhibit 3 shows our simple real-time measure of Nominal Gross Domestic Product (GDP) (real GDP plus inflation) incorporating the Atlanta Fed’s GDPNow forecast and one-year inflation breakevens. The bars in the chart represent actual Nominal GDP as was reported.
The nominal U.S. economic growth has been extraordinarily strong. Nominal GDP in the third quarter of 2025 was over 8%, which was, when excluding the pandemic and post-pandemic period, the first 8% nominal GDP quarter in roughly 20 years. The fourth quarter was slower because of the government shutdown, but first-quarter 2026 nominal GDP was greater than 5.5%, and the current quarter is so far tracking back above 7%.
We continue to believe that such strong nominal growth will limit the Fed’s flexibility, that they will gradually shift toward a tightening bias, and that they could actually raise rates.
Exhibit 3: U.S. economic growth remains extraordinarily strong
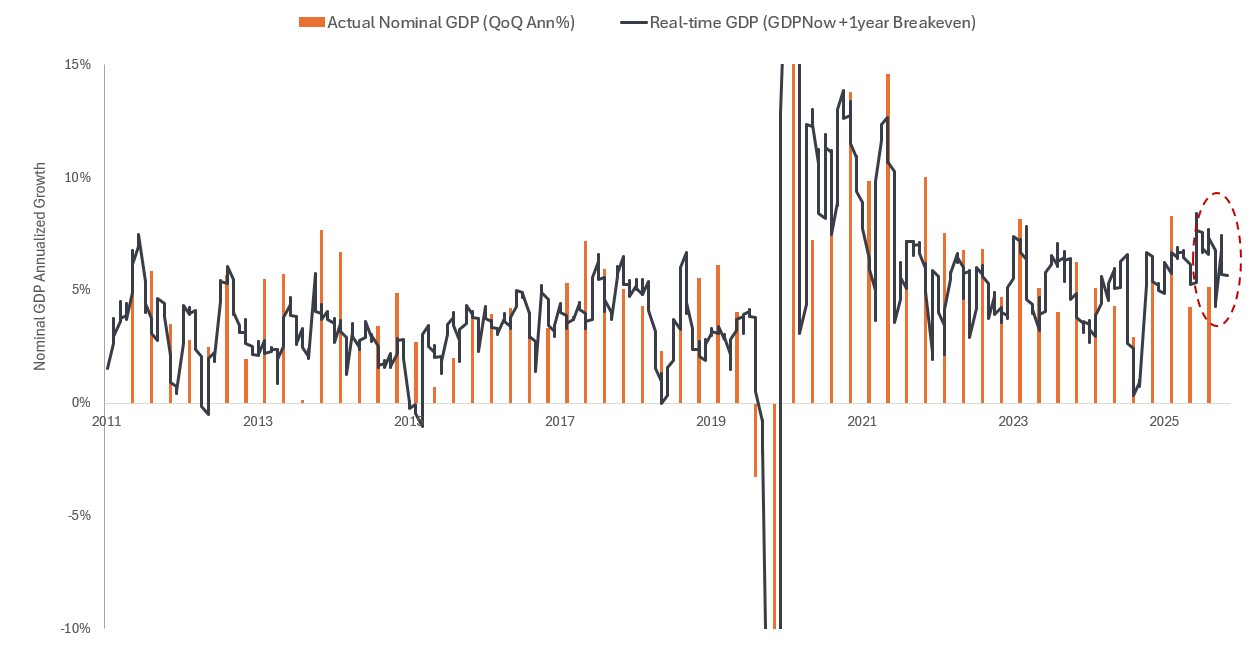
Source: Bloomberg, as at 31 May 2026.
Fundamentals matter more when liquidity dries up
Liquidity has historically been the lifeblood of speculation, and highly speculative periods tend to end when the Fed raises rates. History also indicates that when liquidity dissipates, investors focus more on fundamentals than on recent stock performance and momentum.
Exhibit 4 compares the fundamentals of major equity categories. It shows expected total return (defined as earnings growth plus dividend yield) versus valuation. Categories toward the lower left are viewed as more attractive, whereas those toward the upper right are less attractive.
Equity market segments such as dividends and non-U.S. stocks appear much more attractive than the consensus favorite, the so-called Magnificent 7 (Mag 7) stocks, or the broader Technology sector.
Chart 4: Opportunities beyond the Mag 7 and Tech
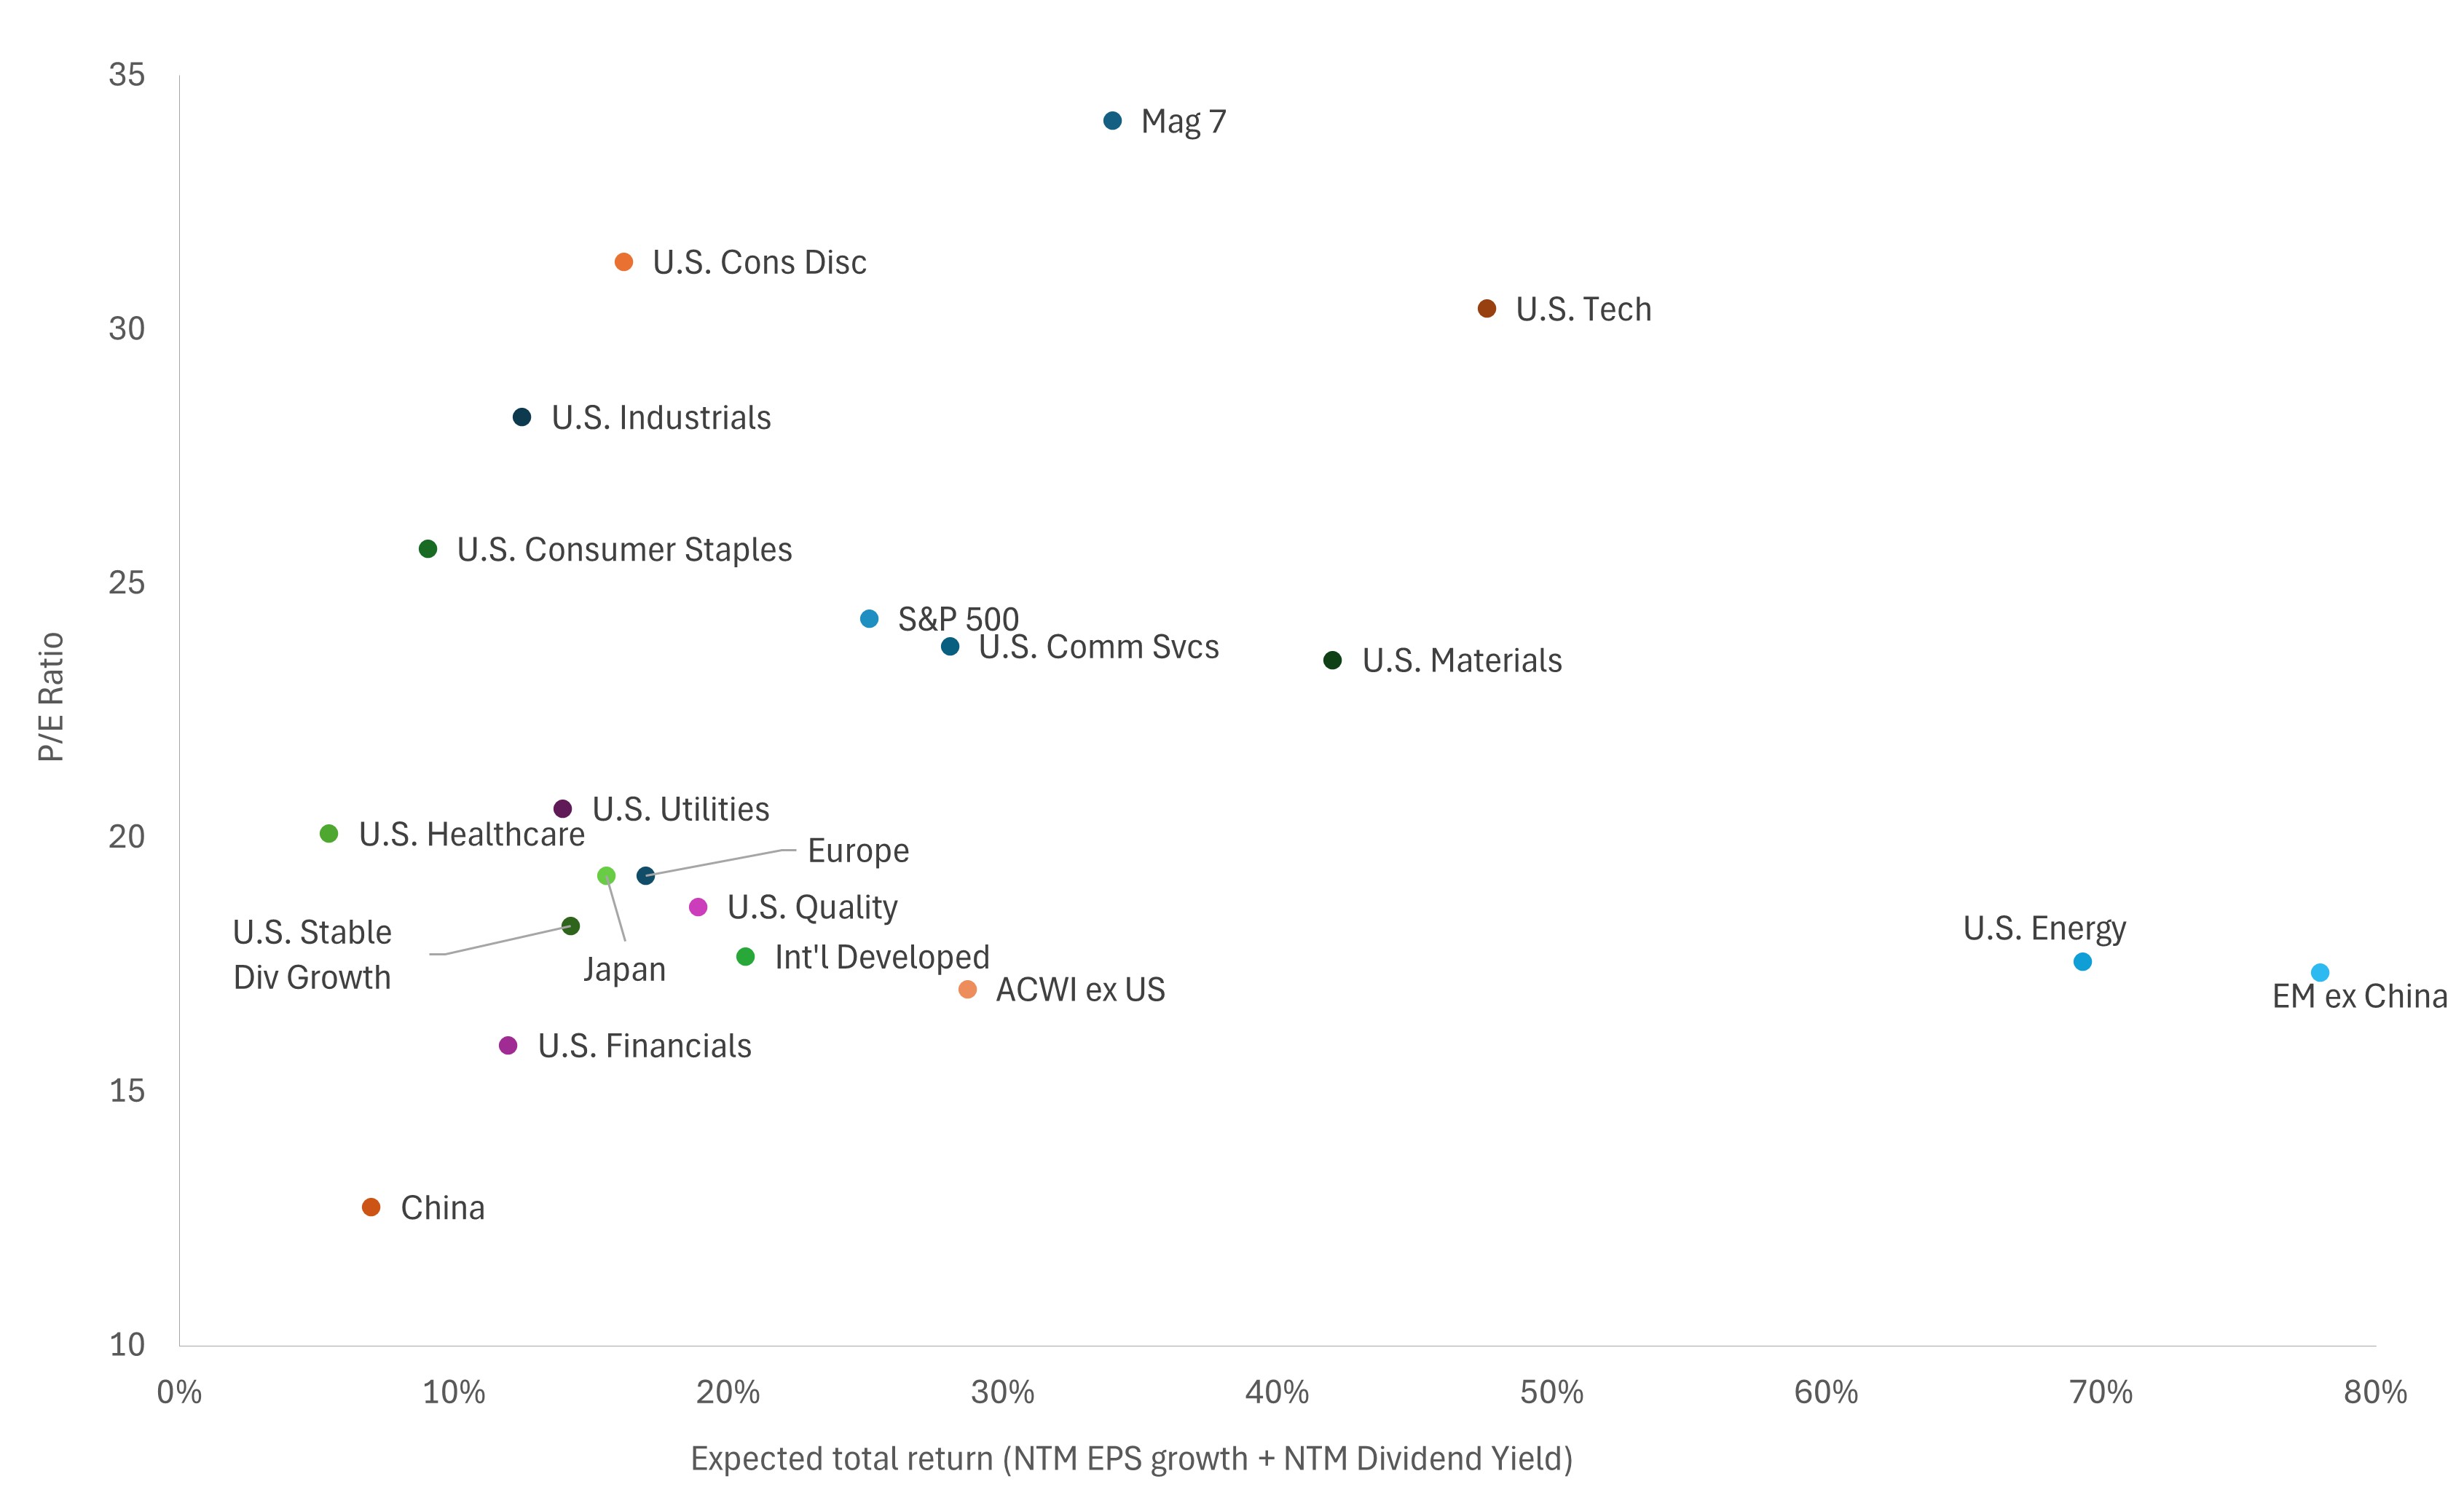
Source: Richard Bernstein Advisors LLC, MSCI, S&P Global, Bloomberg Finance L.P., as at 31 May 2026. NTM = Next twelve months. Sectors are defined as S&P 500® GICS Sectors. U.S. Quality: MSCI USA Sector Neutral Quality Index measures the performance of U.S. large- and mid-capitalization stocks exhibiting relatively higher quality characteristics as identified through three fundamental variables: Return on equity, earnings variability, and debt-to-equity. U.S. Stable Div Growth: S&P High Yield Dividend Aristocrats Index. The index measures the performance of the highest dividend yielding S&P Composite 1500 Index constituents that have followed a managed-dividends policy consistently increasing dividends every year for at least 20 consecutive years.
Not a time for credit risk
Most investors are aware that higher returns generally involve taking more risk, and our research over the past 35 years strongly suggests that lower-quality investments, both equities and fixed income, provide higher longer-term returns. However, entry points are very important.
Investing when equity valuation is very high or fixed-income spreads are very narrow implies that risk premia are too small. In other words, an investor is not being compensated for the investment’s risk, and the probability of an investment underperforming is greater.
Exhibit 5 highlights the narrowness of today’s high-yield corporate credit spreads. In fact, spreads have been narrower than they are today only twice in the last 30 years, and major credit events followed each occurrence. Given that history, we continue to focus on shorter-term, higher-quality fixed income such as municipals, Treasuries, and mortgages.
With nominal growth being stronger than investors currently expect and the Fed’s potential inability to lower rates, fixed income investors may be best served by maintaining duration at lower levels than those of the benchmark.
Exhibit 5: High-yield corporate credit spreads have only been this narrow twice before
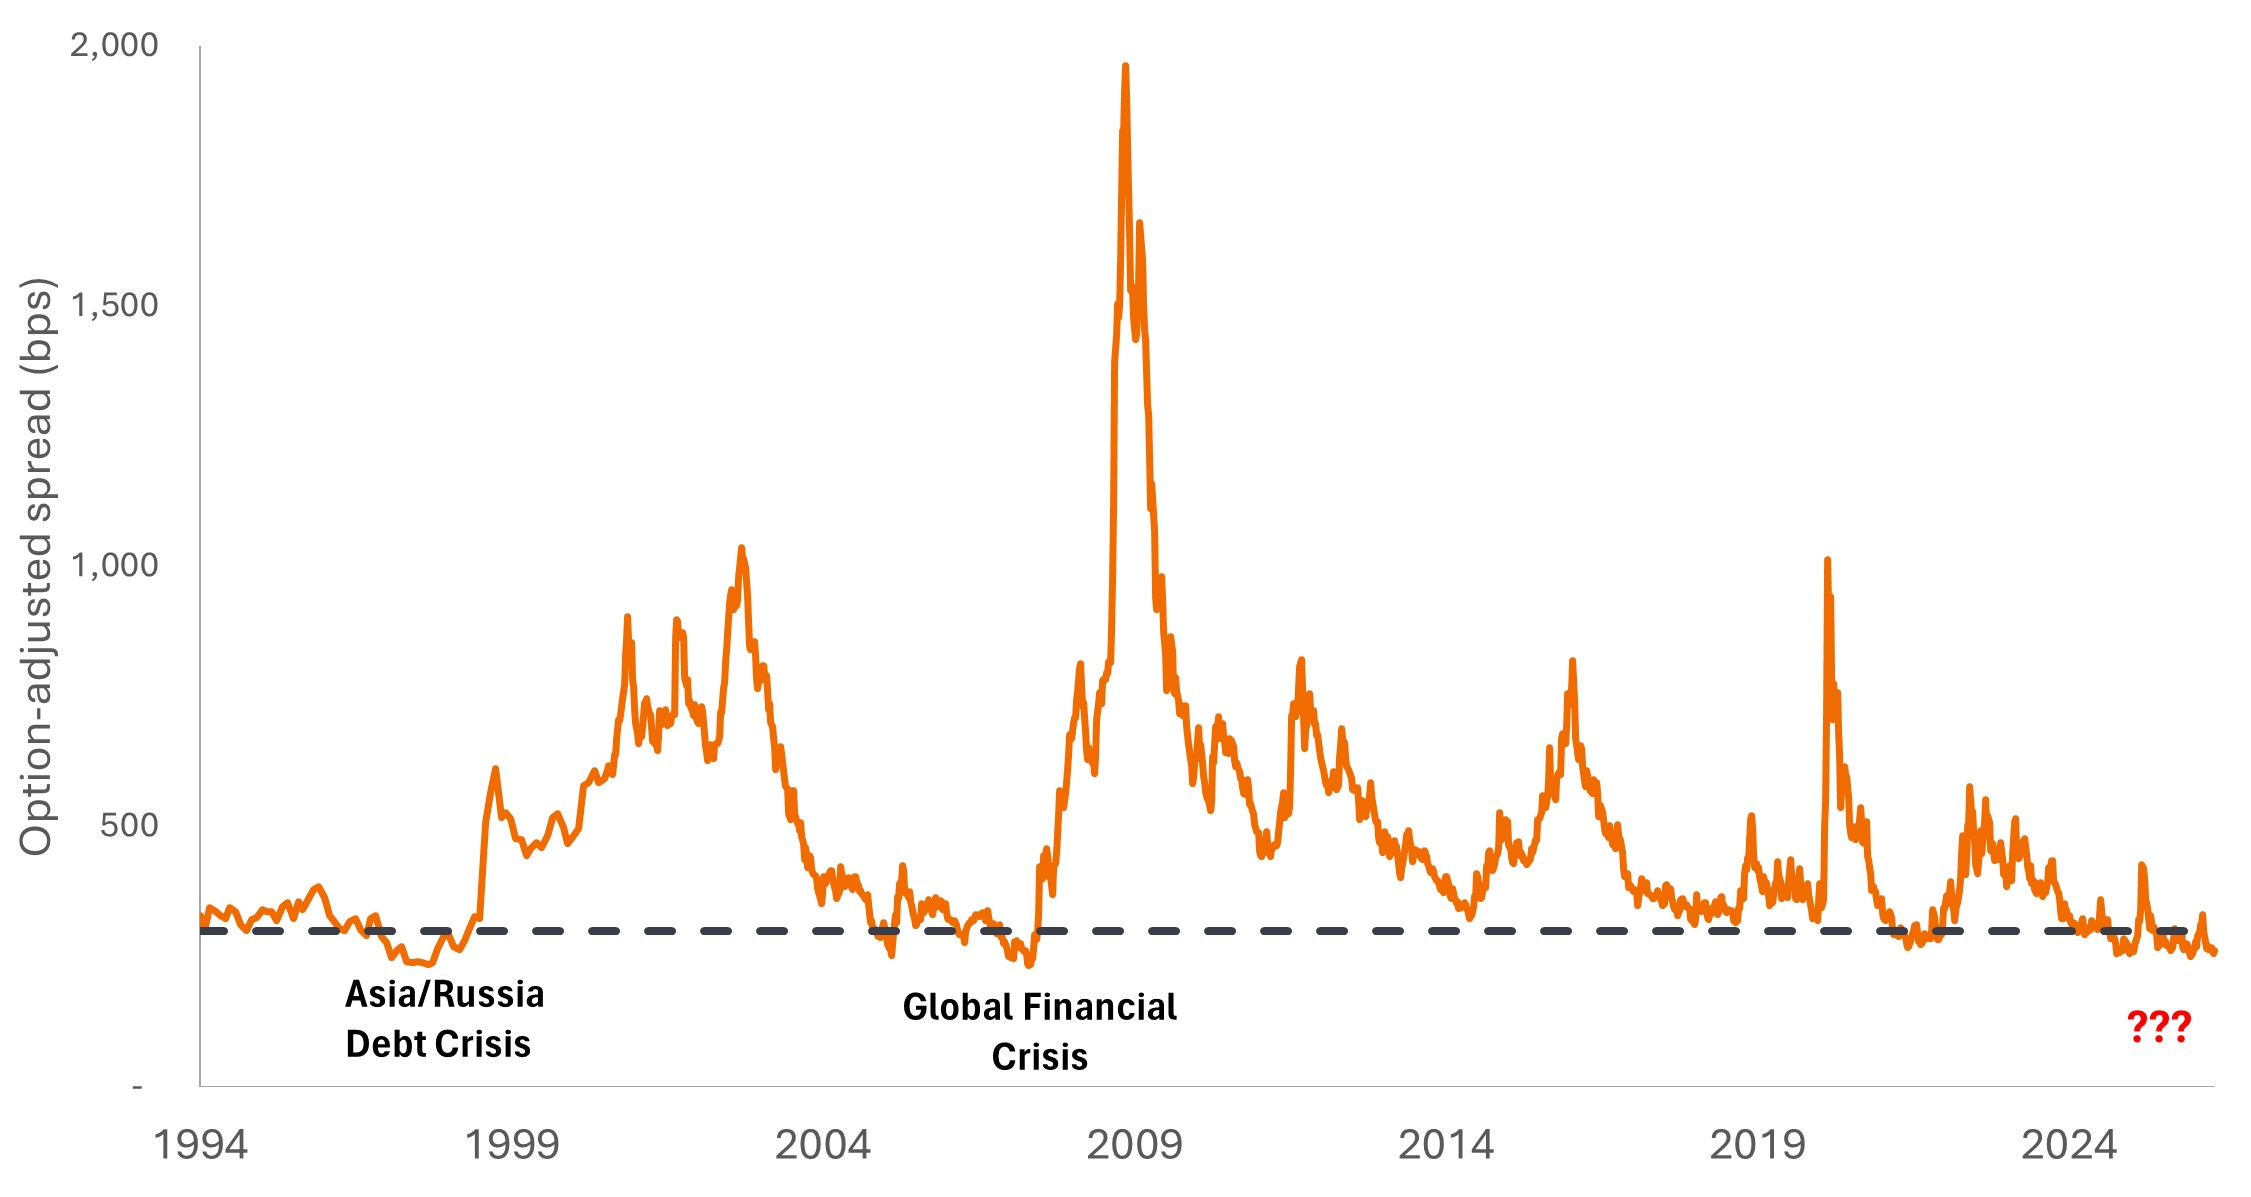
Source: Bloomberg, as at 31 May 2026.
Boring remains beautiful
Investors’ risk preferences historically swing back and forth from very cautious risk aversion to wild risk taking. At the beginning of the bull market, investors would only invest in quality dividend-bearing stocks and Treasuries. Today, when the lines are blurred between capital markets and prediction markets, no level of equity or fixed income risk seems to satisfy gambling cravings.
Instead of following the risk-taking herd, we are sticking to the fundamentals that continue to suggest boring investments are quite attractive. Dividends, non-U.S. equities, and short-term quality fixed income continue to form the basis of our allocations for the second half of 2026.
IMPORTANT INFORMATION
Equity securities are subject to risks including market risk. Returns will fluctuate in response to issuer, political and economic developments.
Fixed income securities are subject to interest rate, inflation, credit and default risk. As interest rates rise, bond prices usually fall, and vice versa. High-yield bonds, or “junk” bonds, involve a greater risk of default and price volatility. Foreign securities, including sovereign debt, are subject to currency fluctuations, political and economic uncertainty and increased volatility and lower liquidity, all of which are magnified in emerging markets.
High-yield or “junk” bonds involve a greater risk of default and price volatility and can experience sudden and sharp price swings.
Basis point (bp) equals 1/100 of a percentage point. 1 bp = 0.01%, 100 bps = 1%.
Bloomberg U.S. Corporate High Yield Bond Index measures the US dollar-denominated, high yield, fixed-rate corporate bond market.
Credit spread: The difference in yield between securities with similar maturity but different credit quality. Widening spreads generally indicate deteriorating creditworthiness of corporate borrowers, and narrowing indicate improving.
Credit spread risk is the potential for a financial loss on a debt security due to a widening of the spread (difference in yield) between that security and a risk-free benchmark, such as a U.S. Treasury bond. It represents changes in market value caused by increased market perception of credit risk, distinct from the actual risk of borrower default.
Dividend Yield is the weighted average dividend yield of the securities in the portfolio (including cash). The number is not intended to demonstrate income earned or distributions made by the portfolio.
Duration measures a bond price’s sensitivity to changes in interest rates. The longer a bond’s duration, the higher its sensitivity to changes in interest rates and vice versa.
Earnings Growth Rate refers to the annualized rate of growth of earnings for a stock or stocks in a portfolio over a given forward looking or trailing period.
Interest rate risk is the potential for a bond or other fixed-income asset to decline in value when interest rates move in an unfavorable direction.
Monetary tightening refers to central bank activity aimed at curbing inflation and slowing down growth in the economy by raising interest rates and reducing the supply of money.
Price-to-Earnings (P/E) Ratio measures share price compared to earnings per share for a stock or stocks in a portfolio.