
Key takeaways:
- Rates markets are caught between the inflationary aspects of higher oil prices and AI-related CapEx spending and the relief prospects of a potential US-Iran deal.
- Corporate credit spreads are tight, but the fundamental and technical reasons for them being so remain intact: earnings are robust and investor appetite remains strong, with supply being well absorbed.
- Securitised assets can bring additional and differentiated sources of yield, helping investors potentially maximise income per unit of risk.
A war between Israel/US and Iran was on few people’s radar heading into 2026. Our message of seeking resilience in our annual outlook, therefore, turned out to be sage. Challenges to fixed income markets in the first half of 2026 predominantly reflected a shift in interest rate expectations as markets grew concerned that higher energy prices from disrupted oil and gas flows from the Middle East could ultimately feed through into broader inflation.
Rates dominate credit
The global economy defied doom-mongers, but geopolitical tensions found an outlet in rates volatility. Sovereign bond yields rose, reflecting the monetary policy realignment as prospects for rate cuts broadly gave way to pauses and, in some cases, hikes. Fresh fiscal concerns also lifted yields, with longer-dated bond yields breaching the highs of recent years in most developed markets.
With the outlook for US central bank rates policy still in the balance, and leaning hawkish elsewhere, we remain cautious on duration risk. Inflation concerns have risen, not just because of the fallout from the Middle East conflict but also because economies have been more resilient than expected. Meanwhile, artificial intelligence (AI)-related spending is proving inflationary initially (e.g., higher chip/memory costs) ahead of anticipated productivity gains.
That said, the back-up in yields and volatility in rates may present some tactical opportunities. Provided any second-order effects on inflation from the supply disruption in the Middle East are contained, a resolution to the war could see yields move lower. Much depends on how long the shipping traffic through the Strait of Hormuz remains disrupted. Such an equivocal rates outlook may favour the floating-rate structure of many securitised assets.
The upward move in sovereign yields lifted yields on corporate bonds, denting returns. Yet the global economy proved remarkably resilient. Consumption held up (often in defiance of gloomy responses in surveys), and labour markets did not buckle.
Credit spreads (the additional yield a corporate bond pays over a government bond of similar maturity, and generally viewed as a barometer of corporate health) completed a round trip. They widened early in the conflict but have since moved back closer to where they began the year, which was near their 20-year tights. The exception was the lowest-quality debt (CCC rated), where spreads are around average levels, suggesting the market is discriminating between better- and poorer-quality borrowers.
Exhibit 1: Global credit spreads have done a round trip (basis points)
| Investment grade | High yield | ||||||
| AAA | AA | A | BBB | BB | B | CCC | |
| Jan | 36 | 47 | 63 | 92 | 185 | 336 | 992 |
| Feb | 45 | 55 | 73 | 103 | 199 | 361 | 1,055 |
| Mar | 44 | 60 | 79 | 112 | 227 | 399 | 1,117 |
| Apr | 40 | 53 | 70 | 100 | 190 | 337 | 1,021 |
| May | 36 | 50 | 65 | 93 | 182 | 325 | 1,035 |
| Percentile rank of spreads at 31 May 2026 v last 20 years | |||||||
| 3% | 6% | 1% | 1% | 1% | 8% | 52% | |
Source: Bloomberg, 31 May 2026, month end figures. Option-adjusted spread over governments in basis points. One basis point = 0.01%, 100 bps = 1%. Investment grade = ICE BofA Global Corporate Index at specified credit ratings. High yield = ICE BofA Global High Yield Index at specified credit ratings. A percentile rank of 1% means credit spreads are close to the tightest they have been in 20 years, a rank of 100% means they are at their widest, 50% means they are in the middle of the range for the last 20 years. Past performance does not predict future returns.
While spreads may be low relative to the last 20 years, overall yields are still attractive because government bond yields are near their highest levels over this period. This creates demand from income-seeking investors despite tight spreads. Ultimately, spreads follow the economic cycle and, so far this year, there are few signs of a major deceleration in economic growth. It is possible that the lagged impact of the Middle East conflict could bite in coming months, so investors should be on their guard, but we believe there may be an opportunity cost to being overly cautious.
Strong earnings have helped sentiment. For Q1 2026, the S&P 500® Index reported year-over-year earnings growth of 28.6%, the fastest since Q4 2021 (a figure that was positively distorted by the bounce-back from COVID).1 There is an argument that the market might be complacent, but the trend of recent years towards tighter spreads has its origin in strong fundamentals. Corporate leverage has been declining recently, and this is not just a US phenomenon.
Exhibit 2: Corporate leverage has been declining
Debt securities and loans of non-financial corporations as a % of gross domestic product (GDP)
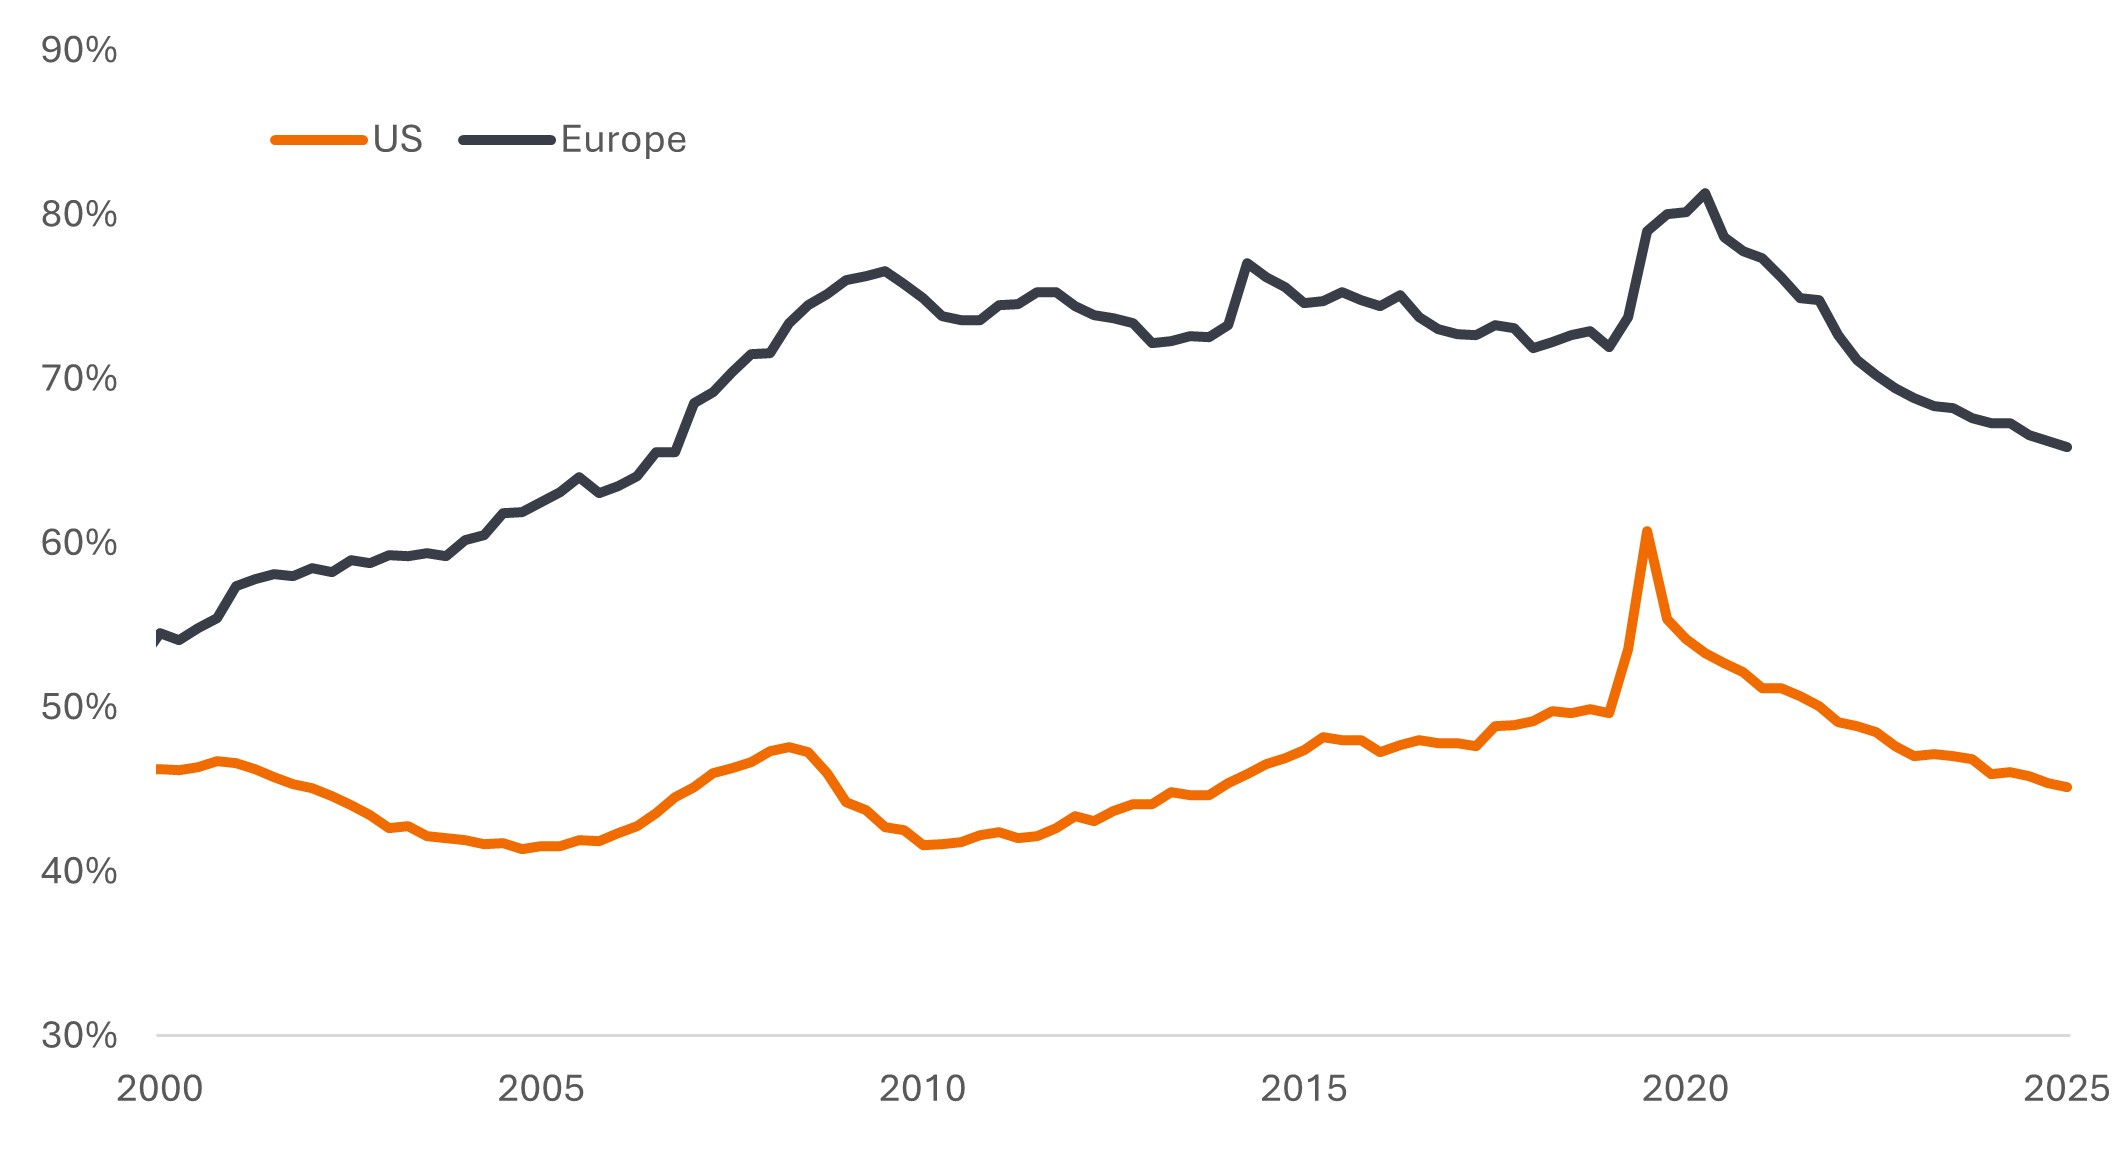
Source: US: Federal Reserve Economic Database (FRED), Europe: European Central Bank, Euro area 20. Q4 2000 to Q4 2025. GDP = Gross domestic product, which is a measure of the size of an economy, representing the value of all finished goods and services produced by a country within a specific time period (usually quarterly or annually).
Add to the mix strong household balance sheets, low unemployment across many countries, real wages rising until the recent energy price spike, and US tax cuts, and it becomes easier to justify the tightness in spreads.
Supply creates its own demand
This notion of declining corporate leverage might seem to fly in the face of the heavy supply of bonds from hyperscalers as they invest in AI. Approximately US$800 billion in CapEx is forecast to be spent this year alone by hyperscalers.2 Markets may have to absorb around US$240 billion in AI-related bond issuance in 2026.3 While the overwhelming majority of this issuance is coming from some of the highest-quality borrowers, many of which have little to no net debt, the sheer quantum of new issuance may test investors’ appetites and could weigh on company spreads. Opportunities from the AI build out are also being created among securitised sectors, notably within infrastructure asset-backed securities (ABS).
For other borrowers, there may be a ‘crowding-out’ effect, potentially causing some modest spread widening in the second half of 2026. Set against this is the fact that money borrowed and spent helps drive revenues elsewhere in the economy. A key risk to markets would be if hyperscalers rowed back on their spending plans, as this could pierce bullish sentiment and be damaging for risk assets.
We are currently in a nebulous phase for AI. No one is sure what the full costs and benefits will be, but it is already a transformational technology helping to deliver an economic boost. Worries about AI displacing existing business models have led to software businesses coming under pressure, which in turn has created challenges within parts of the private credit market – more around negative headlines related to caps on redemptions than anything more systemic. At the other end of the scale are so-called HALO (heavy assets, low obsolescence) companies such as energy grids, commodities, and manufacturing that are seen as broadly immune to displacement.
Diversity of yield sources
We are mindful that ongoing equity market strength has created ebullience. The chances of a correction in equities may be building: the lagged effects of the closure of the Strait of Hormuz, if not resolved soon, could come home to roost through weaker growth or higher inflation; the Fed could signal a shift towards raising rates; and the heavy equity IPO calendar (often a herald of a market top) could trigger indigestion.
It may be useful to consider which areas of fixed income are less correlated to equities. After all, alongside income, fixed income asset classes are often sought as a portfolio diversifier. High yield bonds, which are sensitive to corporate conditions, have the closest correlation to equities. Government bonds typically have a negative correlation, as they often outperform when the macro environment weakens.
Securitised assets, such as ABS and commercial mortgage-backed securities, offer low to negative correlation to equities. In part, this is because they tend to respond to specific or differentiated cycles (housing supply, travel, retail consumption, rental markets, etc), and securitised indices are often of higher credit quality than corporates.
Exhibit 3: Asset class correlations to S&P 500® Index (2016 to 2026)
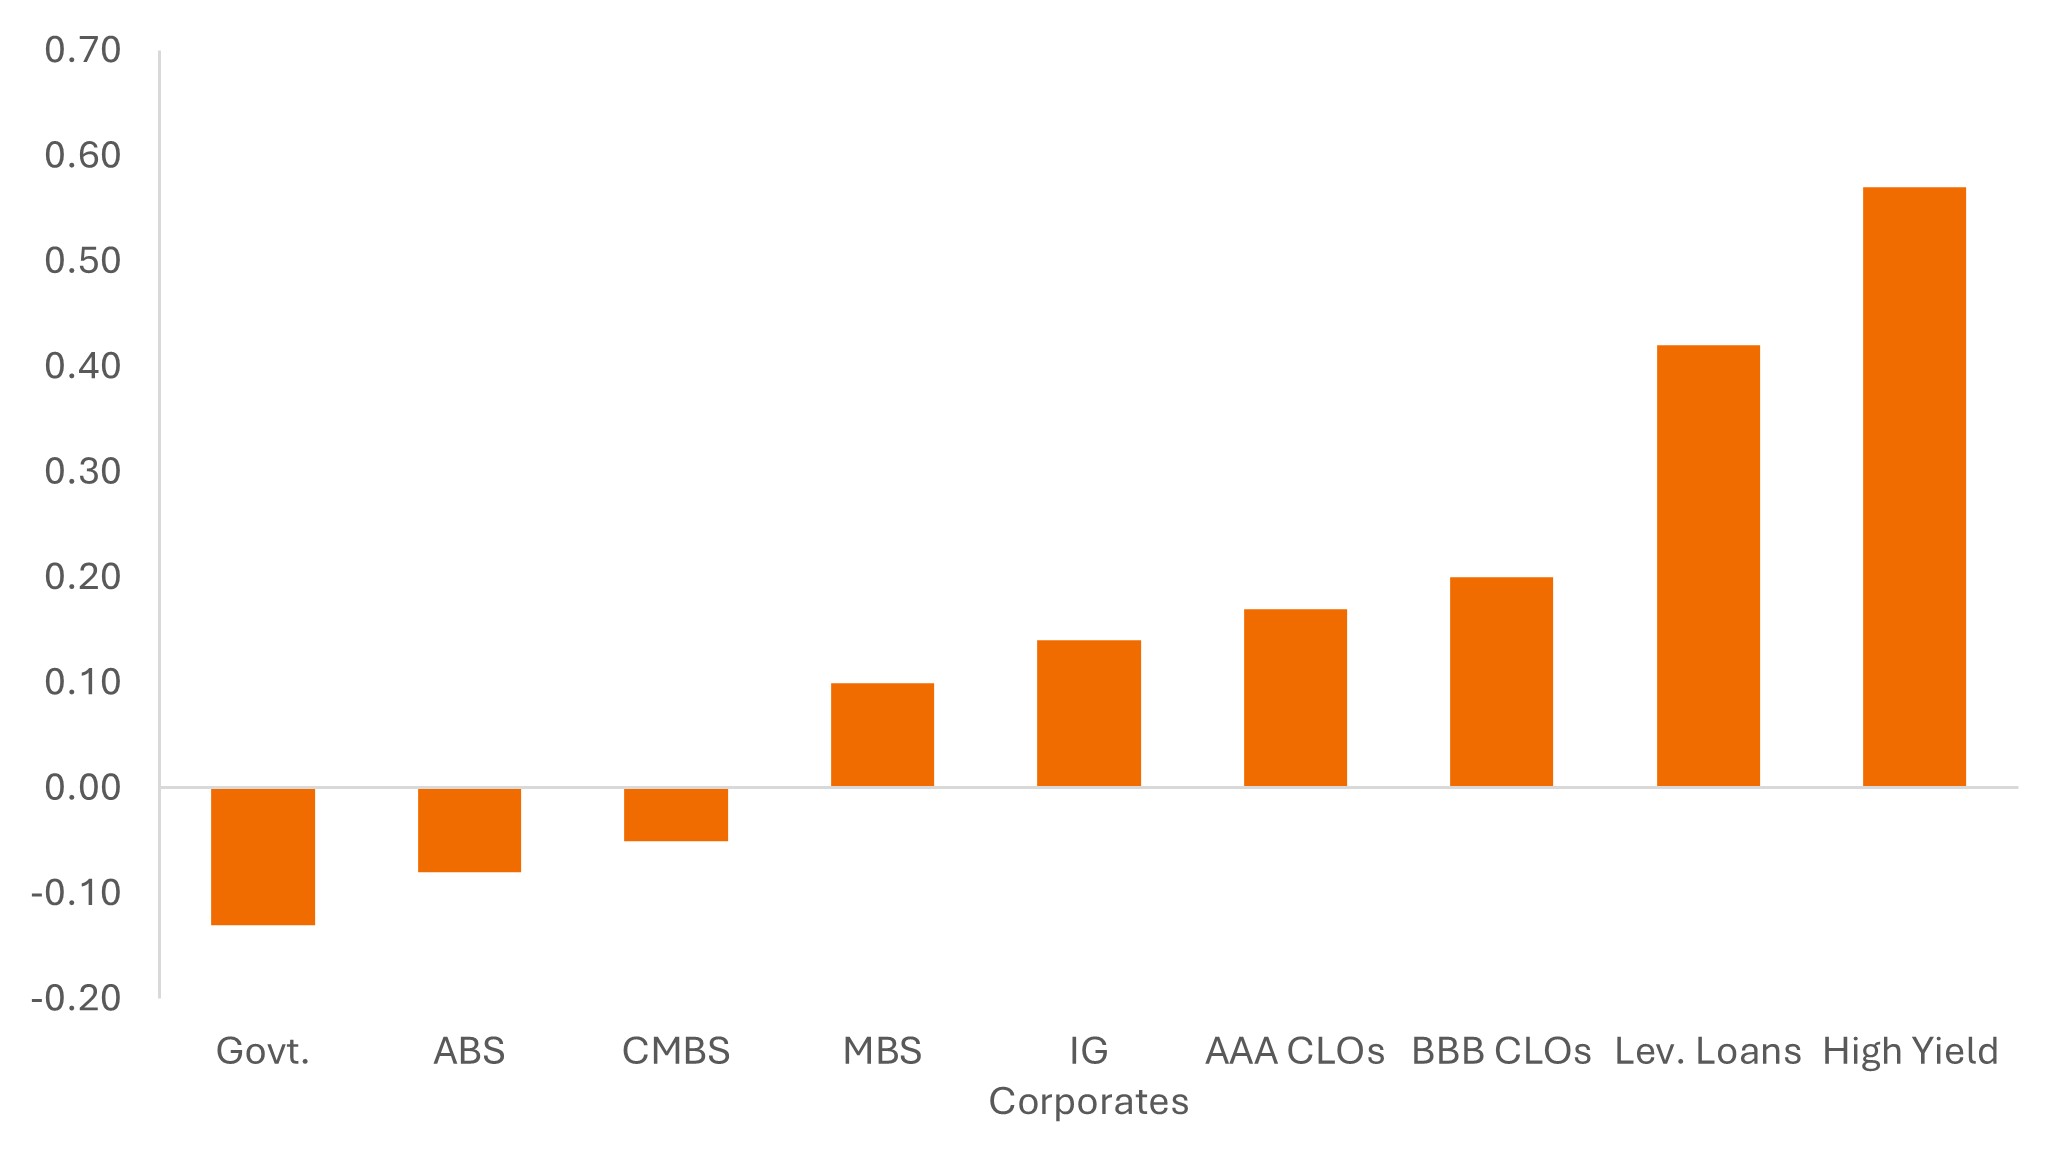
Source: Bloomberg, JP Morgan, Janus Henderson Investors, as of 31 May 2026. Daily correlations for 10-year period ended 31 May 2026. Indices used to represent asset classes: Govt. = Bloomberg US Treasury Index, ABS = Bloomberg US Aggregate Asset-Backed Securities Index, CMBS = Bloomberg US Commercial Mortgage-Backed Securities Investment Grade Index, MBS = Bloomberg US Mortgage-Backed Securities Index, IG Corporates = Bloomberg US Corporate Investment Grade Bond Index, AAA and BBB CLOs = J.P. Morgan CLO Indices, Lev. Loans = Morningstar LSTA Leveraged Loan Index, High yield = Bloomberg US High Yield Bond Index. Past performance does not predict future returns.
Given the uncertain outlook for markets, the broad range of fixed income sub-asset classes offers a useful toolbox for portfolio construction. Exhibit 4 shows volatility for different asset classes from two different factors: rate risk (movements linked to changes in interest rates) and spread risk (movements linked to changes in confidence that a borrower can repay). Investors seeking to limit their sensitivity to changes in interest rates may hold more in the way of loans with their floating-rate structure, or collateralised loan obligations (CLOs).
At the other end of the scale, investment-grade corporate bonds would likely respond most positively to a rate cut. Investors worried about growth prospects could limit spread (credit) risk through a holding in Treasuries or agency mortgage-backed securities (MBS). Conversely, high yield and emerging market debt likely offer more potential in an environment of resilient economic growth.
Blending asset classes or employing hedging strategies can help investors achieve a desired risk profile and outcome. Earlier we noted how corporate bond spreads were near their tights. This is not true for securitised assets, where spreads, and in turn yields, remain at relatively attractive levels, allowing investors to maximise their income per unit of risk. The circle widths in Exhibit 4 represent the size of average yields at 31 May 2026 (for example, the yield on US Treasuries is 4.3% and the yield on US loans is 8.6%).
Exhibit 4: The fixed income universe comprises a wide range of sectors that can be combined to achieve better risk-adjusted outcomes
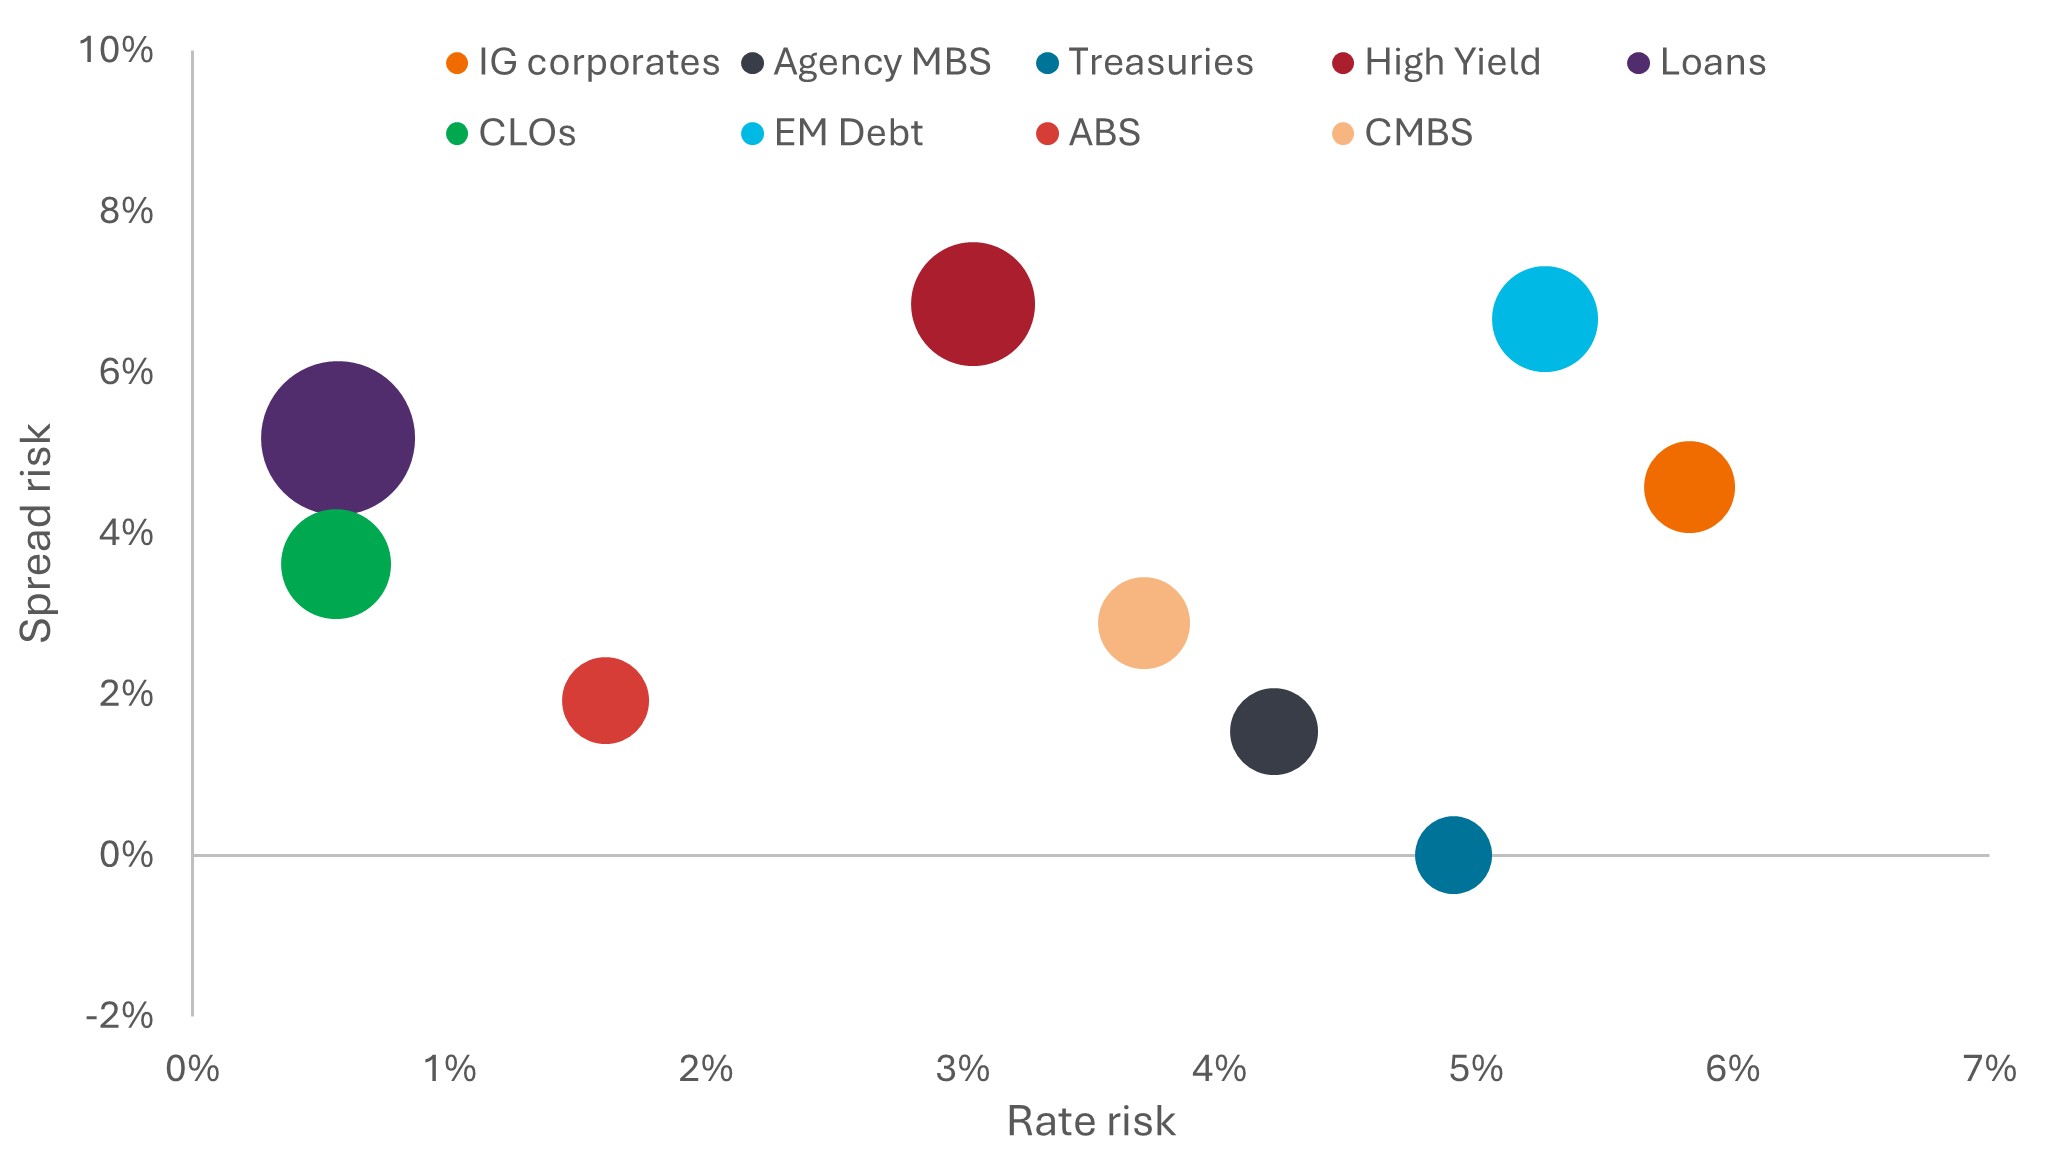
Source: Bloomberg, JP Morgan, Janus Henderson Investors, as of 31 May 2026. Rate risk and spread risk based on rate and spread volatility for the 10-year period to 31 May 2026. Circle size represents yield. Indices used to represent asset classes: IG Corporates = Bloomberg US Corporate Investment Grade Bond Index, Agency MBS = Bloomberg US Mortgage-Backed Securities Index, Treasuries = Bloomberg US Treasury Index, High yield = Bloomberg US High Yield Bond Index, Loans = J.P. Morgan Leveraged Loan Index, CLOs = J.P. Morgan CLO Index, EM Debt = Bloomberg EM USD Sovereign + Quasi-Sov Index, ABS = ICE BofA US Fixed & Floating Rate Asset Backed Securities Index, CMBS = ICE BofA US Fixed Rate Commercial Mortgage-Backed Securities Index. Past performance does not predict future returns.
We have said for some time that investors should look beyond the narrow confines of traditional areas of fixed income and embrace some of the opportunities and diversification potential of the full breadth of the asset class.
The first half of 2026 threw some curveballs at investors. But by putting things into perspective, we can understand why markets have behaved in a certain way and objectively look to seek opportunities and mitigate risks within portfolios.
1Source: Factset, S&P 500 year-on-year earnings growth for Q1 2026. As of 29 May 2026, 97% of 500 companies had reported Q1 2026 earnings by this date.
2Source: Morgan Stanley estimates, 12 May 2026. There is no guarantee that past trends will continue, or forecasts will be realised.
3Source: Barclays estimates, 21 May 2026. There is no guarantee that past trends will continue, or forecasts will be realised.
Bloomberg EM USD Sovereign + Quasi-Sov Index measures the performance of fixed and floating rate US dollar denominated debt issued by emerging market governments (sovereign) and government-owned or guaranteed entities (quasi sovereign).
Bloomberg US Aggregate Asset-Backed Securities Index tracks investment grade fixed rate, taxable US dollar denominated asset-backed securities.
Bloomberg US CMBS Investment Grade Index measures the performance of US Agency and non-Agency commercial mortgage-backed securities (CMBS).
Bloomberg US Corporate (Investment Grade) Bond Index measures the investment grade, fixed rate, taxable corporate bond market.
Bloomberg US Corporate High Yield Bond Index measures the USD-denominated, high yield, fixed rate corporate bond market.
Bloomberg US Mortgage Backed Securities (MBS) Index tracks fixed rate agency mortgage backed pass-through securities guaranteed by Ginnie Mae, Fannie Mae and Freddie Mac.
Bloomberg US Treasury Index measures US dollar-denominated, fixed rate, nominal debt issued by the US Treasury.
ICE BofA AAA US Fixed Rate CMBS Index tracks the performance of US dollar denominated investment grade AAA rated fixed rate commercial mortgage backed securities publicly issued in the US domestic market.
ICE BofA Global Corporate Index tracks the performance of investment grade corporate debt publicly issued in the major domestic and Eurobond markets.
ICE BofA Global High Yield Index tracks the performance of USD, CAD, GBP and EUR denominated below investment grade corporate debt publicly issues in the major domestic or Eurobond markets.
ICE BofA US Fixed & Floating Rate Asset Backed Securities Index tracks the performance of US dollar-denominated investment grade asset backed securities publicly issued in the US domestic market.
ICE BofA US Corporate Bond Index tracks the performance of US dollar-denominated investment grade debt publicly issued in the US domestic market.
ICE BofA US Fixed Rate CMBS Index tracks the performance of US dollar denominated investment grade fixed rate commercial mortgage backed securities publicly issued in the US domestic market.
J.P. Morgan Collateralised Loan Obligation Index tracks the performance of broadly syndicated arbitrage US dollar-denominated debt.
J.P. Morgan Leveraged Loan Index measures the investable universe of the USD institutional leveraged loan market.
Morningstar LSTA US Leveraged Loan Index is a market-value weighted index designed to measure the performance of the US leveraged loan market.
Agency Mortgage-backed Securities (Agency MBS): A type of asset-backed security that is specifically secured by a collection of mortgages. These securities are issued by one of the three government-sponsored enterprises (GSEs): Fannie Mae (Federal National Mortgage Association), Freddie Mac (Federal Home Loan Mortgage Corporation), or Ginnie Mae (Government National Mortgage Association).
Asset-backed Securities (ABS): These are financial instruments that are backed by a pool of assets—typically those that generate a cash flow from debt, such as loans, leases, credit card balances, or receivables.
Balance sheet: Typically an accounting reference relating to assets versus liabilities for an entity, whether a household or a corporation.
Basis point: One basis point (bp) equals 1/100 of a percentage point, 1bp = 0.01%.
CapEx: Money a business spends on major, long-term assets such as property and equipment (tangible assets) or technology, software, trademarks, patents etc (intangible assets) to facilitate new projects or investments that support business growth and expansion
Collateral: In a securitisation, collateral refers to the pool of financial assets that are bundled together to form the basis of a security.
Collateralised Loan Obligations (CLOs) are debt securities issued in different tranches, with varying degrees of risk, and backed by an underlying portfolio consisting primarily of below investment grade corporate loans. The return of principal is not guaranteed, and prices may decline if payments are not made timely or credit strength weakens. CLOs are subject to liquidity risk, interest rate risk, credit risk, call risk and the risk of default of the underlying assets.
Commercial Mortgage-backed Securities (CMBS): A type of mortgage-backed security that is secured by the loan on commercial real estate properties rather than residential real estate.
Corporate bond: A bond issued by a company. Bonds offer a return to investors in the form of periodic payments and the eventual return of the original money invested at issue on the maturity date.
Correlation measures the degree to which two variables move in relation to each other. A value of 1.0 implies movement in parallel, -1.0 implies movement in opposite directions, and 0.0 implies no relationship.
Credit cycle: The changing availability and pricing of credit that is linked to economic expansion and contraction. It is seen as having four distinct phases: downturn, repair, recovery, and expansion. Borrowing and spending is expansionary and helps sustain economic growth but when lenders restrict lending this can lead to a downturn and businesses and households have to repair their finances until the economy moves back into recovery and expansion.
Credit rating: A score given by a credit rating agency such as S&P Global Ratings, Moody’s and Fitch on the creditworthiness of a borrower. For example, S&P ranks investment grade bonds from the highest AAA down to BBB and high yields bonds from BB through B down to CCC in terms of declining quality and greater risk, i.e. CCC rated borrowers carry a greater risk of default.
Credit spread: The difference in yield between securities with similar maturity but different credit quality. Widening spreads generally indicate deteriorating creditworthiness of corporate borrowers, and narrowing indicate improving.
Default: The failure of a debtor (such as a bond issuer) to pay interest or to return an original amount loaned when due.
Duration: Duration measures the sensitivity of a bond’s or fixed income portfolio’s price to changes in interest rates. The longer a bond’s duration, the higher its sensitivity to changes in interest rates and vice versa.
Diversification: A way of spreading risk by mixing different types of assets/asset classes in a portfolio, on the assumption that these assets will behave differently in any given scenario.
Fundamentals: In the context of corporate debt, “fundamentals” refer to the essential financial health indicators and characteristics of a company that suggest its ability to meet debt obligations.
Federal Reserve (Fed): The central bank of the US which determines its monetary policy.
Fiscal policy: Describes government policy relating to setting tax rates and spending levels. Fiscal discipline is where governments do not borrow excessively, i.e. keeping borrowing as a percentage of the output of the economy low so that the overall debt burden does not expand aggressively.
Hedge: A trading strategy that involves taking an offsetting position to another investment that will lose value as the primary investment gains and vice versa. These positions are used to reduce or manage various risk factors and limit the probability of overall loss in a portfolio.
High yield bond: Also known as a sub-investment grade bond, or ‘junk’ bond. These bonds usually carry a higher risk of the issuer defaulting on their payments, so they are typically issued with a higher interest rate (coupon) to compensate for the additional risk.
Hyperscaler: Technology providers that provide IT architectures that scale dynamically to handle exponential increases in workload and data. Apart from capacity, they offer enterprise-grade cloud services, flexible hardware resources, and robust software environments that support a broad range of AI applications
Inflation: The rate at which prices of goods and services are rising in the economy.
IPO, or initial public offering: The term for the first time that a private company sells shares of its stock to the public on a stock exchange.
Investment grade bond: A bond typically issued by governments or companies perceived to have a relatively low risk of defaulting on their payments, reflected in the higher rating given to them by credit ratings agencies.
Issuance: The act of making bonds available to investors by the borrowing (issuing) company, typically through a sale of bonds to the public or financial institutions.
Leverage: The level of borrowing at a company, typically referred to as debt divided by earnings. It can also be used to describe corporate debt levels as a proportion of the economy or a company’s balance sheet.
Maturity: The maturity date of a bond is the date when the principal investment (and any final coupon) is paid to investors. Shorter-dated bonds generally mature within 5 years, medium-term bonds within 5 to 10 years, and longer-dated bonds after 10+ years.
Monetary policy: The policies of a central bank, aimed at influencing the level of inflation and growth in an economy. Monetary policy tools include setting interest rates and controlling the supply of money.
Private credit: An asset defined by non-bank lending where the debt is not issued or traded on the public markets.
Securitisation: The process in which certain types of assets are pooled so that they can be repackaged into interest-bearing securities. The interest and principal payments from the assets are passed through to the purchasers of the securities.
Sovereign bond/government bond: Bonds issued by governments to pay off debt or finance spending. They are typically backed by a country’s capacity to levy taxes on its citizens and/or capacity to print money.
Treasuries/US Treasury securities: Debt obligations issued by the US government. Treasury bills and US government bonds are guaranteed by the full faith and credit of the US government. They are generally considered to be free of credit risk and typically carry lower yields than other securities.
Volatility measures risk using the dispersion of returns for a given investment. The rate and extent at which the price of a portfolio, security or index moves up and down.
Yield: The level of income on a security over a set period, typically expressed as a percentage rate.
Yield-to-worst: The lowest yield a bond with a special feature (such as a call option) can achieve provided the issuer does not default.
IMPORTANT INFORMATION
Diversification neither assures a profit nor eliminates the risk of experiencing investment losses.
Fixed income securities are subject to interest rate, inflation, credit and default risk. The bond market is volatile. As interest rates rise, bond prices usually fall, and vice versa. The return of principal is not guaranteed, and prices may decline if an issuer fails to make timely payments or its credit strength weakens.
High-yield or “junk” bonds involve a greater risk of default and price volatility and can experience sudden and sharp price swings.
Securitized products, such as mortgage- and asset-backed securities, are more sensitive to interest rate changes, have extension and prepayment risk, and are subject to more credit, valuation and liquidity risk than other fixed-income securities.
Yields may vary and are not guaranteed.
These are the views of the author at the time of publication and may differ from the views of other individuals/teams at Janus Henderson Investors. References made to individual securities do not constitute a recommendation to buy, sell or hold any security, investment strategy or market sector, and should not be assumed to be profitable. Janus Henderson Investors, its affiliated advisor, or its employees, may have a position in the securities mentioned.
Past performance does not predict future returns. The value of an investment and the income from it can fall as well as rise and you may not get back the amount originally invested.
The information in this article does not qualify as an investment recommendation.
There is no guarantee that past trends will continue, or forecasts will be realised.
Marketing Communication.