
Key takeaways:
- Forward-looking markets’ dovish expectations for monetary policy across most jurisdictions were largely erased as global central bankers faced a surge in energy-based inflation.
- Although forced liquidation was behind part of gold’s recent decline, positive real interest rates represent a cost to holding real assets and, thus, a possible headwind for the metal’s recovery.
- We believe symmetric risk should cause investors to consider modestly leaning into duration, as a resolution of the Hormuz crisis would relieve inflationary pressure, but an escalation could result in a “flight to safety.”
The closure of the Strait of Hormuz in March sent oil past $100/barrel and markets into a tailspin, delivering a supply-driven energy shock to a vulnerable global economy. No major asset class was spared. Equities, bonds, and even gold dropped significantly. These asset classes’ trajectories now hinge on a single question: What does the Federal Reserve (Fed) do next?
What the markets are telling us
As recently as late February, derivatives markets were pricing in roughly three rate cuts over the next two years. By early April, that entire easing cycle had been erased. Yields told the same story: The 2-year U.S. Treasury yield jumped 46 basis points (bps) over those same five weeks, from below the federal funds target range to above it. Potential oil-driven inflation says, “don’t cut”, while dramatically reduced expectations for U.S. growth plead, “don’t hike”.
The Fed is paralyzed, and every asset class is dependent on how that paralysis is resolved. The repricing of rates, in itself, amounts to a tightening of financial conditions, which may be why Fed Chairman Jerome Powell defaulted to a “wait and see” stance in recent comments – the market is in effect tightening for him.
Exhibit 1: Market-based expectations for Fed policy path
Since the spike in global energy prices, the market’s expectations for multiple rate cuts in 2026 have been erased.
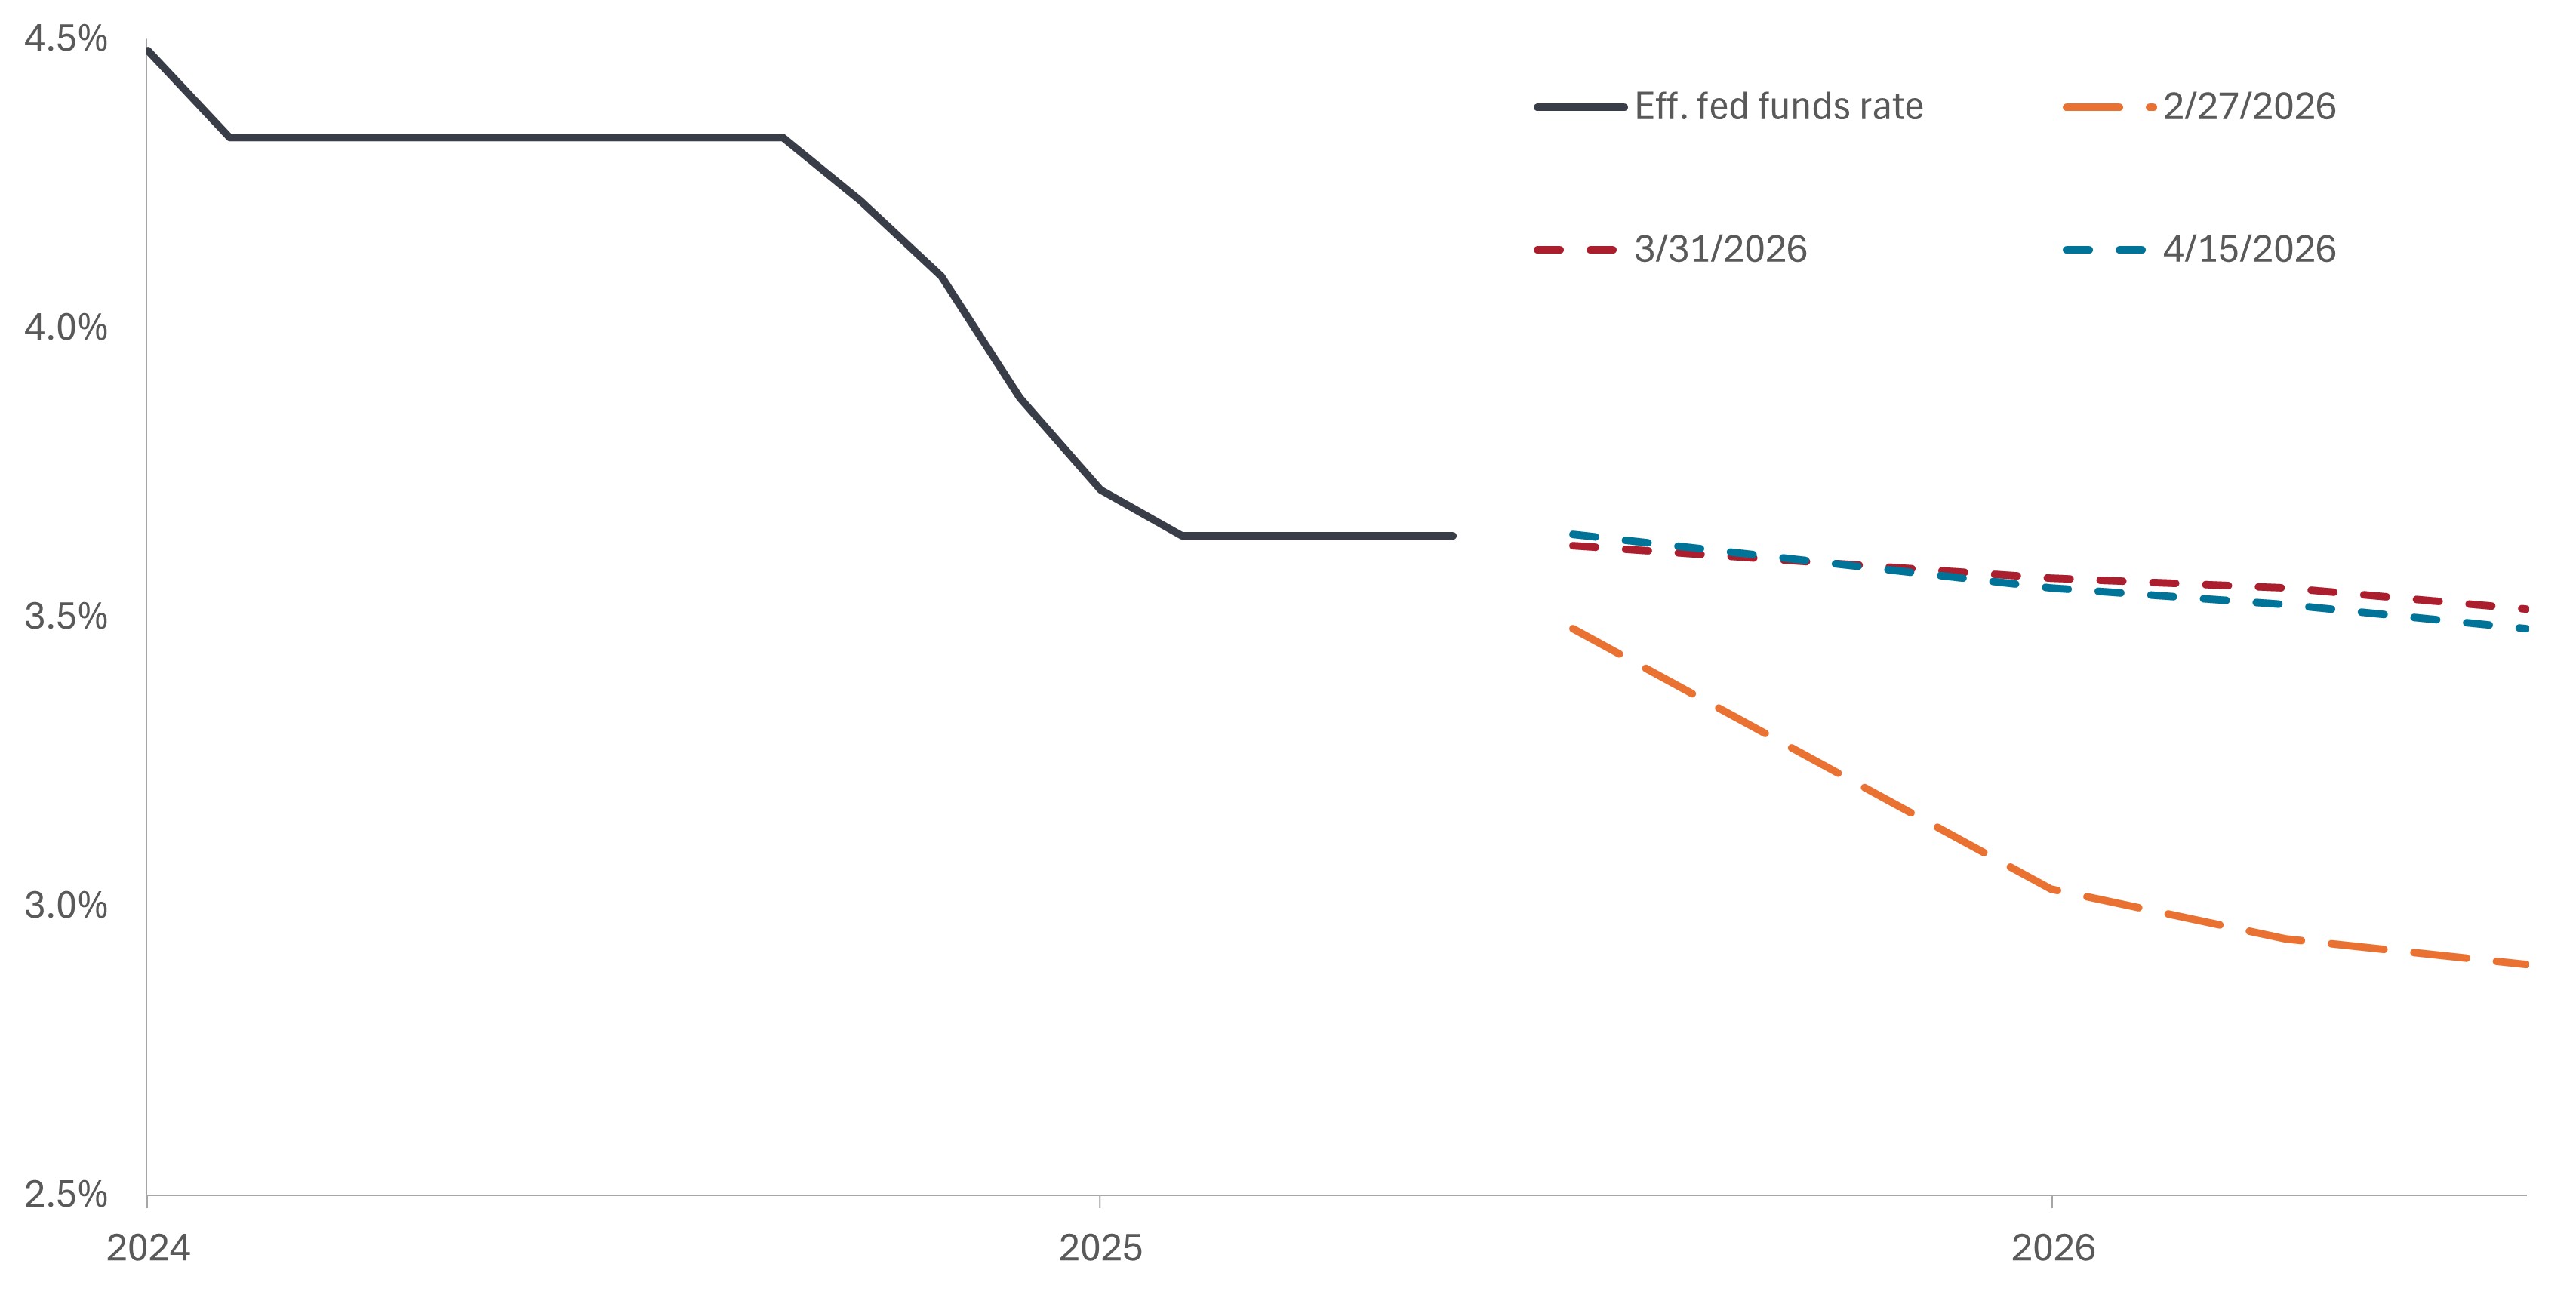
Source: Bloomberg, as of 22 April 2026.
Exhibit 2: U.S. Treasury yield and federal funds rate
Since the closure of the Strait of Hormuz, yield markets – especially the 2-year – have largely done Chairman Powell’s tightening work for him.
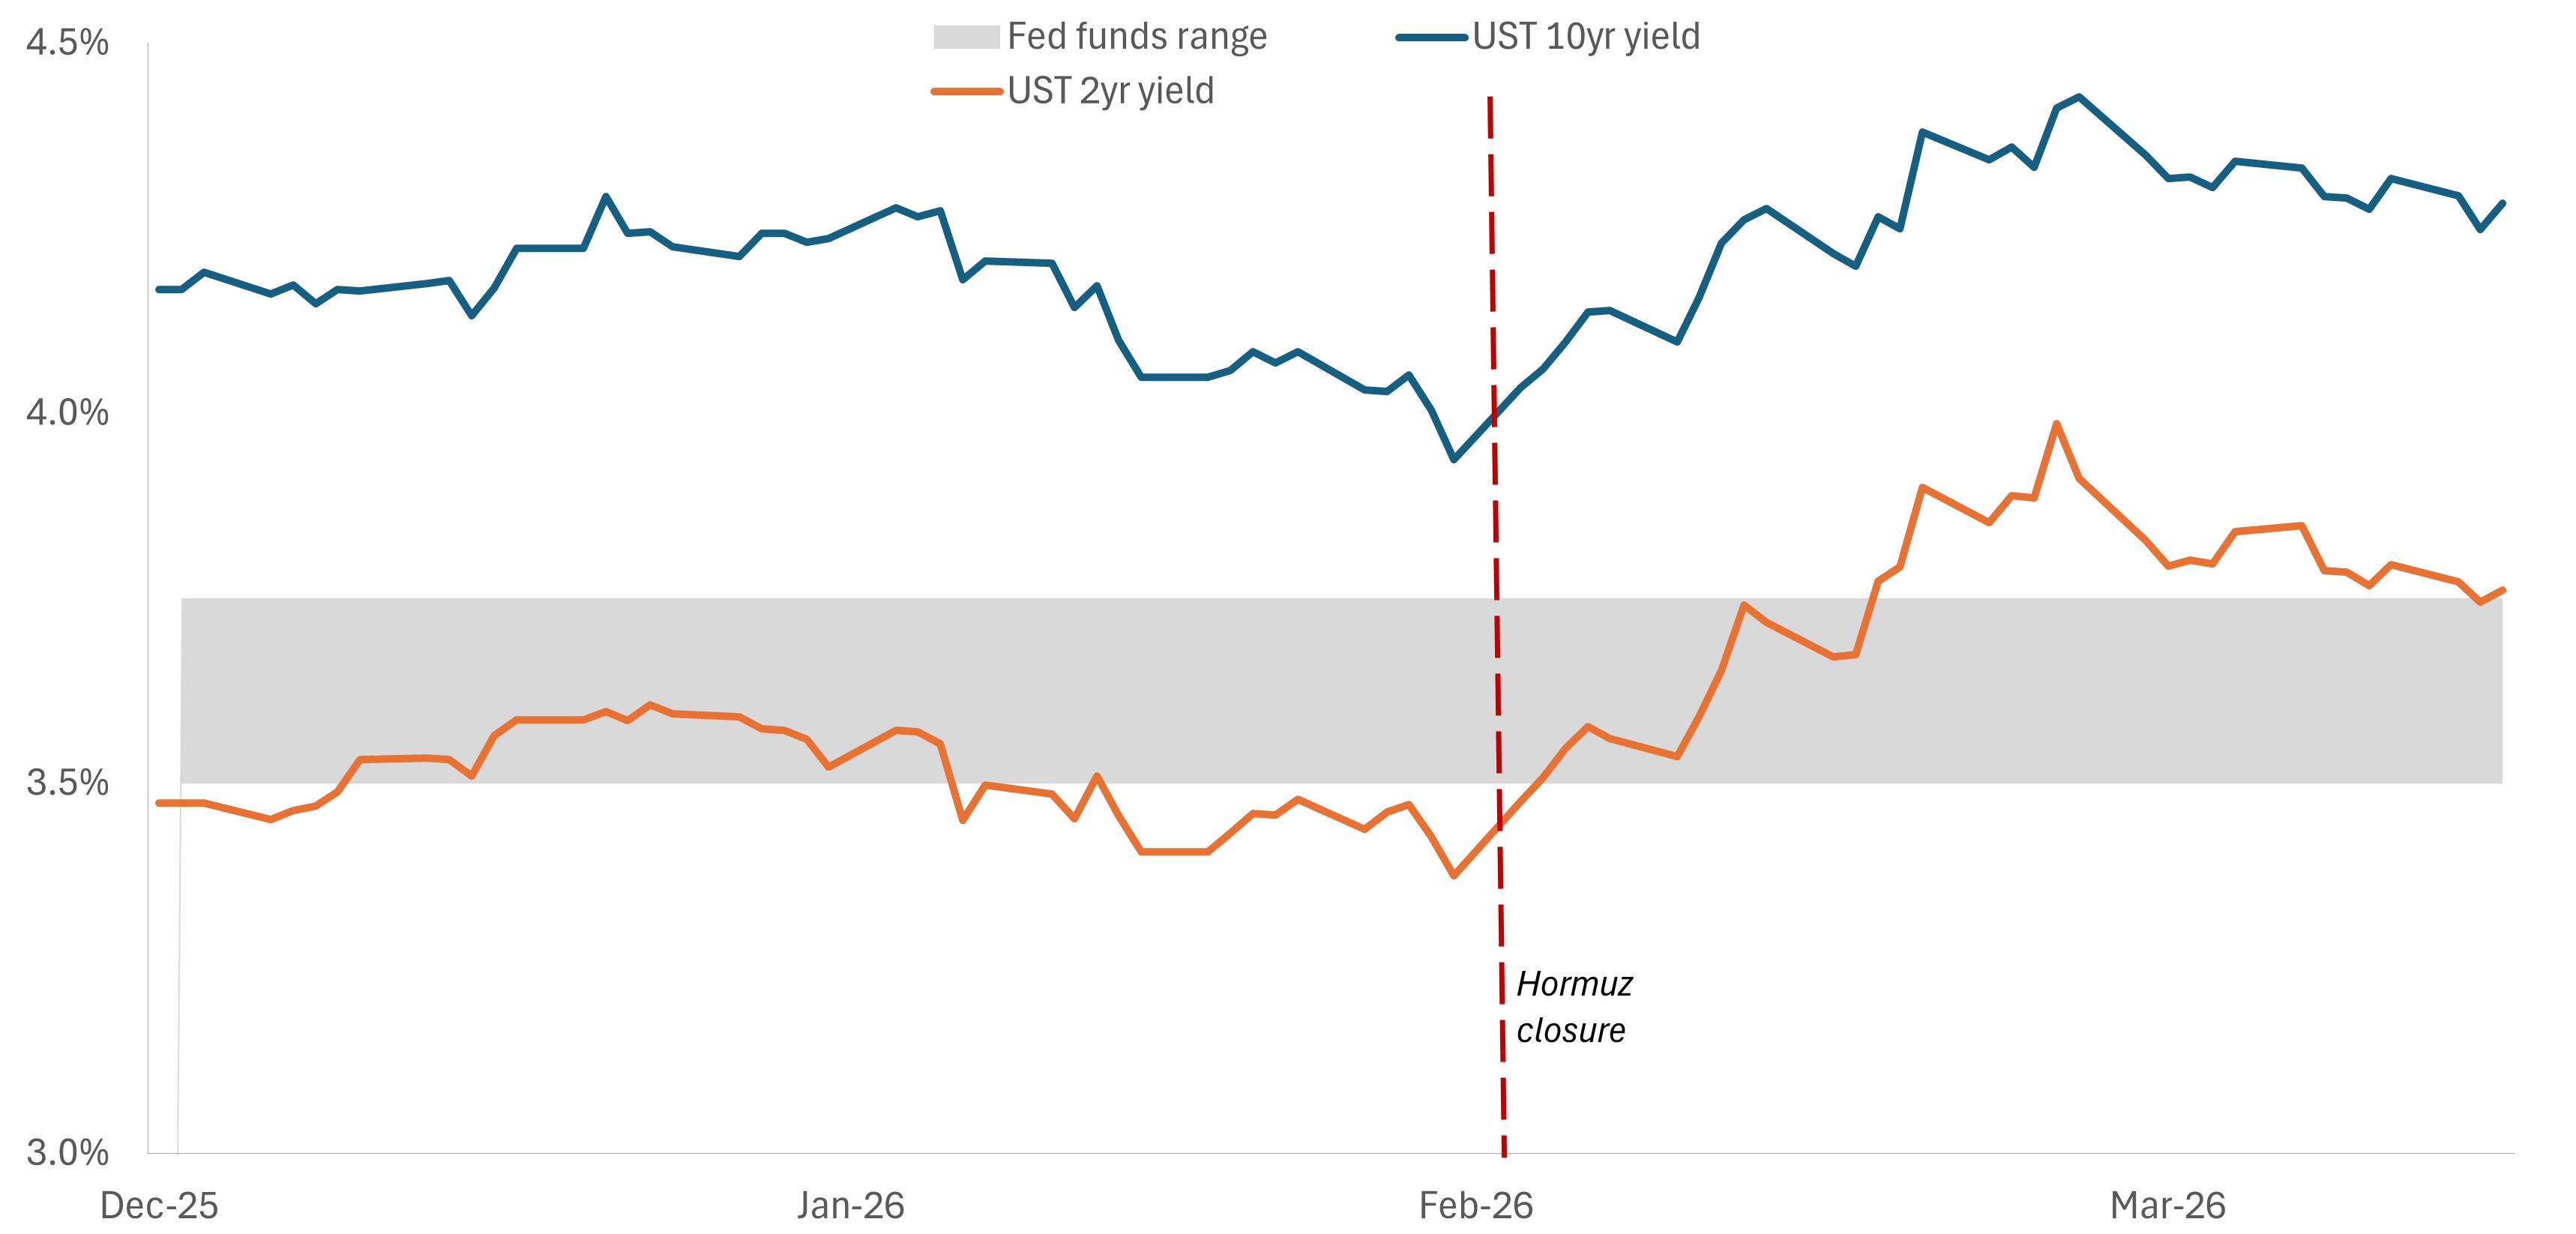
Source: Bloomberg, as of 22 April 2026.
Gold is down, but not for the reason most think
Gold has dropped 18.3% from its January peak. This appears alarming until one overlays gold’s movements during the 1974 OPEC embargo. In both instances, leveraged long positions faced margin calls during a geopolitical crisis, with selling becoming self-perpetuating.
But potential recovery conditions differ in one important way: In 1974, real interest rates were roughly 3.0% – the best environment for gold, as negative real yields make holding a non-yielding asset free. Today, real rates sit near 2.0%. This five percentage-point delta changes the calculus entirely. The structural tailwind that powered gold’s 1974 recovery is absent. Importantly, our downside signals for the yellow metal suggest the market senses something beyond margin mechanics. The 1970s analog rhymes, but it doesn’t repeat.
Exhibit 3: Gold in real terms – the 1974 analog
Gold’s recent selloff is echoing the trajectory 1974’s energy shock and associated liquidity event. This time, however, the yellow metal does not have the support of negative real yields to help it regain its footing.
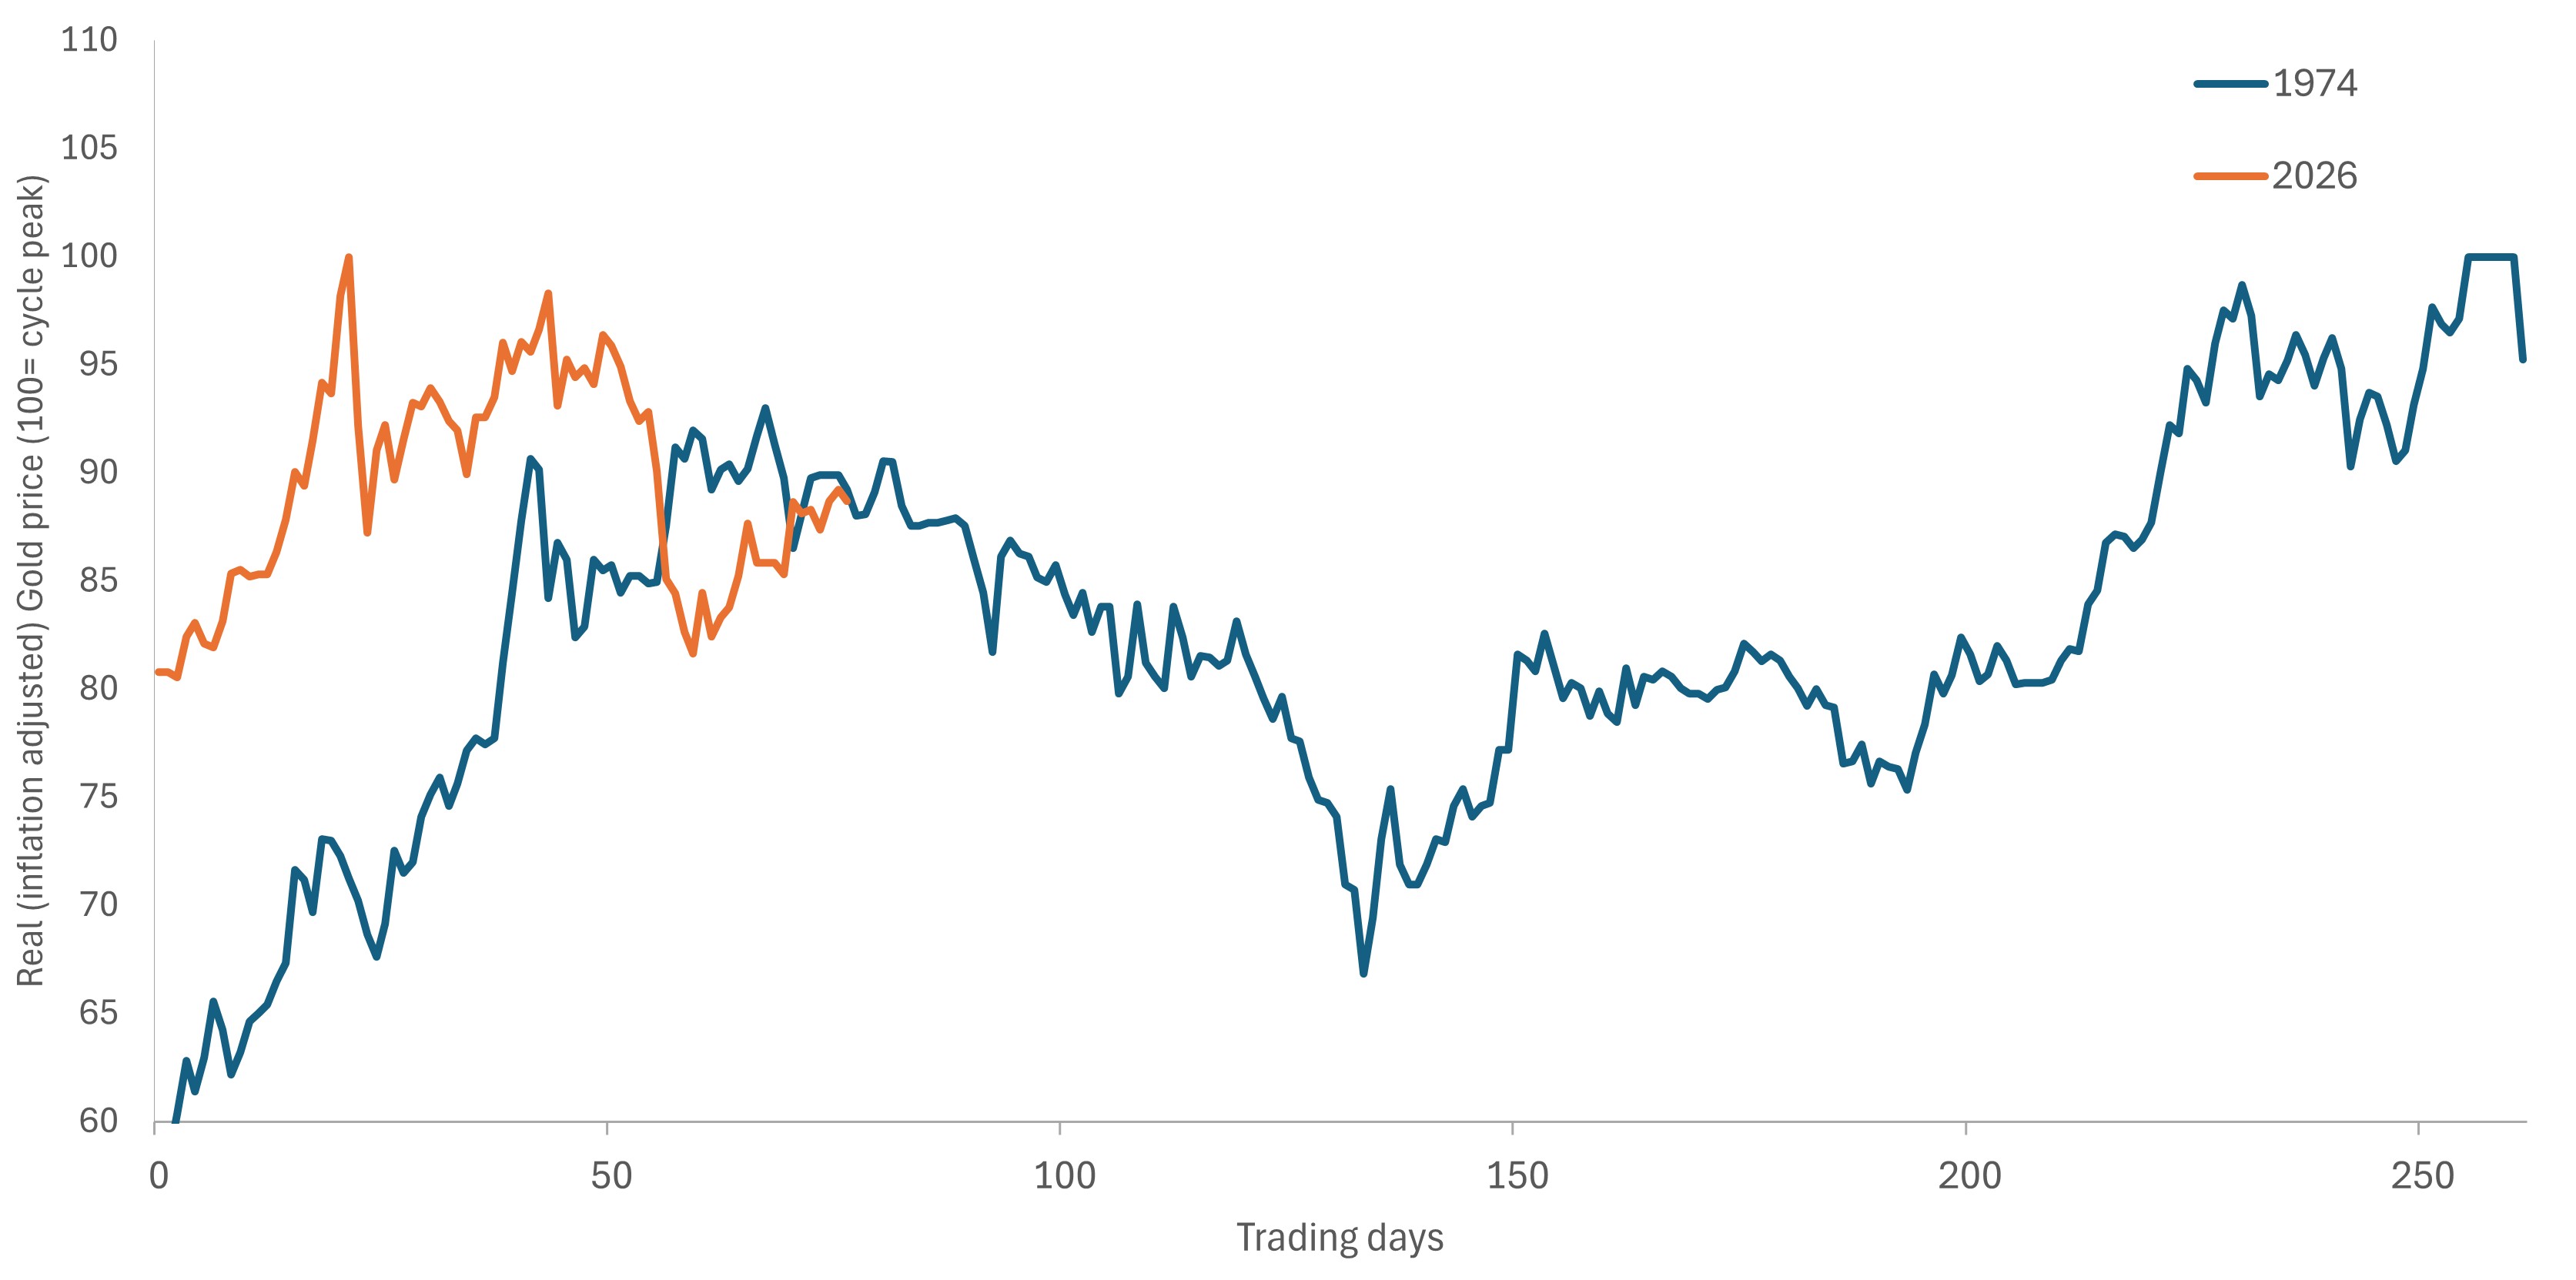
Source: Bloomberg, as of 22 April 2026.
Exhibit 4: The signals are unusually loud. Our ETX system is flashing three readings that stand out:
- Gold: The +5.16 Z downside risk score is the most extreme on the dashboard. Margin liquidation explains part of the move, but not a 5-sigma reading.
- Oil: Elevated attractiveness and elevated downside risk at the same time, a signal that a big move is coming without indicating direction. Ceasefire collapses oil; escalation pushes it higher. The options market is priced for both.
- U.S. Bonds: Downside risk at +0.54 Z, barely a ripple. In a world where every other asset has tails blowing out, sovereign bonds are the quiet corner of the board. And when every other signal is screaming, the absence of stress is itself a signal.
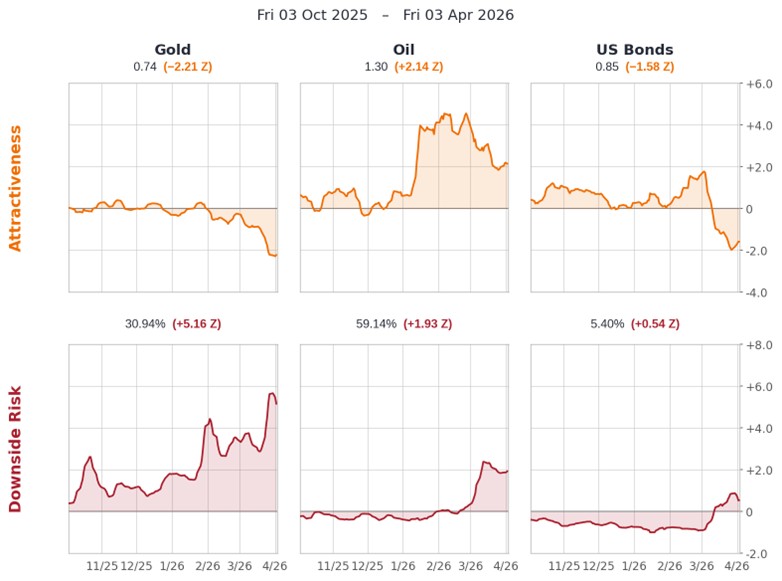
Note: ETX Attractiveness and Downside Risk signals — Gold, Oil, U.S. Bonds. Source: JHI Asset Allocation.
The dollar is running on fear, not fundamentals
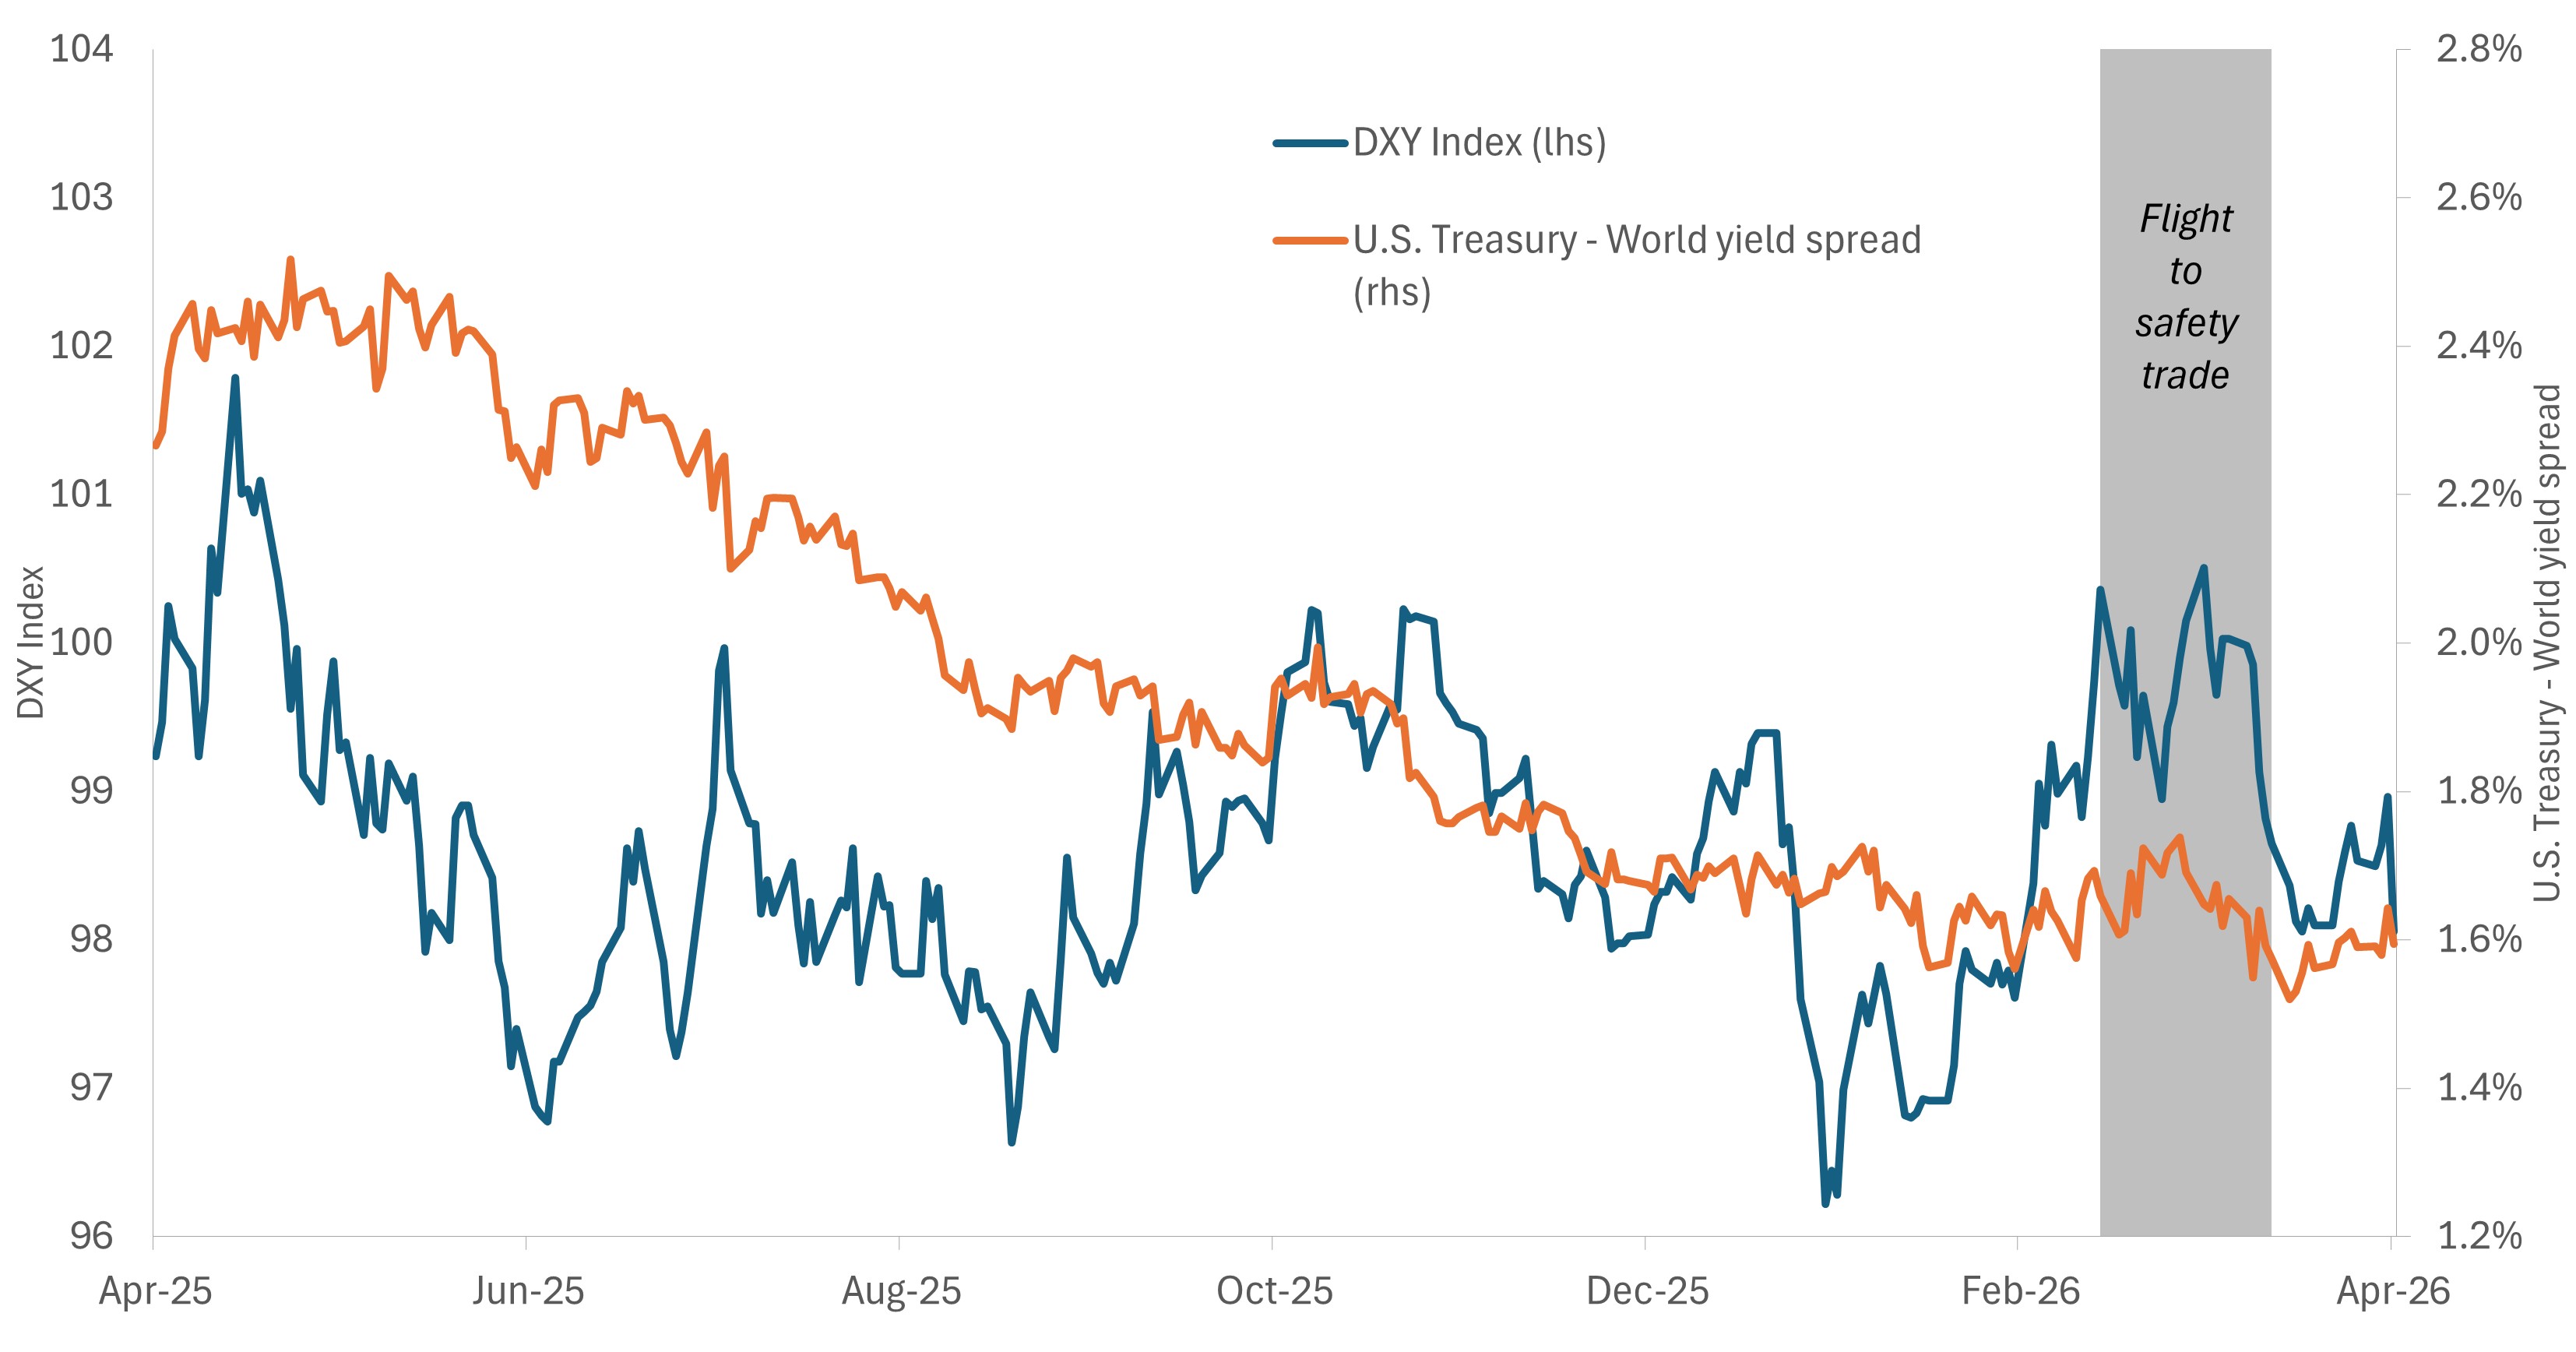
For most of the past year, the dollar and the “U.S.-versus-world yield” differentials moved in lockstep, both declining as European and Japanese rates caught up with the U.S. through late last year.
That relationship broke once the Hormuz crisis hit. Yield spreads kept compressing while the dollar rallied on safe-haven flows. This caused yield spreads and the U.S. currency to diverge by more than two standard deviations from their trailing 12-month relationship. The resulting gap is a flight-to-safety premium – real, but not supported by rate fundamentals – and historically, these premiums do not persist.
Exhibit 5: U.S. dollar and real yields
Rising global yields had removed support for the U.S. dollar, but a flight to safety in March reversed that trade despite the move being unmoored from rate-differential fundamentals.
Source: Bloomberg.
The case for duration
Fed paralysis and its eventual resolution is the market’s fulcrum. Growth damage from the energy shock is already in motion: Consumer confidence and business spending were already weakening before oil spiked.
The inflation threat, meanwhile, is tied to a single geopolitical variable. If the Hormuz chokepoint is resolved, the inflation handcuffs would come off, and the Fed could address the growth damage already baked into markets. If it doesn’t, flight to quality likely does the work instead. Either way, the asymmetry favors duration.
Furthermore, sovereign bonds offer attractive carry, liquidity, and the potential for capital preservation across the widest range of geopolitical and market scenarios. In this environment, the least bad option is a good one.
Geopolitical premiums don’t last
Gold’s material downside risk warrants close monitoring. With real rates above 2%, the backdrop that supported recoveries after past supply shocks is missing, suggesting the market is pricing something beyond a temporary liquidation event. The dollar tells a similar story: Its flight-to-safety premium is real but unsupported, in our view, by rate fundamentals, and these premiums typically mean-revert sharply, cascading through non-U.S. equities and emerging markets when they unwind.
Equities sit in no-man’s-land
The range of outcomes for global stocks is unusually wide, with markets pricing the middle of the distribution. Actual probabilities, however, could be concentrated in the tails. These environments have historically rewarded convexity over conviction.
A final thought
How long the Iran conflict lasts matters more than how it started. Every revision to the market’s expected duration reprices the entire curve (inflation expectations, policy responses, risk premiums) in real time, and U.S. policy targets remain opaque to markets. The 1970s taught investors two things: That supply shocks resolve on their own timeline, not on Washington’s, and that clarity arrives late. The assets that paid you to wait then are paying you to wait now.
10-Year Treasury Yield is the interest rate on U.S. Treasury bonds that will mature 10 years from the date of purchase.
Basis point (bp) equals 1/100 of a percentage point. 1 bp = 0.01%, 100 bps = 1%.
Duration measures a bond price’s sensitivity to changes in interest rates. The longer a bond’s duration, the higher its sensitivity to changes in interest rates and vice versa.
Monetary Policy refers to the policies of a central bank, aimed at influencing the level of inflation and growth in an economy. It includes controlling interest rates and the supply of money.
Real interest rate is a stated interest rate with the rate of inflation removed from it. It reflects the real cost of funds to a borrower and the real yield to a lender or to an investor.
Standard Deviation measures historical volatility. Higher standard deviation implies greater volatility.
These are the views of the author at the time of publication and may differ from the views of other individuals/teams at Janus Henderson Investors. References made to individual securities do not constitute a recommendation to buy, sell or hold any security, investment strategy or market sector, and should not be assumed to be profitable. Janus Henderson Investors, its affiliated advisor, or its employees, may have a position in the securities mentioned.
Past performance does not predict future returns. The value of an investment and the income from it can fall as well as rise and you may not get back the amount originally invested.
The information in this article does not qualify as an investment recommendation.
There is no guarantee that past trends will continue, or forecasts will be realised.
Marketing Communication.