
Key takeaways:
- Credit spreads on CCC rated bonds are elevated historically but investors should not jump to the conclusion that this portends wider economic stress.
- CCC bonds are heavily concentrated within specific sectors and are bifurcated between distressed and performing bonds.
- Separating these parts of the CCC cohort reveals two very distinct groupings, one of which we believe offers selective opportunities for discerning investors.
CCC rated high yield bonds often have a bad press. Forming the lowest quality ratings cohort in high yield bonds, they are an area that many investors shy away from. But as with any wide grouping, there exists a huge discrepancy within the cohort. Far from necessarily being something to avoid, CCC bonds can offer opportunities for those prepared to take a discerning look at what lies beneath.
Exploring the recent repricing
Credit spreads (the difference in yield between a corporate bond and a government bond of similar maturity) have widened significantly in the last few weeks, driven principally by concerns around higher borrowing costs as central bankers have turned more hawkish. The widening has been particularly profound among the lowest quality cohort of high yield – CCC rated bonds. These are bonds that are viewed as having substantial credit risk, typically because of stretched balance sheets or vulnerability to any weakening in business and economic conditions.
CCCs are typically higher beta, i.e. they tend to respond in an outsized way to market movements. This means that given the recent sell-off, CCC has sold off more. At 1,000 basis points, US CCC high yield spreads stand at nominally wide levels historically (see Exhibit 1), having only reached higher levels in recessionary periods and crisis periods such as the 2016 oil price crash, which weighed heavily on the bonds of indebted shale gas producers.
Exhibit 1: Spreads on CCC vs high yield (basis points)
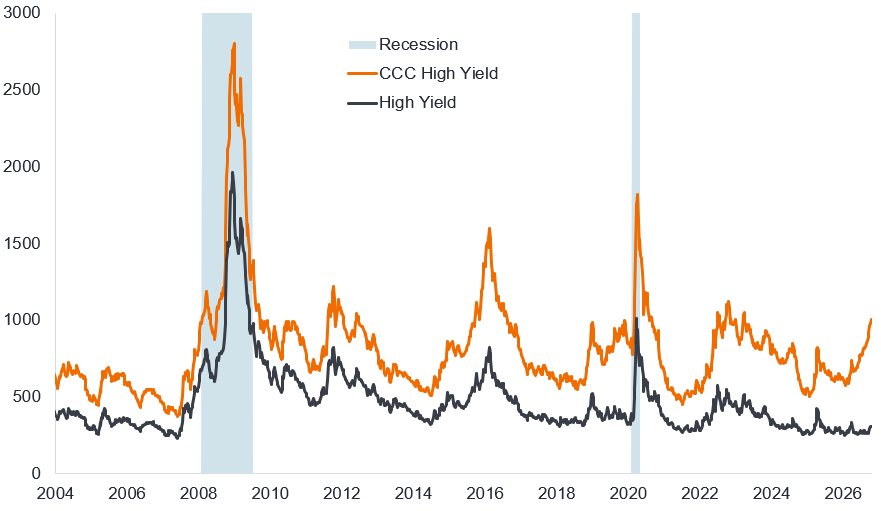
Source: Bloomberg, Bloomberg US Corporate High Yield Index, Bloomberg Caa US High Yield Index, average option adjusted spreads (OAS). Caa and CCC are equivalent. Recession periods reflect National Bureau of Economic Research (NBER) US recession periods. One basis point equals 1/100 of a percentage point. 1 bp = 0.01%; 100 bps = 1%. Data from 1 January 2004 to 9 October 2026. Past performance does not predict future returns.
What is more notable is the relative valuation of CCCs versus the wider high yield index. On a ratio basis, CCC spreads – at 3.25x the spread on the high yield index – are hovering around the widest they have ever been (see Exhibit 2).
Exhibit 2: CCC/High yield spread ratio (multiple)
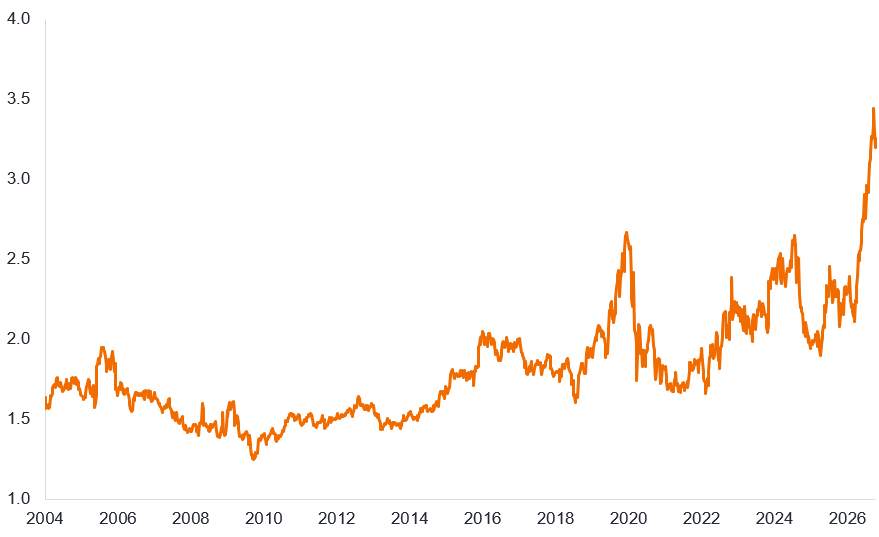
Source: Bloomberg, Bloomberg Caa US High Yield Index OAS/ Bloomberg US Corporate High Yield Index OAS, 1 January 2004 to 9 October 2026. Past performance does not predict future returns.
Sector specifics and corporate idiosyncrasies
Should we be concerned by this move wider in CCC spreads? We think it is misleading to extrapolate too much. The move in CCCs is largely a result of idiosyncratic and sector specific secular issues that are pulling the broader index wider. The CCC index makes up just 8.6% of the US high yield index. Within that, the Pharmaceuticals, Media Entertainment, Wirelines, Cable Satellite, Healthcare Services, Property & Casualty (P&C), Wireless and Software sectors represent the majority of CCCs. Exhibit 3 below highlights the index weights of the top 10 CCC sectors and how only three sectors overlap with the top 10 sectors in US high yield more broadly.
Exhibit 3: Top 10 sector weights in CCC and wider US high yield (HY)
| CCC sector | Weight in US HY (%) | US high yield sector | Weight in US HY (%) |
|---|---|---|---|
| Pharmaceuticals | 0.64 | Technology Services | 6.36 |
| Media Entertainment | 0.57 | Midstream | 5.95 |
| Wirelines | 0.52 | Media Entertainment | 5.02 |
| Cable Satellite | 0.51 | Cable Satellite | 4.43 |
| Healthcare Services | 0.50 | Finance Companies | 4.11 |
| P&C (Insurance) | 0.50 | Healthcare Services | 4.09 |
| Wireless | 0.45 | Retailers | 4.08 |
| Packaging | 0.43 | Chemicals | 3.18 |
| Consumer Cyclical Services | 0.42 | Independent | 3.14 |
| Software | 0.40 | Electric | 3.06 |
| Rest of CCC | 3.64 | Rest of HY | 56.58 |
| Total CCC | 8.58 | Total HY | 100.00 |
Source: Bloomberg, Bloomberg US Corporate High Yield Index, Caa weights and broad sector weights, as of 9 October 2026. Weights may vary over time.
The sectors that have seen the worst performance recently have been the Cable Satellite CCC sector and the Wirelines CCC sector, and are responsible for much of the spread widening within CCC (see Exhibit 4). Many of these sectors within CCC have been plagued with secular decline or disintermediation risk.
Exhibit 4: CCC spreads by sector (basis points)
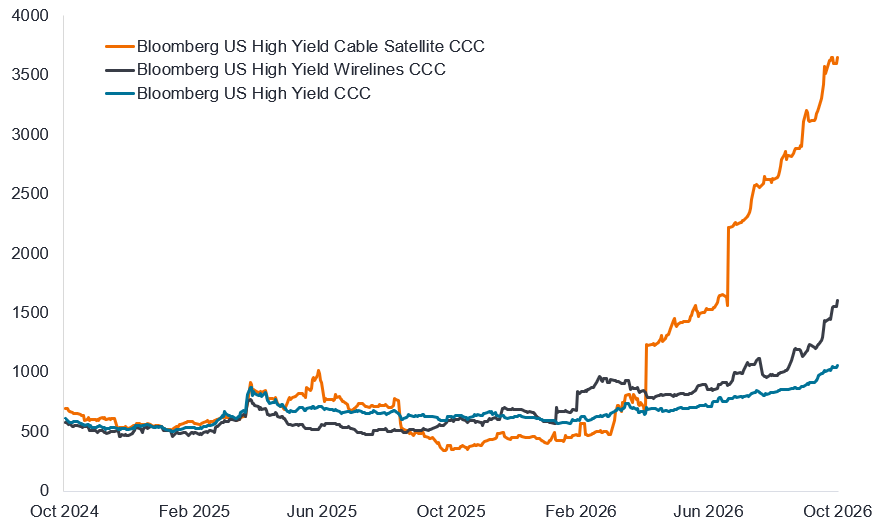
Source: Janus Henderson, Bloomberg, Bloomberg US Corporate High Yield Index, US High Yield Cable Satellite CCC, US High Yield Wirelines CCC, US High Yield CCC, option-adjusted spreads (OAS), 14 October 2024 to 13 October 2026. Past performance does not predict future returns.
What is more, there is often a high level of concentration, reflecting specific pressures on a sector or company. For example, the Cable Satellite CCC sector is dominated by CSC Holdings, a subsidiary of Optimum, a long over-levered cable provider in the US Northeast that has faced increasing competition, resulting in declining revenues. Cable is a pressured high yield segment due to the high capital intensity resulting in high leverage levels, and is now facing secular decline in pricing and volume as customers churn to lower priced alternatives.
The Wirelines and Wireless CCC sectors are dominated by Altice (ALTICE and SFRP tickers) which is associated with CSC Holdings and seeing contagion pressure. Property & casualty (P&C) Insurers have also been facing pressure because of novel concerns around artificial intelligence (AI) disintermediating their business models.
Bifurcation between CCC bonds: performing and distressed
Much like the loan market, the CCC rating cohort is bifurcated between performing bonds (those issuers that albeit facing some pressures should be able to meet their financial obligations) and distressed bonds (those where major concerns exist and default in the short to medium term is probable). The distressed cohort is heavily concentrated in a few issuers who are facing idiosyncratic issues amidst secular decline. As such, we think it is important not to read the elevated CCC spread level as an early indication of broader economic stress to come.
Rather, the spread is factoring the cost of liability management exercise (LME) or bankruptcy of the large capital structures of the more distressed members. In early October 2026 around 20% of the CCC index traded at highly distressed levels of $60 or below (out of a face value of $100). If you take out the distressed bonds in the index trading below $60, the performing side of the index looks quite normal relative to history (see Exhibit 5). That is to say, the performing CCCs trade much like the rest of the high yield market, i.e. somewhat tight versus historical spreads.
Exhibit 5: CCC spreads split into distressed and performing cohorts (basis points)
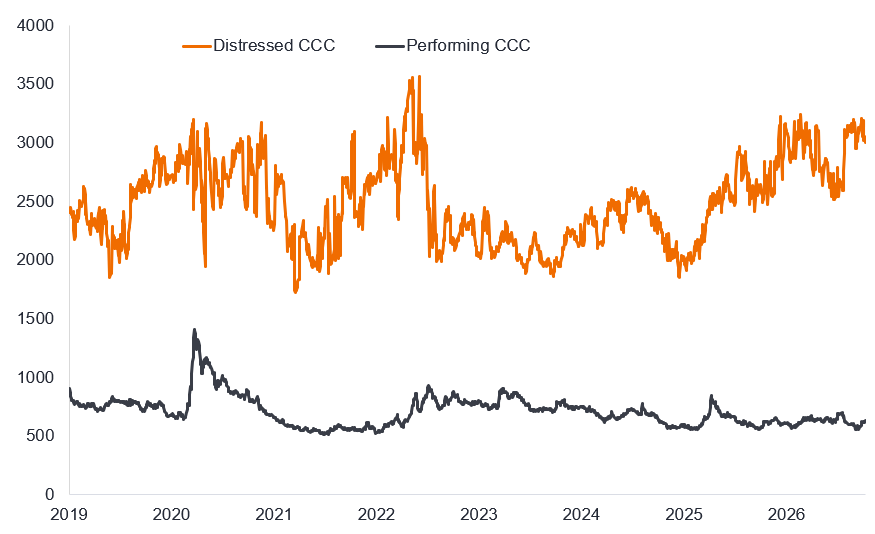
Source: Janus Henderson, Harbour, Bloomberg, Bloomberg US Corporate High Yield Index, option-adjusted spreads (OAS), daily market value weighted OAS for US HY CCC-or-below constituents split by price: distressed = bonds trading below $60 (out of face value of $100) and performing = bonds trading above $60. Bonds trading at exactly $60 are excluded from the two price cohorts. Data from 1 January 2019 to 7 October 2026. Past performance does not predict future returns.
The CCC index has also become more consolidated over time, declining from around 14% of the high yield index in 2016 to around 8.5% today.1 This reflects several factors:
- Bonds that have moved up to higher ratings as their credit quality has improved;
- Borrowers using other markets such as private credit; and
- Few new entrants as a favorable economic backdrop has kept bonds out of this cohort.
Of course, we have to be mindful of survivorship bias within an index, i.e. CCC can also shrink because issuers default and exit the index.
Being selective
In summary, for the most part, we do not view the distressed component of CCCs as attractive investment opportunities. Many are mired in long legal battles between creditors (who may choose to act collectively using creditor cooperation agreements) and the issuer. This is a costly game of brinkmanship in which personalities and leverage (by which we mean influence) can win over fundamentals. We do not view this as an efficient risk-adjusted use of capital.
Instead, we find plenty of opportunities across performing CCCs and when investing in this part of the high yield market seek to invest opportunistically in borrowers with solid business models and attractive risk-adjusted situations.
In part two we will look at why we believe there is value within parts of the CCC market and highlight some of the factors we use to discriminate between credits in this cohort.
1 Source: Bloomberg, Bloomberg US Corporate High Yield Index, Bloomberg Cas US High Yield Index, market value in US dollars, as of 13 October 2016 and 13 October 2026.
There is no guarantee that past trends will continue, or forecasts will be realised.
References made to individual securities do not constitute a recommendation to buy, sell or hold any security, investment strategy or market sector, and should not be assumed to be profitable. Janus Henderson Investors, its affiliated advisor, or its employees, may have a position in the securities mentioned.
Fixed income securities are subject to interest rate, inflation, credit and default risk. The bond market is volatile. As interest rates rise, bond prices usually fall, and vice versa. The return of principal is not guaranteed, and prices may decline if an issuer fails to make timely payments or its credit strength weakens.
High-yield or “junk” bonds involve a greater risk of default and price volatility and can experience sudden and sharp price swings.
Bloomberg US Corporate High Yield Index: This index measures the US dollar denominated high yield, fixed rate corporate bond market.
Bloomberg Caa US High Yield Index: This index measures the US dollar denominated, Caa-rated, fixed rate high yield corporate bond market. CCC sectors mentioned are subsets of this.
Balance sheet: A financial statement that summarizes a company’s assets, liabilities and shareholders’ equity at a particular point in time. Each segment gives investors an idea of what the company owns and owes, as well as the amount invested by shareholders.
Basis point (bp): One basis point equals 1/100 of a percentage point. 1 bp = 0.01%; 100 bps = 1%.
Beta: A measure of the relationship that a portfolio or security has with the overall market. A beta above 1 indicates that it is likely to move more than the market average, while a beta below 1 indicates that it is theoretically less volatile than the market.
Bond: A debt security issued by a company or government as a way of raising money. The investor purchasing the bond is effectively lending money to its issuer. Bonds offer investors fixed periodic payments and the eventual return at maturity of the original amount invested.
Bond yield: The level of income on a security expressed as a percentage. For a bond, it is calculated as the coupon payment divided by the current bond price. Bond yields and bond prices have an inverse relationship.
Borrowing: Where a company, individual or government temporarily takes on debt to fund spending or investment in exchange for remuneration, usually income.
Capital structure: The amount of debt and/or equity used by a company to fund its operations and finance its assets. The optimal capital structure is the proportion of debt and equity that results in the lowest weighted average cost of capital.
Cooperation agreement: An agreement among an ad hoc group of lenders (e.g. bondholders), whereby these lenders unite with the aim of obtaining a favorable restructuring transaction with a stressed or distressed borrowing company.
Corporate bond: A bond issued by a company. Bonds offer investors periodic payments and the eventual return of the original money invested at issue on the maturity date.
Credit rating: An independent assessment of a borrower’s creditworthiness by a recognized agency such as Standard & Poor’s, Moody’s or Fitch. Standardized scores such as AAA or B are used, although agencies may present their ratings in different formats. CCC is the lowest rating cohort for high yield bonds.
Credit risk: The risk that a borrower will default on its contractual obligations to make the required interest payments or repay a loan.
Credit spread: The difference in yield between securities of similar maturity but different credit quality, often used to describe the difference in yield between corporate and government bonds. Widening spreads generally indicate deteriorating creditworthiness, while narrowing spreads indicate improvement.
Default: The failure of a debtor, such as a bond issuer, to pay interest or return an original amount loaned when due.
Disintermediation: The process of removing intermediaries or middlemen (such as wholesalers, retailers or brokers) from a transaction.
Distressed debt: A security issued by a company that is either in default or at high risk of default and involves significant investment risk.
Hawkish/dovish: Hawkish indicates that policymakers are looking to tighten financial conditions, such as by supporting higher interest rates to curb inflation. Dovish describes policymakers loosening policy, such as cutting interest rates to stimulate the economy.
High-yield bond: A bond with a lower credit rating than an investment-grade bond, also known as a sub-investment-grade or junk bond. These bonds usually carry a higher risk of default, so they are typically issued with a higher interest rate to compensate for the additional risk.
Idiosyncratic risk: Factors that are specific to a particular company and have little or no correlation with market risk.
Index: A statistical measure of a group or basket of securities or other financial instruments. Each index has its own calculation method, usually expressed as a change from a base value.
Leverage: The use of borrowing to increase exposure to an asset or market. Leverage can also refer to the ratio of a company’s debt to its equity. Higher leverage equates to higher debt levels.
Liability management exercise: A transaction, or series of transactions, in which a borrower restructures existing debt, such as by extending maturity or reducing interest costs, outside of formal default or bankruptcy proceedings.
Maturity: The date when a bond’s principal investment and any final coupon are paid to investors. Shorter-dated bonds generally mature within five years, medium-term bonds within five to ten years and longer-dated bonds after more than ten years.
Option-adjusted spread (OAS): The yield spread between two bonds or securities after accounting for the value of additional rights embedded in their structures. It represents the compensation investors might expect for credit or liquidity risk.
Par value: The original value of a security, such as a bond, when it is first issued. Bonds are usually redeemed at par value when they mature.
Private credit: Non-bank lending where the debt is not issued or traded on public markets.
Recession: A sustained decline in economic activity, usually perceived as two consecutive quarters of economic contraction.
Relative valuation: Comparing the price of an asset with the market value of similar assets.
Risk-adjusted return: An investment’s return or potential return after taking into account the amount of risk required to achieve it.
Secular: A persistent or long-term trend within a sector or part of the economy. These trends move over extended periods, typically independent of the general direction of the economy.
Ticker: An abbreviation used to uniquely identify publicly traded bonds of a particular company.
Yield: The level of income on a security over a set period, typically expressed as a percentage. For a bond, in its simplest form, it is calculated as the coupon payment divided by the current bond price.
These are the views of the author at the time of publication and may differ from the views of other individuals/teams at Janus Henderson Investors. References made to individual securities do not constitute a recommendation to buy, sell or hold any security, investment strategy or market sector, and should not be assumed to be profitable. Janus Henderson Investors, its affiliated advisor, or its employees, may have a position in the securities mentioned.
Past performance does not predict future returns. The value of an investment and the income from it can fall as well as rise and you may not get back the amount originally invested.
The information in this article does not qualify as an investment recommendation.
There is no guarantee that past trends will continue, or forecasts will be realised.
Marketing Communication.