
Key takeaways:
- Global equities delivered mixed results in June, with Europe outperforming U.S. and Asian markets. Signs of broadening leadership were evident as cyclical sectors, value stocks, and small caps outperformed.
- Global sovereign bonds posted modest gains as yields declined across most major markets, while corporate bonds remained resilient despite modest spread widening.
- Markets navigated a month marked by divergence within the AI trade, falling oil prices following the U.S.-Iran agreement, a record-setting period for equity issuance led by SpaceX, and signs of broadening leadership beyond the dominant technology stocks.
Market overview
Global equities delivered mixed performance in June, with the MSCI World Index falling 0.7% in U.S. dollar terms as a pullback in mega-cap technology companies offset strength across cyclical- and value-oriented areas of the market. Europe outperformed – particularly in local currency terms – while U.S. large-cap benchmarks and Asia Pacific markets lagged. Global government bonds posted modest gains as sovereign yields moved lower across most regions, though U.S. Treasury yields shifted higher at the front end of the curve. Global corporate bonds were broadly resilient despite modest spread widening. Currency-hedged benchmarks posted positive returns, while a stronger U.S. dollar weighed on unhedged global investment-grade results.
Oil prices declined sharply after the U.S. and Iran signed a memorandum of understanding (MOU) that reopened the Strait of Hormuz and reduced concerns about energy supply disruptions. Brent and WTI both fell roughly 20% during the month, extending May’s declines. The U.S. Dollar Index advanced by 2.3% against a basket of major currencies. Gold fell roughly 12%, pressured by dollar strength and a hawkish repricing of Federal Reserve rate expectations.
European equities outperformed U.S. and Asian markets in June
A pullback in mega-cap technology weighed on major U.S. benchmarks.
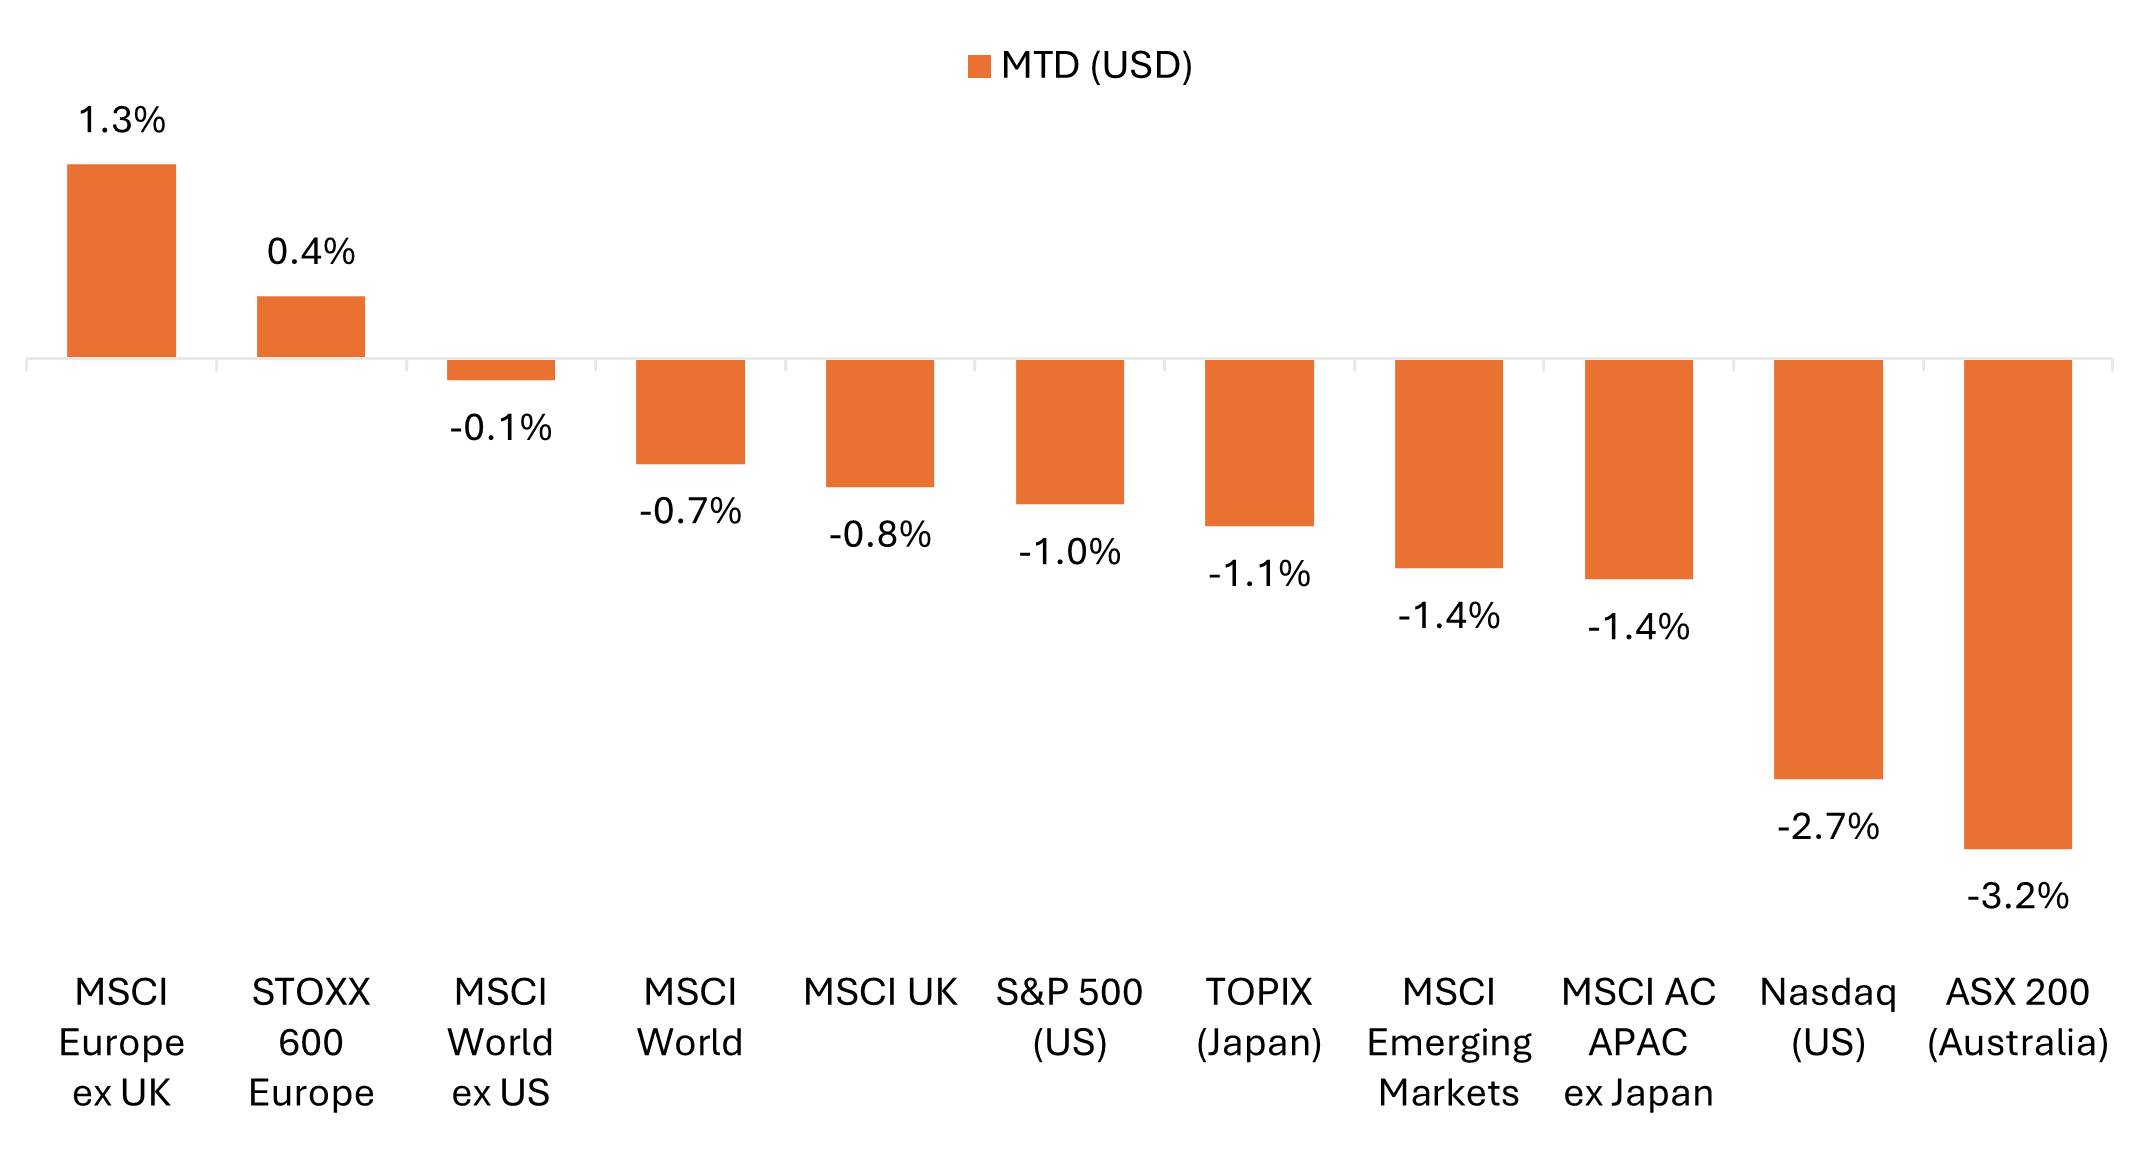
Source: Bloomberg, data from 31 May 2026 to 30 June 2026. Represents index total returns in U.S. dollar terms. Past performance is no guarantee of future results.
Key themes that mattered for markets
- AI enthusiasm met AI volatility (and AI bifurcation): After the big rally in chipmakers and stocks at the heart of the AI buildout over the prior two months, June was marked by large price swings. The PHLX Semiconductor Index (SOX) recorded nine daily moves of more than 5% (in either direction) but still posted a third consecutive month of strong gains. In contrast, shares of the largest hyperscalers fell amid renewed scrutiny around the return on investment (ROI) of outsized AI-related capital spending.
- Iran-U.S. formal MOU: The U.S. and Iran signed a long-anticipated memorandum of understanding (MOU) on June 18, which included reopening the Strait of Hormuz and initiating a 60-day window to continue negotiations. Oil prices fell roughly 20%, with WTI crude finishing the month just below $70 and Brent in the low $70s, back near pre-conflict levels. However, the situation remained tenuous, as the two sides exchanged military strikes in late June before a subsequent agreement to halt fighting and resume talks.
- Sector rotation and signs of broadening: While the AI trade took a breather in June, signs of broadening emerged across global equity markets. European equities outperformed as lower oil prices eased stagflation concerns, and the U.S. saw small-cap and equal-weight benchmarks notably outperform large caps. Value beat growth, and the healthcare sector recorded its best month since November, while financials and industrials posted strong monthly gains.
- SpaceX IPO headlined a busy month for equity issuance: At $86 billion, the June 12 debut marked the largest initial public offering (IPO) in history, kicking off what many expect to be a wave of large-cap listings. Google parent Alphabet also raised nearly $85 billion in a landmark equity offering, contributing to U.S. IPO and secondary share sales topping $250 billion in the first half of 2026, a new half-year record.[1] Meanwhile, OpenAI is reportedly leaning toward waiting until 2027, leaving Anthropic as the next likely mega-cap AI company to go public.
United States
U.S. equities delivered mixed results in June as market leadership broadened beyond the technology sector. The S&P 500 declined modestly, while equal-weight and small-cap benchmarks advanced, reflecting a rotation toward cyclical and value-oriented segments of the market. June saw a divergence within the AI trade, with semiconductor stocks continuing to benefit from robust demand while the hyperscalers funding much of the AI buildout came under pressure.
- The S&P 500® Index fell 0.7% in June but still delivered a 15.3% gain for the second quarter, its largest quarterly gain in six years.
- The S&P 500 Equal Weight Index advanced 2.4%, ending the first half of 2026 up 12.1% on the year, nearly two percentage points ahead of the official cap-weighted benchmark.
- The Nasdaq Composite fell 2.7%, though it closed the second quarter with a 21.6% quarterly gain – its largest since June 2020.
- The small-cap Russell 2000 rose 3.7%, ending the month up nearly 23% on the year, capping its best first-half performance since 1991.
- Value outperformed growth, with the Russell 1000 Value Index gaining 2.3%, while the Russell 1000 Growth Index fell 2.7%. Beyond large caps, the Russell 2500 Value Index rose 4.2%, while its growth counterpart advanced a more modest 2.5%.
- AI divergence: The PHLX Semiconductor Index (SOX) rose 11%, capping a record 88% quarterly gain, while the Magnificent 7 cohort experienced its largest monthly decline in more than a year.
Industrials, healthcare, and financials outperformed as technology cooled
S&P 500 sector performance (June and year to date)
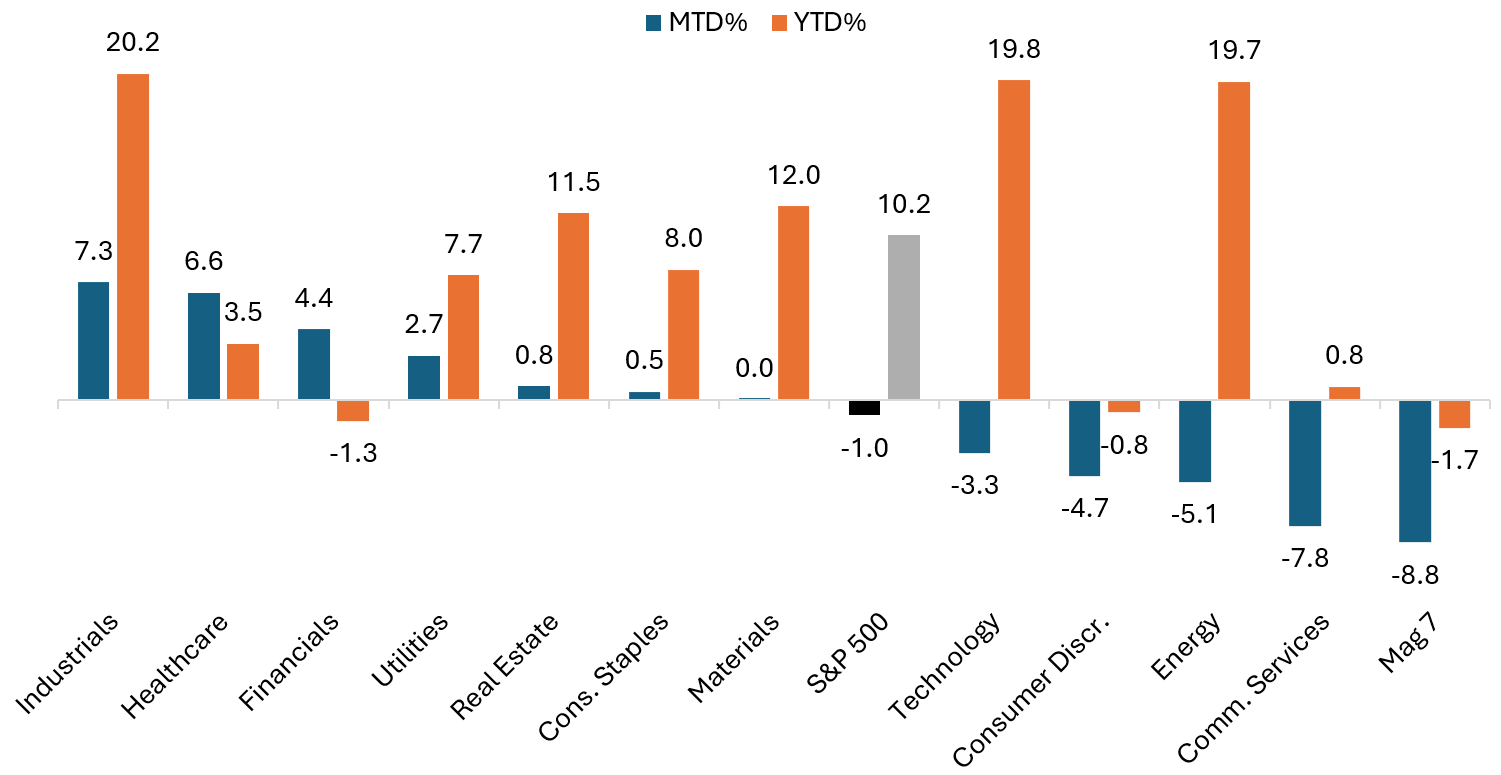
Source: Bloomberg, as of 30 June 2026. Mag 7 stocks represented by the Bloomberg Magnificent 7 Total Return Index. Past performance is no guarantee of future results.
U.S. economic data signaled continued resilience, even as inflation pressures remained elevated, while the Federal Reserve entered a new phase under Chair Kevin Warsh:
- The Federal Reserve (Fed) held its benchmark rate steady in the 3.5% to 3.75% range, as expected. Updated projections showed a higher path for interest rates, prompting a hawkish shift in market expectations, with a 25 basis-point (bp) rate hike fully priced in by October. In his first meeting as Fed Chair, Kevin Warsh moved to scrap forward guidance and launched a series of task forces to reassess the Fed’s policy framework.
- Labor market data remained firm. Nonfarm payrolls rose by 172,000 in May, well above expectations, while the unemployment rate held steady at 4.3%. Combined upward revisions to prior months reinforced the view that hiring has remained resilient.
- Inflation readings were mixed but continued to point to sticky underlying pressures. The Consumer Price Index (CPI) rose 4.2% year over year in May, up from the prior month’s 3.8% and the highest since April 2023. Meanwhile, the Producer Price Index (PPI) jumped 1.1% month over month, exceeding expectations. However, core measures showed some moderation, and May PCE inflation came in broadly in line with forecasts.
- Activity data showed continued expansion, alongside softer employment and still-elevated input costs. S&P Global flash June Purchasing Managers’ Index (PMI) signaled faster overall growth, with the composite PMI rising to 52.2 (from 51.5 in May). The manufacturing PMI climbed to 55.7, its highest level since May 2022, while the services PMI rose to 51.3 (from 50.7).
- The final estimate of U.S. Gross Domestic Product (GDP) growth for the first quarter was revised up to 2.1% (from 1.6%), suggesting the year got off to a stronger start than previously reported.
Europe
Eurozone equities outperformed most major developed markets in June as falling oil prices eased inflation concerns and supported rotation into more economically sensitive sectors. The MSCI Europe ex United Kingdom Index rose 3.6% in euro terms and 1.3% in U.S. dollars. The benchmark posted a more than 14% gain for Q2 in local currency terms, its best quarterly performance since 2020. Although economic data remained mixed, investors increasingly focused on easing inflation risks and improving earnings expectations.
- The European Central Bank (ECB) raised interest rates by 25 bps, as expected, at their June meeting – the first increase since 2023 – citing persistent inflation pressures, particularly those linked to earlier energy price increases.
- Eurozone inflation remained elevated in May. Headline CPI was confirmed at 3.2% year over year, while core CPI came in at 2.6% YoY, both unchanged from Eurostat’s initial estimate. However, the agency’s flash estimate for June, released on July 1, pointed to headline CPI cooling to 2.8% and core CPI to 2.4%.
- Eurozone PMI data suggested that private sector contraction eased in June, though activity remained subdued overall. The flash composite PMI rose to 49.5 (from 48.5 in May), while the services PMI improved to 48.9 (from 47.7) but remained in contraction territory. Manufacturing PMI remained in expansion, though it fell to a four-month low of 51.3 (from 51.6).
- Final first quarter GDP was revised down to show a contraction of 0.2%, from an initially reported 0.1% expansion. However, the decline was driven in part by a sharp contraction in Ireland (-12%), masking positive growth across Germany (+0.3%), Spain (+0.6%), and Italy (+0.3%), though France contracted modestly (-0.1%).
UK equities underperformed continental Europe during June, reflecting both sector composition and ongoing political uncertainty. The MSCI United Kingdom Index rose 0.8% in sterling terms in June but declined 0.8% in U.S. dollars as the greenback strengthened. The FTSE All-Share Index gained 0.7% in sterling but fell 0.9% in U.S. dollar terms. Weakness in materials and energy stocks weighed on broader benchmark performance.
- The Bank of England (BoE) remained on hold, with the Monetary Policy Committee voting 7-2 to keep its benchmark rate at 3.75%, as expected, while maintaining a cautious stance amid ongoing inflation concerns.
- UK inflation surprised modestly to the downside, with headline CPI holding steady at 2.8% year over year in May, below expectations for an increase to 3.0%.
- Labor market data showed signs of resilience. The UK unemployment rate fell to 4.9%, coming in below forecasts and suggesting labor market conditions have remained relatively firm.
- Economic growth indicators weakened at the margin. The UK economy contracted by 0.1% in April, marking its first monthly decline since August 2025. However, this followed solid growth to start the year, with first quarter GDP confirmed at 0.6% quarter over quarter.
- PMI data pointed to continued softness in activity. The flash June composite PMI fell to 49.4 (from 49.7 in May), while the services PMI declined to 48.7 (from 49.3), both remaining in contraction territory and below expectations.
- UK political uncertainty remained elevated. Andy Burnham’s landslide victory in the Makerfield by-election paved the way for a Labour leadership challenge, ultimately prompting Prime Minister Keir Starmer’s resignation on June 22. Burnham, widely seen as the frontrunner to become the UK’s seventh PM in the last 10 years, later reassured investors by emphasizing a commitment to the UK’s fiscal rules.
European equities put in mixed performance in June
Performance was notably stronger in local currency terms as the U.S. dollar strengthened.
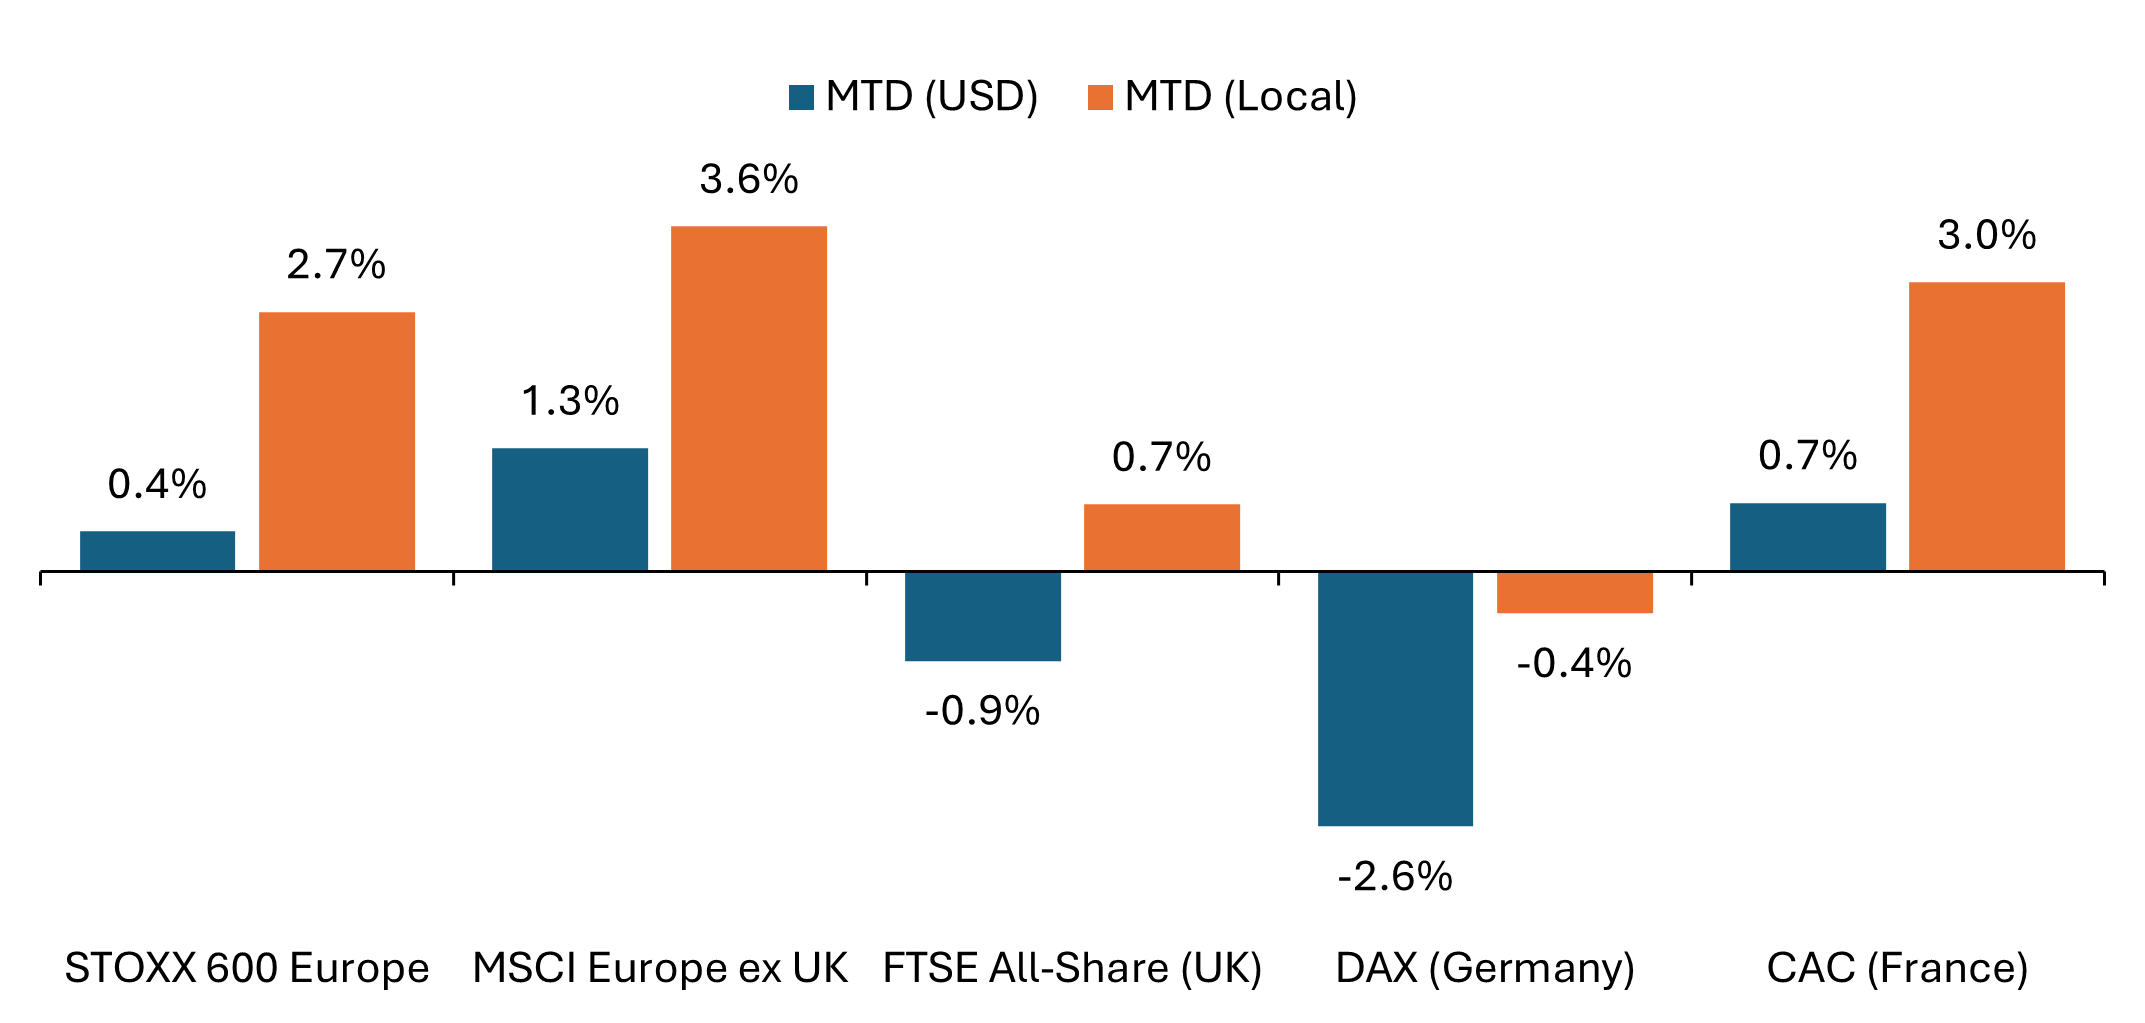
Source: Bloomberg, data from 31 May 2026 to 30 June 2026. Past performance is no guarantee of future results.
Across the STOXX 600 Index – comprising companies from 17 countries across developed Europe including the UK – sector performance was mixed.
- Travel & Leisure (+7.6% in euro terms) was the strongest-performing sector, as lower fuel costs improved the outlook for airlines and travel companies. Insurance (+6.5%) and Banks (+6.4%) also outperformed, while Technology (+5.0%) benefited from continued strength in AI-related semiconductors and equipment suppliers.
- Among more defensive sectors, Utilities (+4.7%), Personal Care, Drug & Grocery (+4.6%), Health Care (+4.4%), and Food, Beverage, & Tobacco (+4.3%) delivered strong monthly performance.
- Falling oil prices supported consumer-oriented segments, with Retail (+4.0%) and Consumer (+2.3%) higher on the month.
- Other cyclical segments delivered more modest gains, with Industrials (+1.3%), Chemicals (+1.1%), and Construction & Materials (+0.8%) advancing.
- Among the month’s laggards, Energy (-4.8%) declined amid the sharp drop in crude prices. Autos & Parts (-8.5%) fell as investors remained concerned about pricing pressures and competition from Chinese manufacturers. Basic Resources (-9.7%) declined alongside softer commodity prices. Telecommunications (-9.9%) was the month’s weakest-performing sector.
Asia Pacific
Japanese equities advanced in local currency terms, with the Nikkei 225 capping off a record quarterly gain, though a weaker yen weighed on returns in U.S. dollar terms. The TOPIX gained 1.0% in yen terms but declined 1.1% in U.S. dollars. Meanwhile, the Nikkei 225 rose 5.7% in local currency terms and 3.5% in dollars, with the price-weighted benchmark notably outperforming the market cap-weighted TOPIX for a third consecutive month.
- The Bank of Japan raised its benchmark rate by 25 bps to 1.0%, the highest since 1995, while signaling plans to scale down purchases, reinforcing expectations for a continued normalization of monetary policy. Current market pricing points to expectations for an additional rate hike toward the end of this year.
- Inflation pressures remained elevated at the wholesale level, with Japan’s producer prices rising 6.3% year over year in May, the fastest pace in three years, driven in part by higher energy costs. In contrast, headline CPI rose a more modest 1.5% year over year.
- The Japanese yen weakened significantly, falling to its lowest level in 40 years against the U.S. dollar and breaking through the 162 level. Japan’s Finance Minister said the government stands ready to take appropriate action, keeping the potential for currency intervention firmly in focus.
Equity markets across Asia Pacific ex Japan were mixed, with sharp swings in AI-related chipmakers and memory names a defining feature of June. The MSCI AC Asia Pacific ex Japan Index declined 1.4% in U.S. dollar terms, with tech-heavy markets such as South Korea and Taiwan delivering muted returns after surging in May. Chinese equities remained under pressure amid continued concerns around weak consumer demand and slowing economic activity. The MSCI China Index fell 7.1% in U.S. dollar terms and ended the first half down nearly 15% on the year. Australia’s ASX 200 rose 0.7% in local currency terms but fell 3.2% in U.S. dollar terms, reflecting a sharp depreciation in the Australian dollar over the month. The Reserve Bank of Australia (RBA) held rates steady following three consecutive hikes, as policymakers assessed the impact of previous tightening on inflation and economic activity.
Emerging Markets
Emerging market equities declined modestly in June after strong gains over the prior two months. The MSCI Emerging Markets Index fell 1.4% in U.S. dollar terms but still managed a 24% quarterly gain for the second quarter – its strongest quarterly return since 2009. Performance figures below reference MSCI country indices reported in U.S. dollar terms.
- Taiwan rose 1.4% in June while South Korea eked out a 0.1% monthly gain. Shares of several large semiconductor and memory companies experienced large swings as investors digested the rapid price increases through May. Indonesia fell 9.1%, ending the month down 41% on the year, as investors remained concerned about policy direction and currency stability.
- The mid-month U.S.-Iran agreement and reopening of the Strait of Hormuz reduced concerns around higher energy prices, providing support for oil-importing markets such as India (+1.5%) and the Philippines (+8.3%).
- Latin America equities were mostly lower. Argentina fell 7.8%, while Mexico and Brazil declined 3.1% and 2.8%, respectively. Colombia bucked the trend with a 12.4% monthly gain.
- In EMEA, performance was mixed. South Africa declined 6.8% as a sharp decline in gold and base metal prices weighed on the mining sector. Poland fell 5.4% in U.S. dollar terms, with the move largely driven by local currency depreciation, while Turkey gained 1.4%.
Fixed Income
Global government bonds delivered modest positive returns in June despite significant shifts in central bank expectations. The Bloomberg Global Treasury Index returned 0.4% in U.S. dollar-hedged terms. Government bond yields generally declined across developed markets as lower oil prices reduced inflation concerns, although U.S. Treasury yields shifted higher at the front end of the curve.
- The Bloomberg Global Treasury Index gained 0.4% in U.S. dollar-hedged terms.
- The U.S. Treasury curve shifted higher at the front end, continuing the recent flattening trend. The spread between 10-year and 2-year yields narrowed meaningfully from 47 bps at the start of the month to 30 bps at the end of June.
- The U.S. 10-year Treasury yield ended June at 4.44%, essentially unchanged from the prior month, though longer-dated yields edged lower as falling oil prices helped ease inflation concerns.
U.S. Treasury yield curve (month-on-month change)
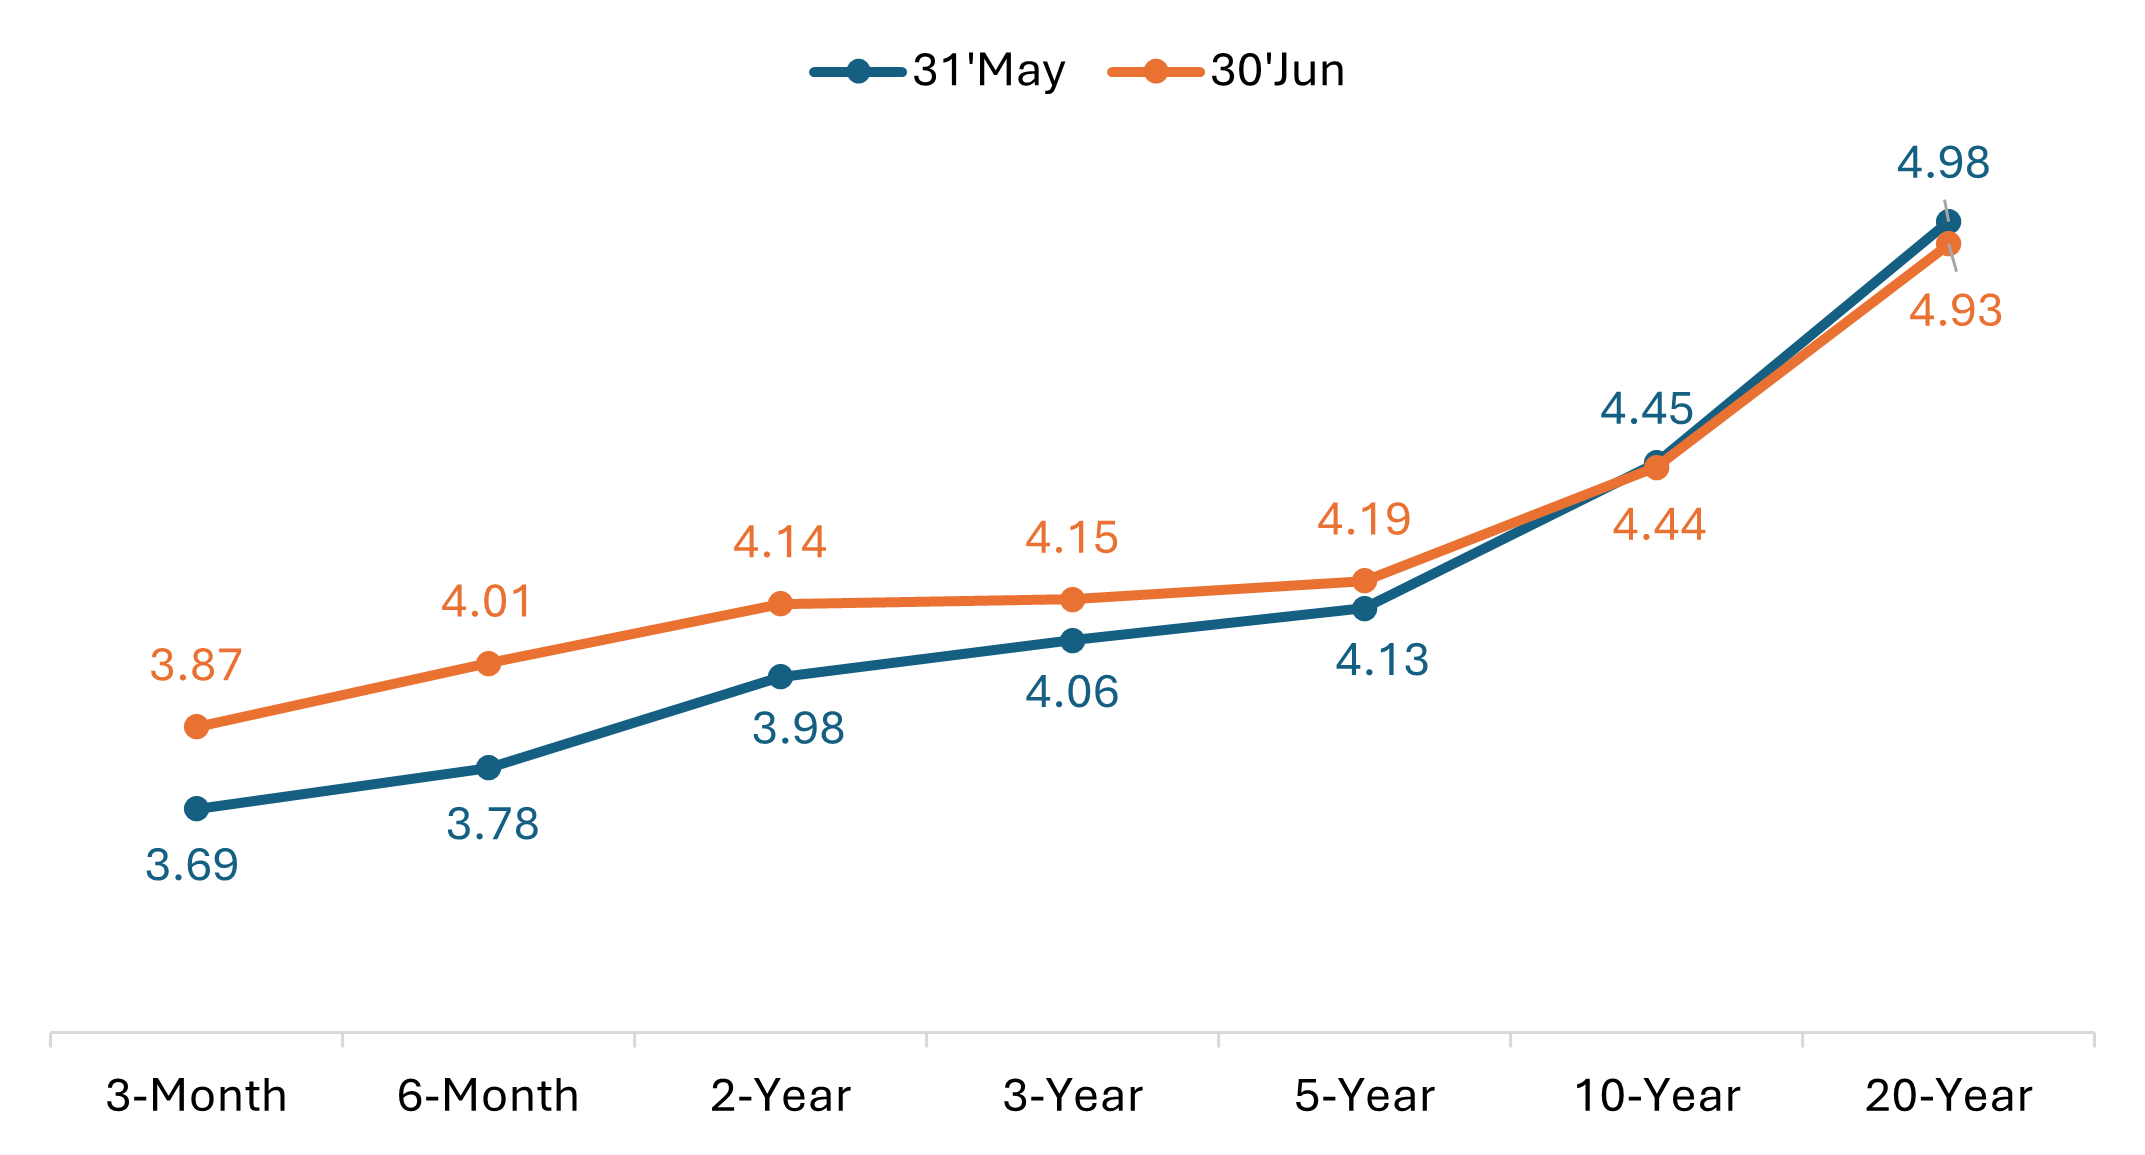
Source: Bloomberg, as of 30 June 2026. Past performance is no guarantee of future results.
- In Europe, UK government bonds delivered positive returns as gilt yields declined. The 10-year gilt yield fell roughly 6 bps over the month to 4.76%.
- German sovereign bonds also benefited from lower yields, with the 10-year bund yield declining by approximately 8 bps.
- Japanese government bonds (JGB) were little changed as the Bank of Japan raised its benchmark rate to 1.0% in a continuation of gradual policy normalization. The yield on the 10-year JGB increased by roughly 3 bps to 2.69%.
Spread sectors delivered positive returns in June, though credit spreads widened modestly as volatility increased across risk assets. That said, corporate spreads remain historically tight, and both high-yield and investment grade (IG) bonds have seen spreads narrow over the past three months.
- The Bloomberg Global Aggregate Corporate Index returned 0.3% in U.S. dollar-hedged terms, while the Bloomberg Global High Yield Index gained 0.6% on a hedged basis.
- Global investment-grade spreads widened by approximately 2 bps, while high-yield spreads widened by roughly 3 bps.
- U.S. investment-grade corporates, as measured by the Bloomberg U.S. Corporate Index, returned 0.2%, compared to 0.3% for high yield.
- U.S. investment-grade spreads widened by approximately 2 bps in June. U.S. high-yield spreads widened by roughly 13 bps.
- In securitized markets, spreads of asset-backed securities (ABS) and mortgage-backed securities (MBS) widened by roughly 2 bps, while benchmarks still delivered modestly positive monthly returns.
Central Bank Watch
June brought a busier slate of major central bank meetings, with policymakers broadly maintaining a cautious stance focused on containing inflation pressures, even as a mid-month U.S.-Iran memorandum of understanding (MoU) helped further ease oil prices. Among the highlights, the European Central Bank (ECB) announced its first rate increase since 2023, while the Federal Reserve held rates steady but with the committee and new Chair Kevin Warsh leaning more hawkish than markets expected. The Bank of Japan also raised rates in June in a continuation of its gradual policy normalization.
- Bank of Canada (June 10): The BoC held its policy rate at 2.25% for a fifth consecutive meeting, as widely expected. Governor Macklem described the economy as “weak” and acknowledged recent GDP contraction, while warning that the Iran conflict presented a two-sided policy dilemma.
- European Central Bank (June 11): The ECB raised its deposit rate by 25 basis points (bps) to 2.25%, its first increase since 2023, citing inflation risks that could not be waited out. President Lagarde pushed back on characterizations of the move as a one-off, while some Governing Council members signaled readiness to hike again in July. However, by late June the Iran MoU and falling oil prices had cooled those expectations, with less than 25 bps of further tightening priced in for the remainder of 2026.
- Bank of Japan (June 16): The BOJ raised its benchmark rate by 25 bps to 1.0%, the highest level since 1995, in a broadly expected move. The central bank also outlined plans to scale back bond purchases over time as it continues a gradual shift away from ultra-easy policy. Market consensus is pricing further hikes, with another expected by December.
- Reserve Bank of Australia (June 16): The RBA held its cash rate at 4.35%, marking its first pause after three consecutive hikes, though retained a conditional tightening bias. Governor Bullock cited early signs that prior increases are working to cool the economy, while underlying inflation remains above target, keeping the door open to further rate hikes.
- U.S. Federal Reserve (June 17): The FOMC held its benchmark rate in the 3.50%-3.75% range, but the meeting’s “dot plot” revealed a more hawkish-than-expected committee: nine of 18 officials penciled in at least one 25 bp hike in 2026. Kevin Warsh’s first meeting as Chair marked a shift in both style and substance, as the Fed moved away from forward guidance and launched a series of internal reviews aimed at reassessing its policy framework and communication approach.
- Bank of England (June 18): The BoE held its bank rate at 3.75% for a fourth consecutive meeting in a 7-2 vote, with two members dissenting in favor of an immediate hike to 4.0%. Governor Bailey noted the “marked fall in energy prices” following the Iran MoU as an encouraging development, while household inflation expectations fell sharply in June back toward pre-conflict levels.
- Other central banks: Beyond G7 countries, June meetings reflected a mix of policy stances. Poland (June 2) held at 3.75% with Governor Glapinski striking a less hawkish tone after May inflation unexpectedly cooled. The Reserve Bank of India (June 5) held at 5.25% in a unanimous decision, retaining a neutral policy stance. Indonesia delivered two additional hikes in rapid succession – an off-cycle 25 bp increase on June 9 to 5.50%, followed by a scheduled 25 bp hike on June 18 to 5.75% – framing both as defensive moves to stabilize its currency. Sweden’s Riksbank (June 17) held at 1.75% for a sixth consecutive meeting but shifted guidance to reflect a higher probability of a hike later in 2026, while Norway (June 18) held at 4.25%, following a 25 bp hike in May, but signaled another hike would likely be necessary at one of the forthcoming meetings. The Swiss National Bank (June 18) held at 0% for a fourth consecutive meeting, raising its near-term inflation forecasts modestly while reiterating its increased readiness to intervene in the franc if needed. The People’s Bank of China (June 22) left its one-year and five-year loan prime rates unchanged at 3.0% and 3.5% respectively, for a thirteenth consecutive month. Hungary (June 23) bucked the global tightening trend with a 25 bp rate cut to 6.0%, after inflation fell below its target in May. Mexico (June 25) held at 6.50%, as expected, and signaled an extended pause.
Key events on tap in July
- July 1 – Global Manufacturing PMIs (June, final)
- July 2 – U.S. Nonfarm Payrolls, Unemployment Rate (June)
- July 3 – Global Services and Composite PMIs (June, final)
- July 14 – U.S. Consumer Price Index (June)
- July 15 – Bank of Canda (BoC) Rate Decision
- July 17 – Eurozone Consumer Price Index (June, final)
- July 23 – European Central Bank (ECB) Rate Decision
- July 22 – UK Consumer Price Index (June)
- July 24 – Global PMIs (July, flash estimate)
- July 29 – FOMC (Fed) Rate Decision
- July 30 – Eurozone Gross Domestic Product (Q2, advance)
- July 30 – Bank of England (BoE) Rate Decision
- July 30 – U.S. Gross Domestic Product (Q1, advance)
- July 31 – Bank of Japan (BoJ) Rate Decision
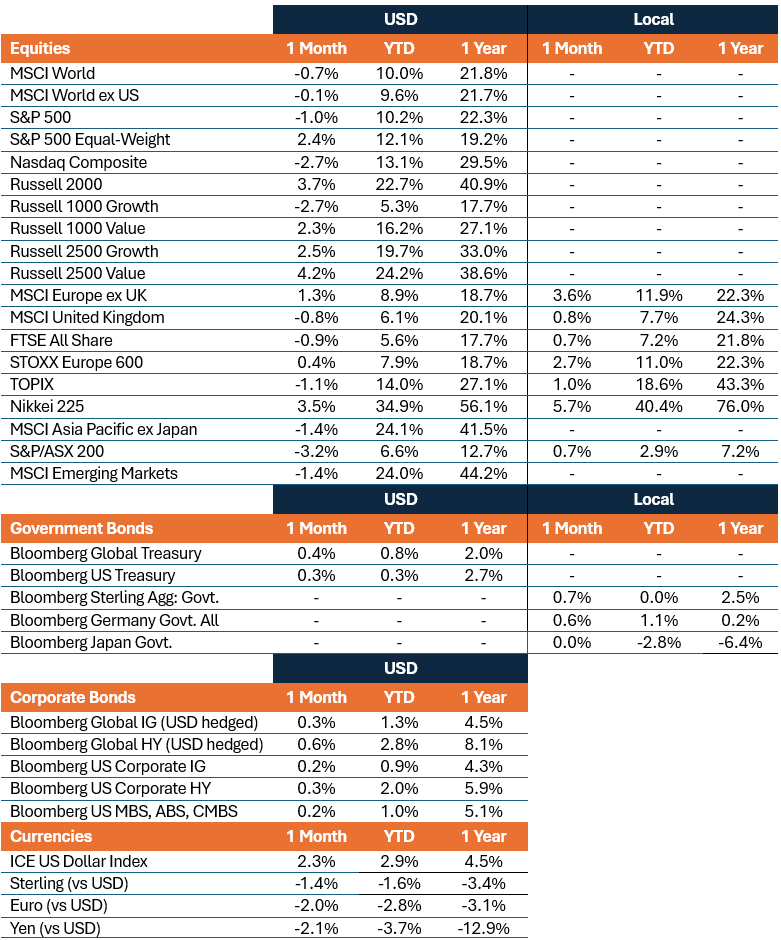
Market Performance
Total returns (%), periods ended June 30, 2026
[1] Source: Bloomberg, “SpaceX Pushes US Share Sales to Record $251 Billion at Midyear”, 29 June 2026.
IMPORTANT INFORMATION
Artificial intelligence (“AI”) focused companies, including those that develop or utilize AI technologies, may face rapid product obsolescence, intense competition, and increased regulatory scrutiny. These companies often rely heavily on intellectual property, invest significantly in research and development, and depend on maintaining and growing consumer demand. Their securities may be more volatile than those of companies offering more established technologies and may be affected by risks tied to the use of AI in business operations, including legal liability or reputational harm.
Equity securities are subject to risks including market risk. Returns will fluctuate in response to issuer, political and economic developments.
Fixed income securities are subject to interest rate, inflation, credit and default risk. As interest rates rise, bond prices usually fall, and vice versa. High-yield bonds, or “junk” bonds, involve a greater risk of default and price volatility. Foreign securities, including sovereign debt, are subject to currency fluctuations, political and economic uncertainty and increased volatility and lower liquidity, all of which are magnified in emerging markets.
Securitized products, such as mortgage- and asset-backed securities, are more sensitive to interest rate changes, have extension and prepayment risk, and are subject to more credit, valuation and liquidity risk than other fixed-income securities.
Bloomberg Asian-Pacific Japan Government-Related Index is a fixed-rate, investment grade, JPY-denominated benchmark that includes debt from government-related issuers.
Bloomberg Germany Government All Bonds Index measures the performance of German government bonds (Bunds) issued by the German government.
Bloomberg Global 10+ Year Total Return Index tracks investment-grade government and government-related bonds with maturities of 10 years or greater.
Bloomberg Global Aggregate – Corporate Index is a flagship measure of global investment grade, fixed-rate corporate debt. This multi-currency benchmark includes bonds from developed and emerging markets issuers.
Bloomberg Global High Yield Index is a multi-currency flagship measure of the global high yield debt market. The index represents the union of the US High Yield, the Pan-European High Yield, and Emerging Markets (EM) Hard Currency High Yield Indices.
Bloomberg Global Treasury Index tracks fixed-rate, local currency government debt of investment grade countries, including both developed and emerging markets.
Bloomberg Magnificent 7 Total Return Index is an equal-dollar weighted equity benchmark that tracks the performance of seven mega-cap U.S. technology companies: Alphabet, Amazon, Apple, Meta Platforms, Microsoft, Nvidia, and Tesla.
Bloomberg Sterling Aggregate: Government Index measures the performance of UK government bonds (Gilts) within the broader Bloomberg Sterling Aggregate Index, which covers the investment-grade, fixed-rate, sterling-denominated bond market.
Bloomberg US Corporate Bond Index measures the investment grade, fixed-rate, taxable corporate bond market. It includes USD-denominated securities from US and non-US issuers.
Bloomberg US Corporate High Yield Bond Index measures the USD-denominated, high yield, fixed-rate corporate bond market. Bonds from issuers with an emerging markets country of risk, based on Bloomberg EM country definition, are excluded.
Bloomberg US Securitized: MBS, ABS, and CMBS Index tracks all USD-denominated, investment grade, securitized issues within the Bloomberg US Aggregate Index.
Bloomberg US Treasury Index measures U.S. dollar-denominated, fixed-rate, nominal debt issued by the U.S. Treasury.
The DAX is a blue-chip stock market index consisting of the 40 major German companies trading on the Frankfurt Stock Exchange.
The France CAC 40 Index is a market value weighted index, composed of the 40 highest levels among the 100 highest market caps on the Paris Bourse.
FTSE All-Share Index reflects the equity market performance of the United Kingdom. The index includes nearly all eligible companies on the London Stock Exchange, covering large, mid, and small-cap stocks.
ICE U.S. Dollar Index is a benchmark measuring the U.S. dollar’s value against a basket of six major world currencies (Euro, Yen, Pound Sterling, Canadian Dollar, Swedish Krona, Swiss Franc).
MSCI AC Asia Pacific ex Japan Index reflects the equity market performance of the Asia Pacific region, excluding Japan, covering both developed and emerging markets.
MSCI ACWI ex USA Index captures large- and mid-cap representation across 22 of 23 developed markets (excluding the US) and 24 emerging markets countries.
MSCI China Index captures large and mid cap representation across China A shares, H shares, B shares, Red chips, P chips and foreign listings (e.g. ADRs).
MSCI Emerging Markets Index reflects the equity market performance of emerging markets.
MSCI Emerging Markets (EM) Latin America Index captures large and mid cap representation across Emerging Markets (EM) countries in Latin America. The index covers approximately 85% of the free float-adjusted market capitalization in each country.
MSCI Europe Index reflects the equity market performance of large and mid-sized companies listed in developed markets in Europe.
MSCI Europe ex UK Index reflects the equity market performance of large and mid-sized companies listed in developed markets in Europe excluding the United Kingdom.
MSCI United Kingdom Index reflects the equity market performance of large and mid-sized companies listed in the UK market.
MSCI World Index captures large- and mid-cap representation across 22 of 23 developed markets countries, excluding the United States.
MSCI World ex USA Index reflects the equity market performance of global developed markets excluding the United States.
NASDAQ Composite Stock Index: National Association of Securities Dealers Automated Quotation System (NASDAQ) is a nationwide computerized quotation system for over 5,500 over-the-counter stocks. The index is compiled of more than 4,800 stocks that are traded via this system.
Nikkei 225 Index (also known as Nikkei Stock Average): A measure of Japanese equity market performance. The index includes 225 of the largest companies listed on the Tokyo Stock Exchange.
The PHLX Semiconductor Sector Index (SOX) is a specialized, modified market capitalization-weighted index composed of companies primarily involved in the design, distribution, manufacture, and sale of semiconductors.
Purchasing Managers’ Index (PMI) is an index of the prevailing direction of economic trends in the manufacturing and service sectors, based on a survey of private sector companies.
Russell 1000® Growth Index reflects the performance of U.S. large-cap equities with higher price-to-book ratios and higher forecasted growth values.
Russell 1000® Value Index reflects the performance of U.S. large-cap equities with lower price-to-book ratios and lower forecasted growth values.
Russell 2000® Index reflects the performance of U.S. small-cap equities.
Russell 2500™ Growth Index reflects the performance of U.S. small to mid-cap equities with higher price-to-book ratios and higher forecasted growth values.
Russell 2500™ Value Index reflects the performance of U.S. small to mid-cap equities with lower price-to-book ratios and lower forecasted growth values.
S&P 500® Index reflects U.S. large-cap equity performance and represents broad U.S. equity market performance.
S&P 500® Equal Weight Index (EWI) is the equal-weight version of the S&P 500. The index includes the same constituents as the capitalization weighted index, but each company is allocated a fixed weight – or 0.2% of the index total at each quarterly rebalance.
S&P/ASX 200 Index reflects the performance of the 200 largest, most liquid companies listed on the Australian Securities Exchange (ASX).
STOXX Europe 600 Index: An index of the 600 largest listed stocks in the European equity market, comprising 17 countries and 11 industries
TOPIX: A capitalization-weighted index of all the companies listed on the First Section of the Tokyo Stock Exchange and is widely regarded as a broad benchmark for Japanese stock prices.
10-year bond: A bond that is set to mature (repay the principal value) in 10 years.
10-Year Treasury Yield is the interest rate on U.S. Treasury bonds that will mature 10 years from the date of purchase.
Agency Mortgage-backed Securities (Agency MBS): A type of asset-backed security that is specifically secured by a collection of mortgages.
Asset-backed Securities (ABS): These are financial instruments that are backed by a pool of assets—typically those that generate a cash flow from debt, such as loans, leases, credit card balances, or receivables.
Basis point: One basis point (bp) equals 1/100 of a percentage point, 1bp = 0.01%.
Bund yield: Bund yields are viewed as benchmark yield indicators for European government bonds; those with a 10-year maturity are considered to be the German equivalent of U.S. Treasury bonds.
Commercial Mortgage-backed Securities (CMBS): A type of mortgage-backed security that is secured by the loan on commercial real estate properties rather than residential real estate.
Consumer Price Index (CPI): A measure that examines the price change of a basket of consumer goods and services over time. It is used to estimate inflation.
Credit spread: The difference in yield between securities with similar maturity but different credit quality. Widening spreads generally indicate deteriorating creditworthiness of corporate borrowers, and narrowing indicate improving.
Curve/Yield curve: A yield curve plots the yields (interest rate) of bonds with equal credit quality but differing maturity dates. Typically bonds with longer maturities have higher yields.
The Federal Open Market Committee (FOMC) is the body of the Federal Reserve System that sets national monetary policy.
Fiscal policy: Describes government policy relating to setting tax rates and spending levels. Fiscal policy is separate from monetary policy, which is typically set by a central bank.
Gilt yield: Gilt yields are viewed as benchmark yield indicators for United Kingdom government bonds; those with a 10-year maturity are considered to be the UK equivalent of U.S. Treasury bonds.
Hawkish policy aims to curb inflation and slow down growth in the economy by raising interest rates and reducing the supply of money.
High yield bond: Also known as a sub-investment grade bond, or ‘junk’ bond. These bonds usually carry a higher risk of the issuer defaulting on their payments, so they are typically issued with a higher interest rate (coupon) to compensate for the additional risk.
Inflation: The rate at which the prices of goods and services are rising in an economy. The Consumer Price Index (CPI) and Retail Price Index (RPI) are two common measures.
Investment grade bond: A bond typically issued by governments or companies perceived to have a relatively low risk of defaulting on their payments, reflected in the higher rating given to them by credit ratings agencies.
JGB yield: JGB yields are viewed as benchmark yield indicators for Japanese government bonds; those with a 10-year maturity are considered to be the Japanese equivalent of U.S. Treasury bonds.
Monetary policy: The policies of a central bank, aimed at influencing the level of inflation and growth in an economy. Monetary policy tools include setting interest rates and controlling the supply of money. Dovish policy aims to stimulate economic growth by lowering interest rates and increasing the money supply.
Option-Adjusted Spread (OAS) measures the spread between a fixed-income security rate and the risk-free rate of return, which is adjusted to take into account an embedded option.
Producer Price Index (PPI) measures the average change over time in the selling prices received by domestic producers for their output.
Quantitative Easing (QE) is a government monetary policy occasionally used to increase the money supply by buying government securities or other securities from the market.
Securitization: The process in which certain types of assets are pooled so that they can be repackaged into interest-bearing securities. The interest and principal payments from the assets are passed through to the purchasers of the securities.
U.S. Treasury securities are direct debt obligations issued by the U.S. Government. Treasury Bills and U.S. Government Bonds are guaranteed by the full faith and credit of the U.S. government, are generally considered to be free of credit risk.
Volatility measures risk using the dispersion of returns for a given investment.
Yield: The level of income on a security over a set period, typically expressed as a percentage rate. For equities, a common measure is the dividend yield, which divides recent dividend payments for each share by the share price. For a bond, this is calculated as the coupon payment divided by the current bond price.
Yield to worst (YTW) is the lowest yield a bond can achieve provided the issuer does not default and accounts for any applicable call feature (i.e., the issuer can call the bond back at a date specified in advance). At a portfolio level, this statistic represents the weighted average YTW for all the underlying issues.
These are the views of the author at the time of publication and may differ from the views of other individuals/teams at Janus Henderson Investors. References made to individual securities do not constitute a recommendation to buy, sell or hold any security, investment strategy or market sector, and should not be assumed to be profitable. Janus Henderson Investors, its affiliated advisor, or its employees, may have a position in the securities mentioned.
Past performance does not predict future returns. The value of an investment and the income from it can fall as well as rise and you may not get back the amount originally invested.
The information in this article does not qualify as an investment recommendation.
There is no guarantee that past trends will continue, or forecasts will be realised.
Marketing Communication.