
Key takeaways:
- S&P 500 Index sectors focused on growth, stability, and defense have grown from about 60% of the index in 2014 to roughly 74% today. Meanwhile, cyclical sectors have shrunk from roughly 40% to 26%.
- U.S. large-cap market multiples are higher than in recent history, but it is worth noting that the mix of industries within major indexes has shifted toward faster-growing, more profitable sectors that typically command higher multiples.
- Fundamentals are helping to support current valuations: The gap in profitability between growth and value indexes has widened over time, helping explain why the valuation gap has grown as well.
Source: Bloomberg, as of 15 October 2025.
The S&P 500® Index looks very different today than it did a decade ago. Sectors focused on growth, stability, and defense1 have grown from about 60% of the index in 2014 to roughly 74% today. Meanwhile, cyclical sectors2 have shrunk from roughly 40% to 26%.
Energy offers a stark example of shifts in market composition: its weight in the S&P 500 has fallen from approximately 11% in 2014 to about 3% today. The bottom line is that the S&P 500 has become growthier, and market valuations have risen accordingly.
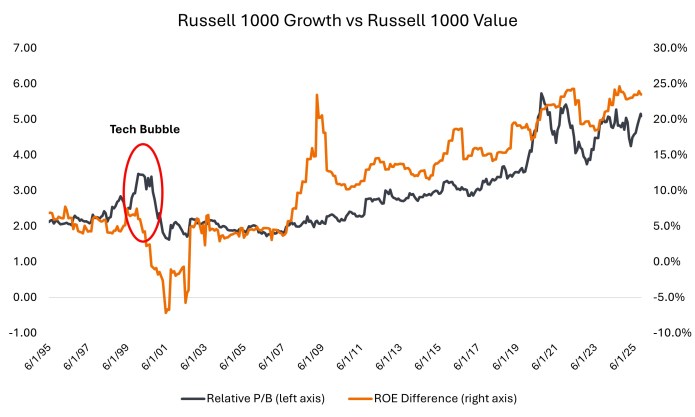
The chart above compares large-cap growth and value indexes on two key measures: valuation (price-to-book ratio, shown on the left axis) and quality (return on equity, shown on the right axis). The comparison highlights a key difference in today’s market versus the tech bubble of 2000.
Growth stocks trade at a wide valuation (price-to-book) premium to value stocks today, but there is a crucial difference from 2000: Fundamentals are helping to support current valuations.
The gap in profitability (return on equity) between growth and value indexes has widened over time, helping explain why the valuation gap has grown as well. Since 2002, increases in price-to-book ratios have been matched by comparable increases in return on equity. During the 2000 tech bubble, by contrast, growth valuations surged without any fundamental support.
U.S. large-cap market multiples are higher than in recent history, but it is worth taking into account that the mix of industries within major indexes has shifted toward faster-growing, more profitable sectors that typically command higher multiples. Strong recent earnings growth – with similar expectations through year end and into next year – also help justify higher valuations.
Sources & definitions
1 Growth, stability and defense sectors represented by technology, communication services, health care, consumer staples, consumer discretionary, utilities, and real estate.
2 Cyclical sectors represented by financials, industrials, materials, and energy.
Return on Equity (ROE) is the measure of a company’s annual return (net income) divided by the value of its total shareholders’ equity, expressed as a percentage. The number represents the total return on equity capital i.e., the profits made for each dollar from shareholders’ equity.
Price-to-Book (P/B) Ratio measures share price compared to book value per share for a stock or stocks in a portfolio.
S&P 500® Index reflects U.S. large-cap equity performance and represents broad U.S. equity market performance.
Russell 1000® Growth Index reflects the performance of U.S. large-cap equities with higher price-to-book ratios and higher forecasted growth values.
Russell 1000® Value Index reflects the performance of U.S. large-cap equities with lower price-to-book ratios and lower expected growth values.
Related insights


Any reference to individual companies is purely for the purpose of illustration and should not be construed as a recommendation to buy or sell or advice in relation to investment, legal or tax matters.
Important information
Please read the following important information regarding funds related to this article.
Key investment risks:
- The Fund's investments in equities are subject to equity market risk due to fluctuation of securities values.
- The Fund invests in debt securities and asset/ mortgage-backed securities/ commercial papers; and is subject to greater interest rate, credit/ counterparty, volatility, liquidity, downgrading, valuation, credit rating risks.It may be more volatile.
- Investments in the Fund involve general investment, RMB currency and conversion, currency, hedging, economic, political, policy, foreign exchange, liquidity, tax, legal, regulatory and securities financing transactions related risks. In extreme market conditions, you may lose your entire investment.
- The Fund may invest in financial derivatives instruments for investment and efficient portfolio management purposes. This may involve counterparty, liquidity, leverage, volatility, valuation, over-the-counter transaction, credit, currency, index, settlement default and interest risks; and the Fund may suffer total or substantial losses.
- The Fund's investments are concentrated in US companies/ debt securities and may be more volatile.
- The Fund may at its discretion pay dividends (i) pay dividends out of the capital of the Fund, and/ or (ii) pay dividends out of gross income while charging all or part of the fees and expenses to the capital of the Fund, resulting in an increase in distributable income available for the payment of dividends by the Fund and therefore, the Fund may effectively pay dividends out of capital. This may result in an immediate reduction of the Fund’s net asset value per share, and it amounts to a return or withdrawal of part of an investor’s original investment or from any capital gains attributable to that original investment.
- Investors should not only base on this document alone to make investment decisions and should read the offering documents including the risk factors for further details.