Key takeaways:
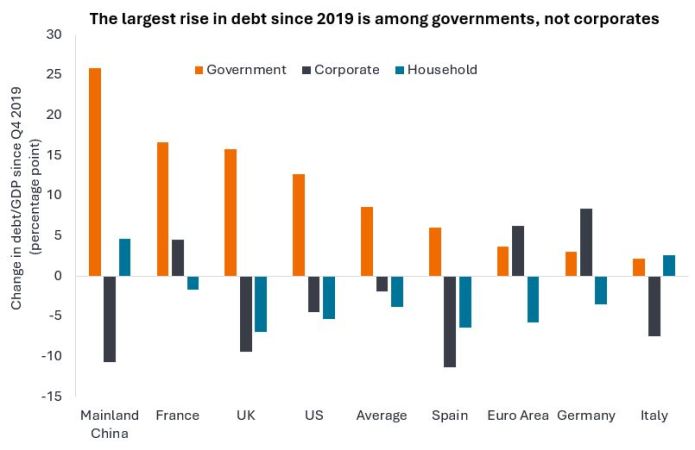
- The rise in debt levels as a percentage of gross domestic product has principally been due to government borrowing, with corporate debt on average declining since 2019.
- Government spending finds its way into the corporate side of the economy, either directly through expenditure on goods and services or indirectly through wages that are then spent, boosting corporate revenues.
- Reasonably healthy corporate finances and strong investor appetite needs to be balanced against tight valuations, arguing for an increasingly selective approach to investing in corporate credit.
Source: HSBC, BIS, IIF, national statistical agencies. Until Q4 2024, except governments (Q3 2024) and corporates and households for UK and China (Q3 2024). Gross domestic product (GDP) is a measure of the size of the economy.
Companies spent much of the last few years repairing their balance sheets, aided by relatively strong earnings. In some ways the resilience of corporates is partly related to the largesse of governments. The chart above shows the shift in debt burden towards governments and generally away from corporates and households.
In the US, the passing of the Big Beautiful Bill Act is forecast to add an additional US$2 trillion to US government borrowing between 2025-29.1 In the UK, tax raising has been offset by higher welfare spending and public sector pay. In Germany, the government has proposed a big increase in infrastructure and defence spending. Anything that increases spending in the economy is likely to be supportive for corporates. Earnings have been robust and credit spreads (the difference in yield between a corporate bond and a government bond of similar maturity) are near their lows as companies, on average, have reasonably healthy finances.2 In contrast, heavy government borrowing is leading to questions around debt sustainability and has contributed to yields on government debt (particularly longer-term debt of 10+ years to maturity) remaining high.
The question for markets is will governments seek to balance revenues and spending any time soon? On one side of the ledger, lower borrowing might bring down government bond yields, on the other side, it might remove a useful stimulant to the economy. For now, corporate credit is happy for governments to keep the spending taps open.
Movements in government bond yields can affect returns in credit markets so we need to pay attention to factors such as debt levels that can affect yields. Corporate bond markets have performed well in recent years and there has been strong appetite for credit from investors seeking a yield pick-up over government bonds. With credit spreads at relatively low levels, however, this leaves less margin for error, so we believe it is increasingly important to be selective about which credits to hold in a portfolio.
– James Briggs, Fixed Income Portfolio Manager.
1Source: US Congressional Budget Office, estimate effects, 29 June 2025.
2Source: Bloomberg, ICE BofA, Morgan Stanley, credit spreads to governments, range over the last 20 years, 28 July 2025. Past performance does not predict future returns.
Fixed income securities are subject to interest rate, inflation, credit and default risk. The bond market is volatile. As interest rates rise, bond prices usually fall, and vice versa. The return of principal is not guaranteed, and prices may decline if an issuer fails to make timely payments or its credit strength weakens.
Balance sheet: A financial statement that summarises a company’s assets, liabilities, and shareholders’ equity at a particular point in time. It is called a balance sheet because of the accounting equation: assets = liabilities + shareholders’ equity.
Corporate bond: A bond issued by a company. Bonds offer a return to investors in the form of periodic payments and the eventual return of the original money invested at issue on the maturity date.
Coupon: A regular interest payment that is paid on a bond, described as a percentage of the face value of an investment. For example, if a bond has a face value of $100 and a 5% annual coupon, the bond will pay $5 a year in interest.
Credit spread: The difference in yield between securities with similar maturity but different credit quality. Widening spreads generally indicate deteriorating creditworthiness of corporate borrowers, and narrowing indicate improving.
Default: The failure of a debtor (such as a bond issuer) to pay interest or to return an original amount loaned when due.
Maturity: The maturity date of a bond is the date when the principal investment (and any final coupon) is paid to investors. Shorter-dated bonds generally mature within 5 years, medium-term bonds within 5 to 10 years, and longer-dated bonds after 10+ years.
Yield: The level of income on a security over a set period, typically expressed as a percentage rate. For a bond, at its most simple, this is calculated as the coupon payment divided by the current bond price.