
Key takeaways:
- Various narratives are circulating that have pushed bond yields higher, from moves by the Bank of Japan to a fresh focus on government debt levels, but recent strength in US activity data contrasts with a softening employment market and weakness in Europe and China.
- We believe we are near a tipping point as the debate moves on from inflation towards employment and growth prospects.
- Rates are restrictive – in our view ten-year US real yields close to 2% cannot be sustained. We continue to favour long duration and being defensive from a credit standpoint.
In some ways it has been a perfect storm where various factors have been working in the same direction to push bond yields higher. Yet, the move in bond yields to (and in some cases above) October 2022 levels has been driven by a repricing of real yields rather than any upward shift in inflation expectations.
Figure 1: Rise in yields driven by real yield rather than inflation expectations
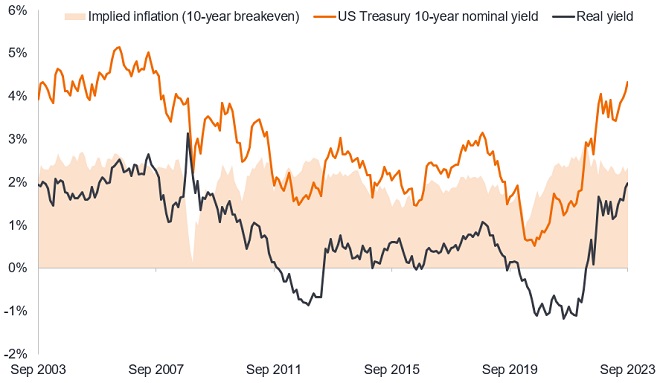
Source: Bloomberg, US Treasury 10-year nominal yield, US Treasury 10-year Inflation Protected Securities (TIPS) yield (real yield). The 10-year breakeven rate is a measure of expected inflation, implying what market participants expect inflation to be in the next 10 years, on average. It is derived from subtracting the yield on TIPS from nominal bond yields of the same maturity. 30 September 2003 to 15 September 2023. Yields may vary over time and are not guaranteed.
The recent rise in yields can be attributed to a number of factors. It started with the change by the Bank of Japan to yield curve control when it widened the band to +/-1%. This was then followed by Fitch’s downgrade of the US sovereign credit rating which has put more focus on government budget deficits and bond supply, though all of this was known already. Meanwhile, near term economic data in the US, such as retail sales, have beaten expectations. This has raised hopes that growth will be sustained despite high levels of rates.
For now, the US does seem more resilient, but elsewhere the backdrop for major economies is weak, with parts of Europe (including Germany) in recession already, and China disinflationary. This is demonstrated by weak European and UK Purchasing Manager Indices (PMIs) showing increased fragility as the lagged effects of monetary policy start to bite.
Figure 2: European services are following manufacturing PMIs into contractionary territory
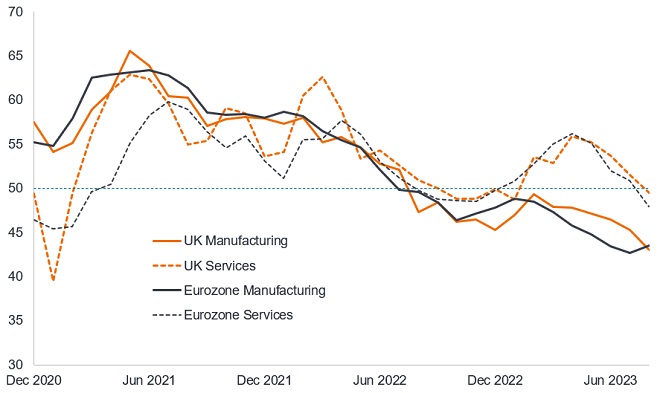
Source: Bloomberg, S&P Global/CIPS UK Manufacturing and Services PMIs; S&P Global Eurozone Manufacturing and Services PMIs. A figure above 50 indicates expansion and a figure below 50 indicates contraction, December 2020 to August 2023.
In Europe, higher rates are having the desired effect of slowing the economy. In fact, at the September 2023 policy meeting of the European Central Bank (ECB) President Lagarde stated that the transmission effect of monetary policy today is “strong and stronger than we have seen in previous cycles” and is having a “constraining impact”.
We are open-minded on the idea that recession in the US could be avoided, but it needs to be broadly corroborated by the data. A few strong datapoints does not make a trend. Meanwhile, the leading indicators that we follow, which have defined business cycles since the 1960s, remain at low / negative levels.
When reviewing conditions for soft landing criteria since 1960, the following need to have been met: easing bank lending standards, low inflation and modest US Federal Reserve (Fed) hikes. Today, we have tight bank lending standards, still elevated inflation, and a rapid rate hiking cycle. In a historical context, soft landings are not easy to achieve, while, by their very nature, recessions “tend to be non-linear and so they’re very hard to model” – the words of Fed Chair Powell.1
Employment shakeout
Commentators are quick to point to what has been a robust labour market as evidence that a soft landing can take place. Monetary policy, however, works with long and variable lags and the employment market is typically the last shoe to drop.
Employment markets appear stronger due to labour hoarding (holding on to employees to be ready for an upturn and avoid costs of re-hiring), money illusion (a focus on nominal revenues has led firms to delay headcount reductions), and the growth in lower productivity service jobs. In the US, the Inflation Reduction Act / CHIPS & Science Act / Student Loan Waiver have supported employment in sectors such as autos and non-residential construction, but this is fading.
Looking ahead, the lead indicators of employment are still trending down, and under the surface the picture is less robust than it appears at first glance. Take the non-farm payrolls data. There have been heavy downward revisions recently. In fact, if we were to adjust each actual month’s data to reflect the revisions made to the preceding two months you begin to see a clear trend: job creation was underreported as the economy emerged from COVID restrictions in 2021 but has been overreported in recent months. We would argue this is symptomatic of policy lags taking effect.
Figure 3: US payrolls figure shows deteriorating trend
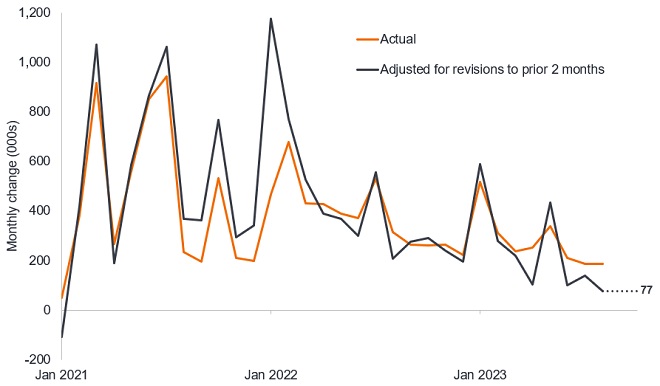
Source: LSEG Datastream, US non-farm payrolls, first estimate actual & adjusted for revisions to prior 2 months, January 2021 to August 2023.
Similarly, US unemployment jumped from 3.5% to 3.8%. Commentary suggested the rise in unemployment was due to the rise in the participation rate (those either in or looking for work), so broadly healthy. However, digging deeper into the labour force flow data provides evidence to the contrary. Out of the 736k rise in participation, most of the overall rise was driven by the 518k increase in the number of people that were unemployed. Within the unemployed bucket, 244k of the rise was due to people staying unemployed for a longer duration (the unemployed (U) remaining unemployed (U) which the Fed classifies as the UU flow) and 175k was driven by people transitioning from employment (E) to unemployment (what the Fed terms the EU flow) and 99k was driven by people who were not in the labour force to unemployment.2
We can interpret from this that 419k was driven by involuntary factors (such as it taking longer to look for a job and outright layoffs) and only 99k were voluntarily looking for employment. Looking back at historical data, there have been 14 times since January 1990 where unemployment has increased by over 400k due to involuntary factors. Of those, 12 have occurred at the start or during a recession!2
This echoes the shift in tone seen across the labour market. The JOLTS quits rate (which measures the percentage of people who voluntarily leave their jobs each month) has declined from a peak of 3 last year down to 2.3, which is in line with pre-COVID levels.3
Restrictive policy
In our view, 10-year US real yields close to 2% cannot be sustained. In fact, the Fed hiking cycle is now unprecedented in the sense that they have never continued to hike when inflation is falling from its peak and when earnings growth has turned negative.
From here, it is hard to see a sustainable uplift in earnings growth, given weak bank lending, depressed PMIs, falling rate of change of money supply and no interest rate cuts as yet. In the US, there has been clear improvement on inflation, with 3-month annualised core inflation now running just below 3%.4 This should eventually feed into the Fed’s real rate framework, prompting them to cut rates just to keep policy as restrictive as it is today.
There are a number of narratives circulating to fit the price action and justify US ten-year treasury yields staying at today’s levels: the impact of AI on productivity potentially leading to higher economic growth; the inflationary impact of the net zero energy transition; reshoring of supply chains and demographics affecting labour supply. Countering this are rising debt-to-GDP ratios given that higher debt servicing costs are a dampener on economic growth. A moderately higher neutral rate is also not an impediment to bonds rallying as the cycle turns. Bond yields follow the path of growth momentum, and in a recession should fall. The neutral policy rate is the real interest rate at which policy is neither accommodative nor restrictive, i.e. when the economy is operating with full employment and stable inflation.
In our view, current market pricing in the Treasury market is failing to take into account the cooling trajectory in inflation and labour markets. As inflation falls, unless nominal yields fall, the real rate rises. In the press conference to September’s Fed policy meeting, Chair Powell stated that “real interest rates now are well above mainstream estimates of the neutral policy rate”, albeit acknowledging the uncertainties in precisely gauging the stance on policy.5
Other markets are corroborating the disconnect in bond yields. Copper is a commodity heavily used throughout the economy, so its price is a useful industry barometer. Gold is a financial asset, traditionally seen as defensive. So, when copper prices rise relative to gold it typically indicates economic acceleration and when copper weakens relative to gold it suggests economic weakness. Just as bond yields were too low in 2021 as the economy gathered steam, they now look too elevated. The copper/gold ratio suggests Treasury yields should be a lot lower.
Figure 4: Bond markets are disconnected with commodities
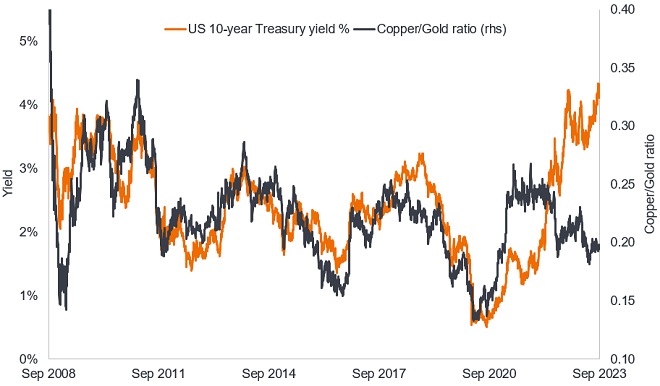
Source: Bloomberg, 10-year US Treasury yield, Copper price represented by index price of Copper futures (current calendar month), gold represented by US dollar per troy ounce price. The ratio reflects the index value divided by the gold price eg at 31 August 377.25/1940.56 = 0.1965. Data between 1 September 2008 and 1 September 2023.
The market is currently offering many contradictions but monetary policy is working. Credit formation (new borrowing) is slowing and momentum is fading in jobs markets. High short-term rates are having the desired effect of sucking money into cash and Treasury bills. The rise in yields that has taken place further along the yield curve, we believe offers investors the potential to benefit from both income and capital gain. For example, if the yield on a 10-year Treasury were to decline from 4.4% to 4%, the bond price would rise by 3.3%, providing a total return (capital gain plus the coupon income) over one year of around 7.7%, which is greater than holding a one-year Treasury bill yielding 5.47%6. In a recession, we would expect yields on medium term bonds to fall considerably more, with correspondingly higher capital gains.
The recent move in yields is testing bond investors’ patience and resolve, and has been painful for our long duration position. We remain of the view that recession is more likely than not, which will warrant rate cuts to be priced in for next year and that credit markets will need to reprice accordingly. Until the signals in our macro process identify an inflection point or turnaround, we continue to favour this bias.
1Source: Jerome Powell, Federal Reserve post policy meeting press conference, 22 March 2023.
2Source: US Bureau of Labor Statistics. Labor Force flows, Recessions periods per NBER, Janus Henderson calculations, 1990 to 2023.
3Source: US Bureau of Labor Statistics, JOLTS quit rate (April 2022 high of 3, July 2023 figure of 2.3 compares with average of 2.3 during 2019).
4Source: US Bureau of Labor Statistics, US Consumer Price Inflation ex food and energy (core inflation), latest figures to end August 2023. As at 13 September 2023.
5Source: Jerome Powell, FOMC September Press Conference, 20 September 2023.
6Source: Bloomberg, yield on US 10-year Treasury bond, yield on 12-month Treasury bill at 20 September 2023.
Bank lending standards: The willingness of a bank to lend is determined by the creditworthiness of a borrower and the outlook for the economy. Lending standards are said to get tighter (banks less willing to lend) when the economy outlook is riskier and standards are typically looser (banks more willing to lend) when the outlook looks brighter.
Credit ratings: A score given by a credit rating agency such as S&P Global Ratings, Moody’s and Fitch on the creditworthiness of a borrower.
Credit risk: The risk that a borrower will default on its contractual obligations, by failing to meet the required debt payments.
Cycle: Upswing and downswings in activity. Cyclical companies are those that sell discretionary consumer items, such as cars, or industries highly sensitive to changes in the economy, such as miners. The prices of equities and bonds issued by cyclical companies tend to be strongly affected by ups and downs in the overall economy, when compared to non-cyclical companies.
Default: The failure of a debtor (such as a bond issuer) to pay interest or to return an original amount loaned when due.
Disinflation: A reduction in the rate of inflation.
Duration: The sensitivity of a bond or fixed income portfolio to changes in interest rates. The larger the figure the more sensitive it is to movements in interest rates. Going long duration refers to extending a portfolio’s average duration.
Fed dot plot: A chart showing where different members of the US Federal Reserve Federal Open Market Committee think that interest rates will be over the next three years and in the longer run.
Inflation: The annual rate of change in prices, typically expressed as a percentage rate. The Consumer Price Index (CPI) is a measure of the average change over time in the prices paid by urban consumers for a market basket of consumer goods and services.
Interest rate risk: The risk to bond prices caused by changes in interest rates. Bond prices move in the opposite direction to their yields, so a rise in rates and yields causes bond prices to fall and vice versa.
Lead indicator: A piece or set of economic data that can help provide an early signal of where we are in an economic cycle.
Monetary policy: The policies of a central bank, aimed at influencing the level of inflation and growth in an economy. It includes controlling interest rates and the supply of money. Easing refers to a central bank increasing the supply of money and lowering borrowing costs. Tightening refers to central bank activity aimed at curbing inflation and slowing down growth in the economy by raising interest rates and reducing the supply of money. Restrictive policy is where policy is being tightened.
Net zero: This refers to greenhouse gas production being balanced by removal from the atmosphere.
Purchasing Manager Index (PMI): A market indicator derived from monthly surveys of companies to determine whether conditions are expanding, contracting or staying the same.
Recession: A significant decline in economic activity lasting longer than a few months. A soft landing is a slowdown in economic growth that avoids a recession. A hard landing is a deep recession.
Reshoring of supply chains: Transferring business operations that were moved overseas back to the home country.
Shoe to drop: An idiom for waiting for something to happen. It is a reference to 19th Century New York where residents lived in apartments where bedrooms were on top of each other. It was common to hear a neighbour upstairs kick off a shoe, and wait for the other to drop.
Transmission effect: This describes how changes made to monetary policy feed through to economic activity.
Treasury: a debt security issued by the US government. A Treasury Bill is for 12 months or less, while a Treasury Bond is for longer.
Yield: The level of income on a security, typically expressed as a percentage rate. The 10-year Treasury yield is the interest rate on US Treasury bonds that will mature 10 years from the date of purchase.
Yield curve: A graph that plots the yields of similar quality bonds against their maturities. In a normal/upward sloping yield curve, longer maturity bond yields are higher than short-term bond yields. A yield curve can signal market expectations about a country’s economic direction.
Yield curve control: A monetary policy by a central bank in which it purchases variable amounts of government bonds to target interest rates at a certain level.