
Key takeaways:
- A fresh approach to equities may be warranted at a time when structural trends, valuations, and policy shifts are broadening out the opportunity set.
- Diversification is critical – a multi-polar world demands portfolios that reduce reliance on a single market, style or sector and capture emerging winners.
- A smarter equities approach could be one that combines two components – an active sleeve to identify and capture alpha potential, with a passive sleeve that offers exposure in a cost efficient and consistent manner.
The main powerhouse of global equity returns over the last decade has been US large caps, and particularly a narrow cohort of mainly mega‑cap technology companies. But now, the investment landscape is showing signs of broadening out – those investors who built portfolios around the winners of the last cycle are now questioning whether a change in approach is required. We believe now is the time for investors to revisit the role of global equities in their portfolios, given structural trends, valuations, and policy shifts are creating a new set of opportunities.
3 key reasons why investors need to capture broader growth drivers beyond core US companies:
Major shifts are afoot: the world is in mid‑transition with the rewiring of supply chains, the return of industrial policy, and energy systems being rebuilt. Meanwhile, rapid developments in artificial intelligence are redefining productivity and efficiency, and changing the way we live, work and play. These shifts are impacting every region and economy, making diversification essential to provide investors with exposure to the full global opportunity set. In summary, there are three key reasons driving investors to diversify globally:
1. Structural tailwinds are becoming more global
Innovation is no longer confined to a handful of large US tech companies. The rapid development of artificial intelligence, the energy transition, healthcare breakthroughs, and renewed investment in industrial infrastructure are global in scope. Broad exposure helps investors access this wider dispersion of growth.
2. Valuation dispersion is creating compelling entry points
Even after years of strong performance, US large caps remain robust with some strong fundamental drivers supporting them – but certain other regions and segments of the market present attractive valuation opportunities. Smaller US businesses, select European industrials, and emerging technology suppliers may offer appealing entry points for investors looking to balance long‑term growth with valuation discipline. In an environment likely to be shaped by higher real rates and more persistent inflation, valuation sensitivity becomes increasingly important.
3. Diversification matters more in a multi-polar world
The global economy is becoming more multi-polar. Geopolitics, supply chain redesign, and domestic industrial policy are reshaping corporate profit pools across continents. Relying on a single market or a narrow set of companies may overlook new winners that emerge from these changes. A global allocation can help capture shifts in leadership, while mitigating excessive reliance on any one region or sector.
We think with these dynamics at play, investors may need to review the suitability of their global equities allocations for the coming years:
Can the portfolio be made more future proof?
Is it still optimal to rely on a single engine of growth?
Is the portfolio able to harness opportunities across regions and the full market cap spectrum?
And finally, at what cost?
Three growth engines to capture the broader global opportunity set
In helping to answer the questions posed above, we believe a smarter global equity solution can be centred on three complementary growth engines:
Engine 1: US large caps – cost-effective access to core growth drivers
US large caps have delivered extraordinary total returns, and as a consequence, they now represent an outsized share of global indices. These companies are market leaders, enabling transformational shifts, and the key drivers of global growth. In our view, US large caps that have proven to deliver superior compound annual growth rates (CAGR), consisting of resilient, high-quality companies with strong balance sheets and durable advantages should remain a key part of an equities portfolio.
However, the US large‑cap market is highly efficient, with extensive research coverage and high transparency. In this segment, index replication provides reliable exposure to established leaders at low cost, without sacrificing quality.
Figure 1: US large caps: a powerful growth engine
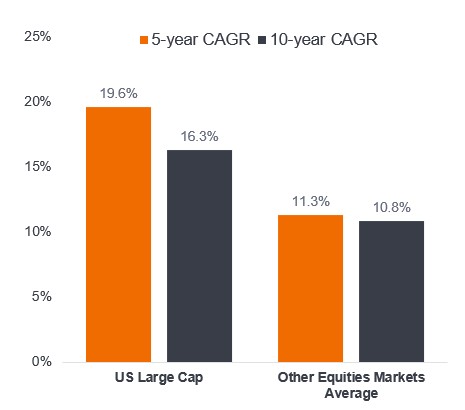
Source: Janus Henderson Investors analysis. US large caps (Russell Top 200 Index) – Bloomberg, as at 30 September 2025. Other Equities Markets – Morningstar, as at 30 September 2025 (MSCI Emerging Markets; MSCI ACWI ex US; MSCI Europe; Russell 2000 Growth; Russell 1000 Value; Russell 2500 Growth; MSCI World; Russell Mid Cap Growth; S&P 500). For illustrative purposes only. Past performance does not predict future returns.
Engine 2: US small and mid‑caps – harnessing untapped potential
Versus large caps, small and mid‑sized companies have less analyst coverage, making them a less efficient market segment, with typically, wider returns dispersion. Similar to their larger peers, many are also participants and beneficiaries of today’s major structural themes of reshoring, industrial modernisation, sovereign AI, electrification, and defence spending. These secular, long-term shifts are both shaping and driving government incentives, national security priorities, corporate investment cycles, as well as consumer preferences and consumption patterns that will take years to play out.
Yet markets have priced many of these businesses with far less enthusiasm than their larger counterparts that are making the daily headlines. This valuation gap creates attractive opportunities beyond the index heavyweights, with the benefits of diversification.
Figure 2: Higher returns dispersion in small caps rewards active stock picking
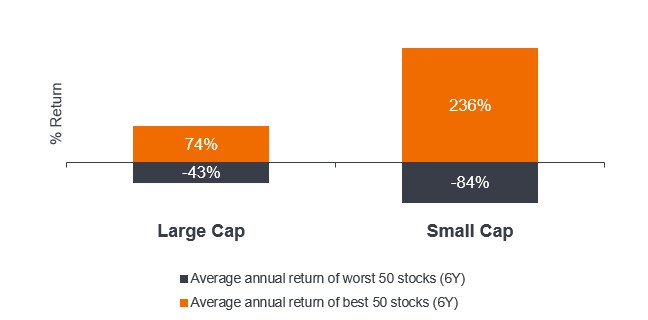
Source: Janus Henderson Investors, as at 31 December 2024. Left: Bloomberg, MSCI World Large Cap Index & MSCI World Small Cap Index. 6-year average, annual data. There is no guarantee that past trends will continue, or forecasts will be realised. Past performance does not predict future returns.
Figure 3: Small caps vs large caps valuations are compelling
Global small caps valuation premium/discount versus global large caps (forward P/E)
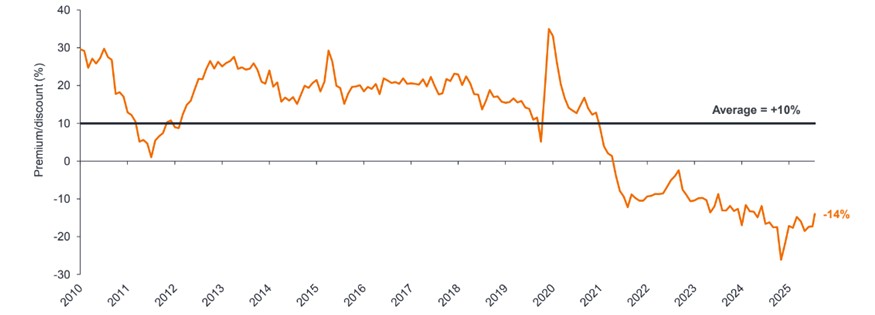
Source: Janus Henderson Investors, Bloomberg as at 16 January 2026. Forward P/E of MSCI World Large Cap Index vs MSCI World Small Cap Index. There is no guarantee that past trends will continue, or forecasts will be realised. Past performance does not predict future returns.
Engine 3: International/ex US equities – tapping into regional growth dynamics
Beyond the US, select European companies are poised to benefit from structural reforms aiming to deliver stronger growth by improving productivity, encouraging innovation and reducing regulatory burden. In Asia, for example, the end of deflation and corporate reforms are bringing inflows back to Japan. Many of these companies are critical to global supply chains, being embedded in global ecosystems like semiconductors, aerospace, defence, and specialised industrials. Typically, they have stable earnings and strong potential for further growth, with many remaining undervalued by the market. Identifying these companies requires active management, balancing conviction and valuation support.
Figure 4: Don’t overlook the winners in ex‑US equities
Domicile of top 100 performing stocks in MSCI ACWI Index (%)
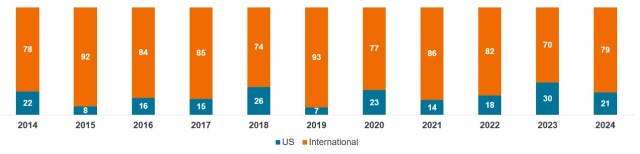
Source: Morningstar, as at 31 December 2024. For illustrative purposes only. Past performance does not predict future returns.
Smart portfolio construction can blend the best of active and passive investing
A blended active–passive approach can capture growth in these three engines more effectively than a broad global ETF. Passive exposure works best in highly-efficient markets like US large caps – where index replication offers low‑cost, transparent, and consistent returns.
However, ETFs take a broad‑brushed approach that may fail to capture opportunities in ex‑US equities and US small & mid-caps, where inefficiencies are greater. In these markets, being able to access active managers with stock selection skills, flexibility to react to market shifts, and the ability to exploit mispriced opportunities across regions and market caps enables the potential for outperformance.
Too often we meet investors whose portfolios rely on a single engine in their portfolios to drive returns – typically yesterday’s winners – without considering the broader global opportunities. In a world where growth drivers are broadening and market efficiency varies widely, a blended approach while also combining active and passive offers a smarter, more resilient path forward.
Matt Bullock, Head of Portfolio Construction & Strategy, EMEA & APAC
Conclusion
For investors seeking resilient long‑term growth, a globally diversified equity approach may offer a prudent way to participate in secular shifts and the resultant evolving market opportunities. By combining passive exposure to established US leaders, and active exposure to uncover opportunities among smaller domestic companies, and selective global innovators and regional champions, a thoughtfully designed active and passive blended strategy could make for a smarter, more durable and rewarding allocation in global equities.
Alpha: The difference between a portfolio’s return and its benchmark index after adjusting for the level of risk taken. This measure is used to help determine whether an actively-managed portfolio has added value relative to a benchmark index, taking into account the risk taken. A positive alpha indicates that a manager has added value. Balance sheet: A financial statement that summarises a company’s assets, liabilities, and shareholders’ equity at a particular point in time. Each segment gives investors an idea as to what the company owns and owes, as well as the amount invested by shareholder; thereby can be used as an indicator of a company’s financial strength. CAGR: Compound Annual Growth Rate measures an investment’s annual growth rate over time, including the effect of compounding (where any income is reinvested to generate additional returns). CAGR is typically used to measure and compare the past performance of investments or to project their expected future returns. Concentration risk: A portfolio concentrated in a small number of holdings or with high weightings to its largest holdings typically carries greater risk than more-diversified portfolios, given that an adverse event could result in significant volatility or losses, but the potential to outperform is also greater. Diversification: A way of spreading risk by mixing different types of assets or asset classes in a portfolio on the assumption that these assets will behave differently in any given scenario. Assets with low corelation should provide the most diversification. ETF: An Exchange Traded Fund is a security that tracks an index, sector, commodity, or pool of assets (such as an index fund). ETFs trade like an equity on a stock exchange and experience price changes as the underlying assets move up and down in price. ETFs typically have higher daily liquidity and lower fees than actively-managed funds. Large caps, mid caps, small caps: Large caps or larger companies are well-established companies with a valuation (market capitalisation) at the larger end of the market scale; Mid-caps or medium-sized companies (e.g., US$2 – 10 billion market cap in the US) are generally perceived to offer better growth potential than their larger peers, but with some additional risk; Small-caps have a market capitalisation) at the smaller end of the market scale (e.g. US$250 million – US$2 billion). Passive and active investing: A passive investment approach involves tracking a particular market or index. It is called passive because it seeks to mirror an index, either fully or partially replicating it, rather than actively picking or choosing stocks to hold. The primary benefit of passive investing is exposure to a particular market with generally lower fees than you might find on an actively-managed fund. An active investment management approach is one where a fund manager actively aims to outperform or beat a specific index or benchmark through research, analysis, and the investment choices they make. It is the opposite of passive investing. Price-to-earnings (P/E) ratio: A popular ratio used to value a company’s shares compared to other stocks or a benchmark index. It is calculated by dividing the current share price by its earnings per share. Forward P/E ratio projects future performance based on analysts’ earnings estimates for the coming year. Returns dispersion: The range of potential returns an investment yields based on their risk, which can be calculated using historical returns or the historical volatility based on those returns. Valuation: The process of determining the fair value of an asset, investment, or firm. Among others, future earnings and other company attributes are used to arrive at a valuation.
These are the views of the author at the time of publication and may differ from the views of other individuals/teams at Janus Henderson Investors. References made to individual securities do not constitute a recommendation to buy, sell or hold any security, investment strategy or market sector, and should not be assumed to be profitable. Janus Henderson Investors, its affiliated advisor, or its employees, may have a position in the securities mentioned.
Past performance does not predict future returns. The value of an investment and the income from it can fall as well as rise and you may not get back the amount originally invested.
The information in this article does not qualify as an investment recommendation.
There is no guarantee that past trends will continue, or forecasts will be realised.
Marketing Communication.
Important information
Please read the following important information regarding funds related to this article.