Key takeaways:
- Amid tariff concerns and economic uncertainty, investors have gravitated to defensive sectors in 2025, driving outperformance over cyclical stocks.
- However, cyclical stocks still project stronger earnings growth through 2027, with estimates holding steady relative to defensive sectors so far this year.
- The recent market rotation has created opportunities in growth-oriented sectors where companies benefitting from strong secular trends now trade at more attractive valuations.
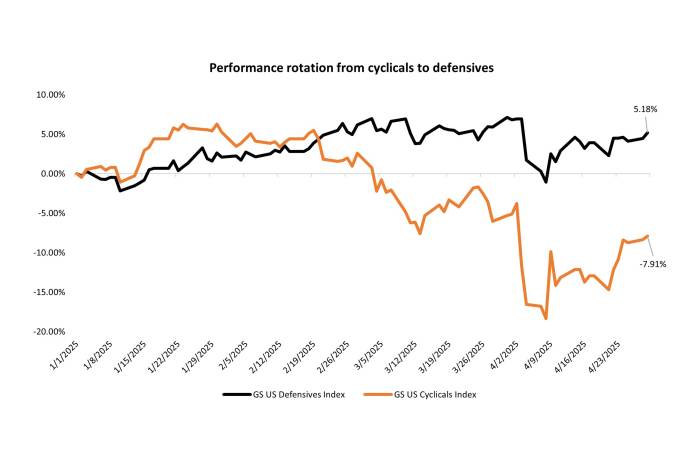
Source: Bloomberg, as of 29 April 2025. Cumulative total return from 1 January 2025 to 29 April 2025.
There is no guarantee that past trends will continue, or forecasts will be realized.
Defensive stocks (up 5.2%) have sharply outperformed cyclical stocks (down 7.9%) year to date in 2025 as investors seek shelter from economic uncertainty surrounding tariff policy and the resulting market volatility. Yet, earnings expectations tell a different story: Cyclicals are projected to outpace defensives through 2027.
| 2025 | 2026 | 2027 | ||||
| EPS | YoY EPS Growth | EPS | YoY EPS Growth | EPS | YoY EPS Growth | |
| GS US Cyclicals Index | $7.71 | 6.71% | $8.76 | 13.63% | $9.69 | 10.59% |
| GS US Defensives Index | $6.25 | 5.79% | $6.70 | 7.29% | $7.25 | 8.21% |
Source: Bloomberg, estimate headline earnings per share (EPS), as of 29 April 2025. YoY = year over year. There is no guarantee that past trends will continue, or forecasts will be realized.
With the earnings season underway, investors are watching for guidance updates and revisions, particularly as most S&P 500® Index estimates still exclude tariff impacts. First-quarter earnings trends showed resilience in cyclical sectors like technology (including semiconductors) and communication services, while estimates in defensive areas of the market like utilities and food producers saw flat to lower forecasts.
The severe rotation into defensives has created compelling opportunities in secular growth companies. Over the long term, we believe secular trends are far more powerful in driving stock returns than short-term macro fluctuations. We’re finding opportunities in secular growth companies that now trade at prices we haven’t seen in years, some of which we believe are positioned to extend their competitive advantages during a potentially challenging operating environment.
Beta measures the volatility of a security or portfolio relative to an index. Less than one means lower volatility than the index; more than one means greater volatility.
GS US Defensives Index consists of S&P 500 equities with a beta to US Gross Domestic Product (GDP) growth (via the GS US MAP score of economic data surprises) lower than the S&P 500’s beta excluding commodity input cost and other equities impacted by macro environment.
GS US Cyclicals Index consists of S&P 500 equities with a beta to US GDP growth (via the GS US MAP score of economic data surprises) higher than the S&P 500’s beta excluding energy and materials.
S&P 500® Index reflects U.S. large-cap equity performance and represents broad U.S. equity market performance.
Volatility measures risk using the dispersion of returns for a given investment.
These are the views of the author at the time of publication and may differ from the views of other individuals/teams at Janus Henderson Investors. References made to individual securities do not constitute a recommendation to buy, sell or hold any security, investment strategy or market sector, and should not be assumed to be profitable. Janus Henderson Investors, its affiliated advisor, or its employees, may have a position in the securities mentioned.
Past performance does not predict future returns. The value of an investment and the income from it can fall as well as rise and you may not get back the amount originally invested.
The information in this article does not qualify as an investment recommendation.
There is no guarantee that past trends will continue, or forecasts will be realised.
Marketing Communication.
Important information
Please read the following important information regarding funds related to this article.
- Shares/Units can lose value rapidly, and typically involve higher risks than bonds or money market instruments. The value of your investment may fall as a result.
- An issuer of a bond (or money market instrument) may become unable or unwilling to pay interest or repay capital to the Fund. If this happens or the market perceives this may happen, the value of the bond will fall.
- When interest rates rise (or fall), the prices of different securities will be affected differently. In particular, bond values generally fall when interest rates rise (or are expected to rise). This risk is typically greater the longer the maturity of a bond investment.
- The Fund invests in high yield (non-investment grade) bonds and while these generally offer higher rates of interest than investment grade bonds, they are more speculative and more sensitive to adverse changes in market conditions.
- If a Fund has a high exposure to a particular country or geographical region it carries a higher level of risk than a Fund which is more broadly diversified.
- The Fund may use derivatives to help achieve its investment objective. This can result in leverage (higher levels of debt), which can magnify an investment outcome. Gains or losses to the Fund may therefore be greater than the cost of the derivative. Derivatives also introduce other risks, in particular, that a derivative counterparty may not meet its contractual obligations.
- When the Fund, or a share/unit class, seeks to mitigate exchange rate movements of a currency relative to the base currency (hedge), the hedging strategy itself may positively or negatively impact the value of the Fund due to differences in short-term interest rates between the currencies.
- Securities within the Fund could become hard to value or to sell at a desired time and price, especially in extreme market conditions when asset prices may be falling, increasing the risk of investment losses.
- Some or all of the ongoing charges may be taken from capital, which may erode capital or reduce potential for capital growth.
- The Fund could lose money if a counterparty with which the Fund trades becomes unwilling or unable to meet its obligations, or as a result of failure or delay in operational processes or the failure of a third party provider.
- In addition to income, this share class may distribute realised and unrealised capital gains and original capital invested. Fees, charges and expenses are also deducted from capital. Both factors may result in capital erosion and reduced potential for capital growth. Investors should also note that distributions of this nature may be treated (and taxable) as income depending on local tax legislation.