Multi-sector fixed income: 5 essential charts to ring in the new year
Portfolio Manager John Lloyd presents a compelling case for U.S. multi-sector fixed income in his 2024 outlook, highlighting the end of rate hikes, cooling inflation, and attractive yields as tailwinds for the bond market.


6 minute read
Key takeaways:
- Following three years of headwinds, fixed income markets today look very different than recent history.
- With attractive yields on offer, an end to the Fed hiking cycle, cooling inflation, and historically wide credit spreads in securitized sectors, we believe the prospects for U.S. fixed income look positive.
- In particular, we anticipate strong nominal and real returns from multi-sector fixed income in 2024 and believe we’re at an attractive entry point for investors to reevaluate their fixed income allocation.
Following three years of headwinds in the form of high inflation and rising interest rates, we believe the U.S. bond market finds itself well poised going into 2024. Now that the Federal Reserve (Fed) appears to be done raising rates, and core inflation is trending down, we believe the prospects for U.S. fixed income look positive. In our view, investors may now reap the benefits of higher starting yields, with a low risk of rates rising (and bond prices falling) further from here.
The following charts illustrate five essential considerations for fixed income investors as we look forward to the new year.
1. Relative to equities, bonds are more attractive now than they have been in over 20 years.
Following the Fed’s aggressive rate-hiking cycle, U.S. fixed income is now offering the most attractive yields since before the Global Financial Crisis (GFC). Not only are nominal yields higher, but bonds have not been this cheap relative to equities in over two decades.
As shown in Figure 1, the S&P 500® Index currently offers no additional compensation for investors to take on equity risk relative to fixed income. We think this situation says less about conditions in equity markets and more about the value in fixed income.
In our view, this is a positive development: Risk-averse investors in search of income need not take on additional risk to meet their return requirements. We recommend investors take advantage of this good entry point to bring their fixed income allocations up to benchmark weight – or to overweight – depending on their individual situation and risk tolerance.
Figure 1: S&P 500 earnings yield vs. 10-year Treasury yield (2003 – 2023)
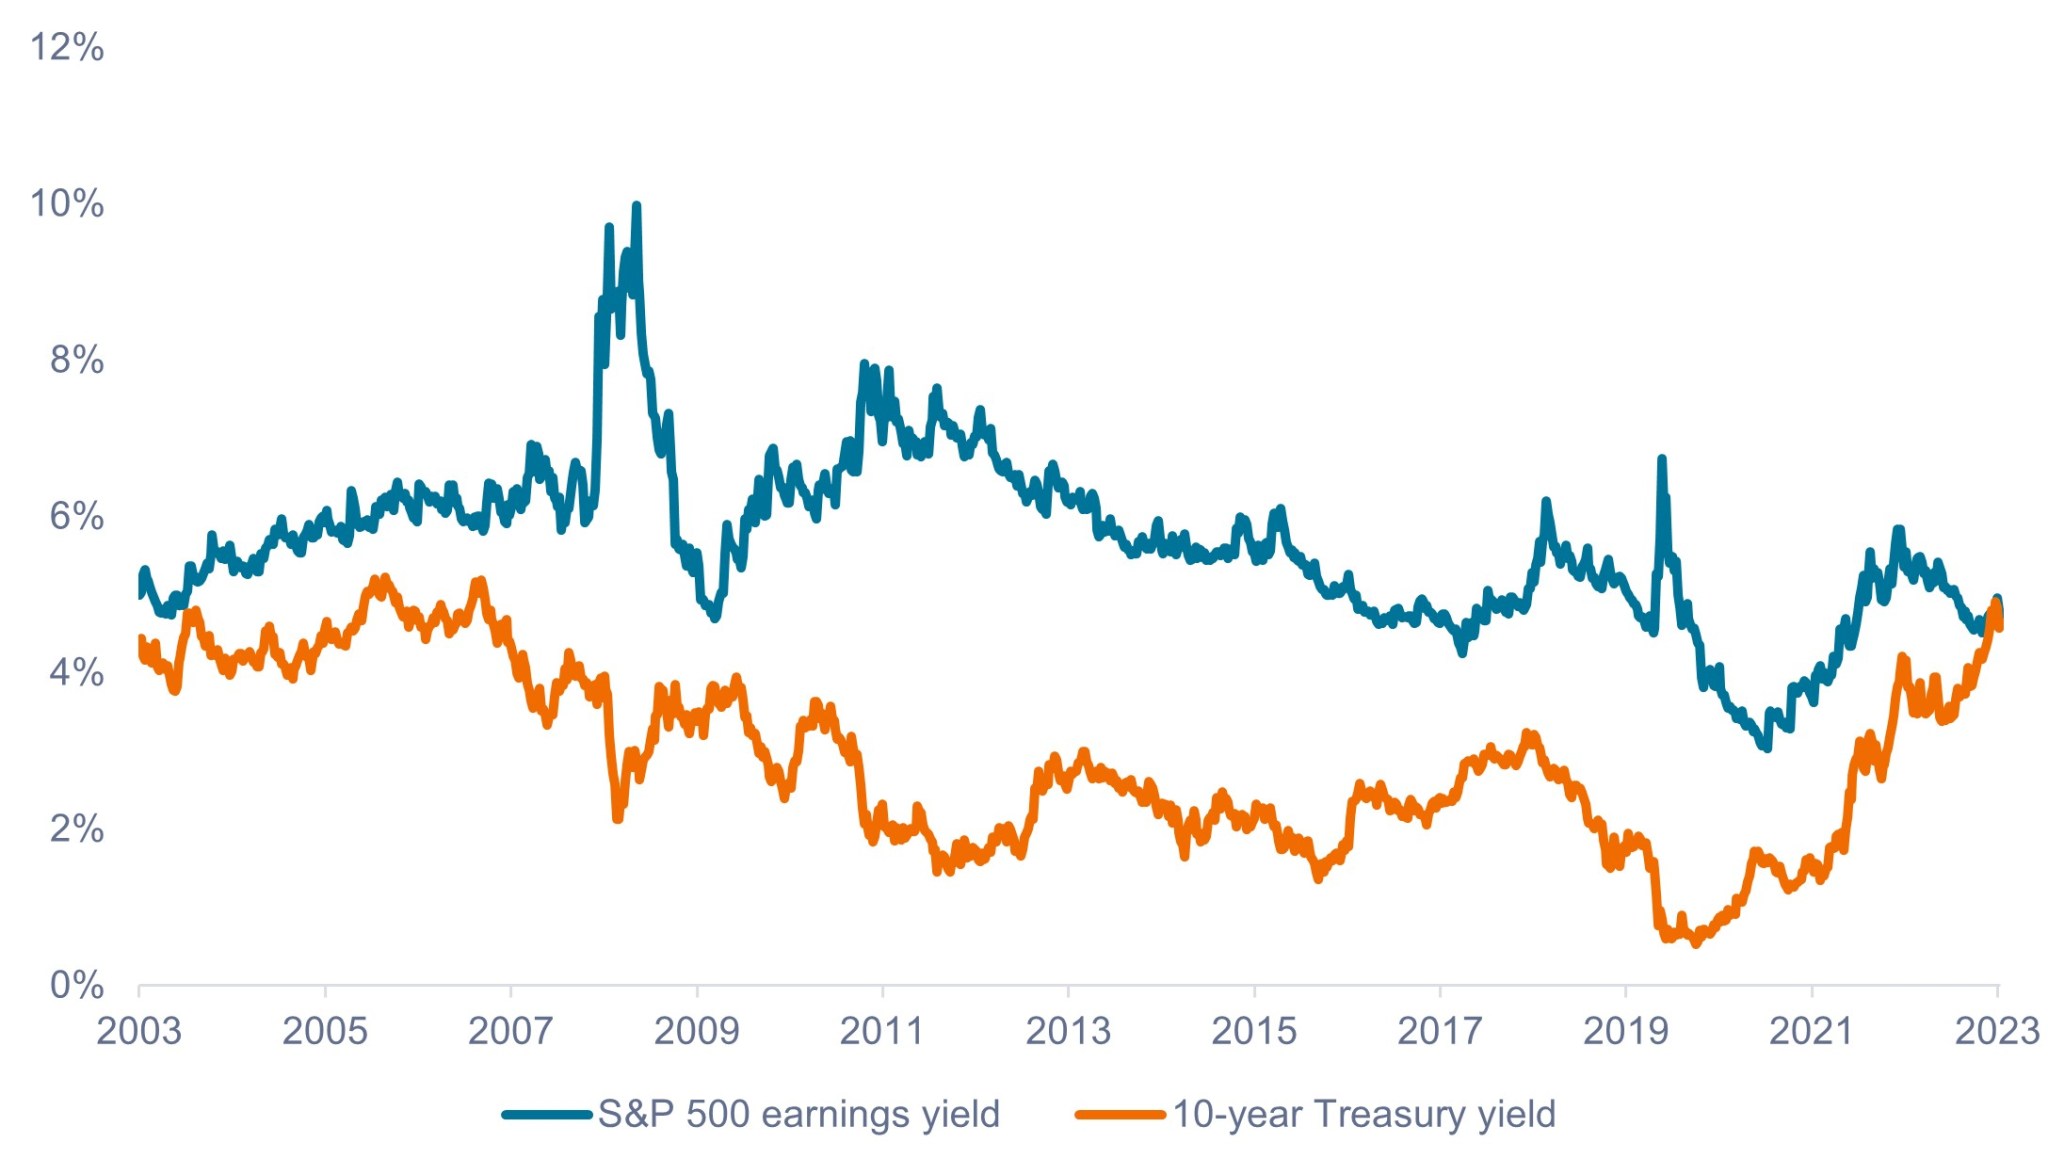 Source: Bloomberg, as of 10 November 2023. Past performance does not predict future returns.
2. Real returns from bonds (are real).
For much of the decade following the GFC, investors could argue against an overweight allocation to bonds on account of real yields (nominal yields less inflation) being near or below zero. But the combination of higher interest rates and cooling inflation has changed the landscape, as shown in Figure 2.
Treasury bonds now comfortably clear the inflation hurdle and offer investors returns above inflation that are comparable to 2006-2007. Additionally, credit spread sectors – namely, bonds that pay an additional yield above the Treasury rate – such as corporates and securitized assets are offering even higher real returns, a further boon to investors.
Figure 2: Real U.S. Treasury yield (2003 – 2023)
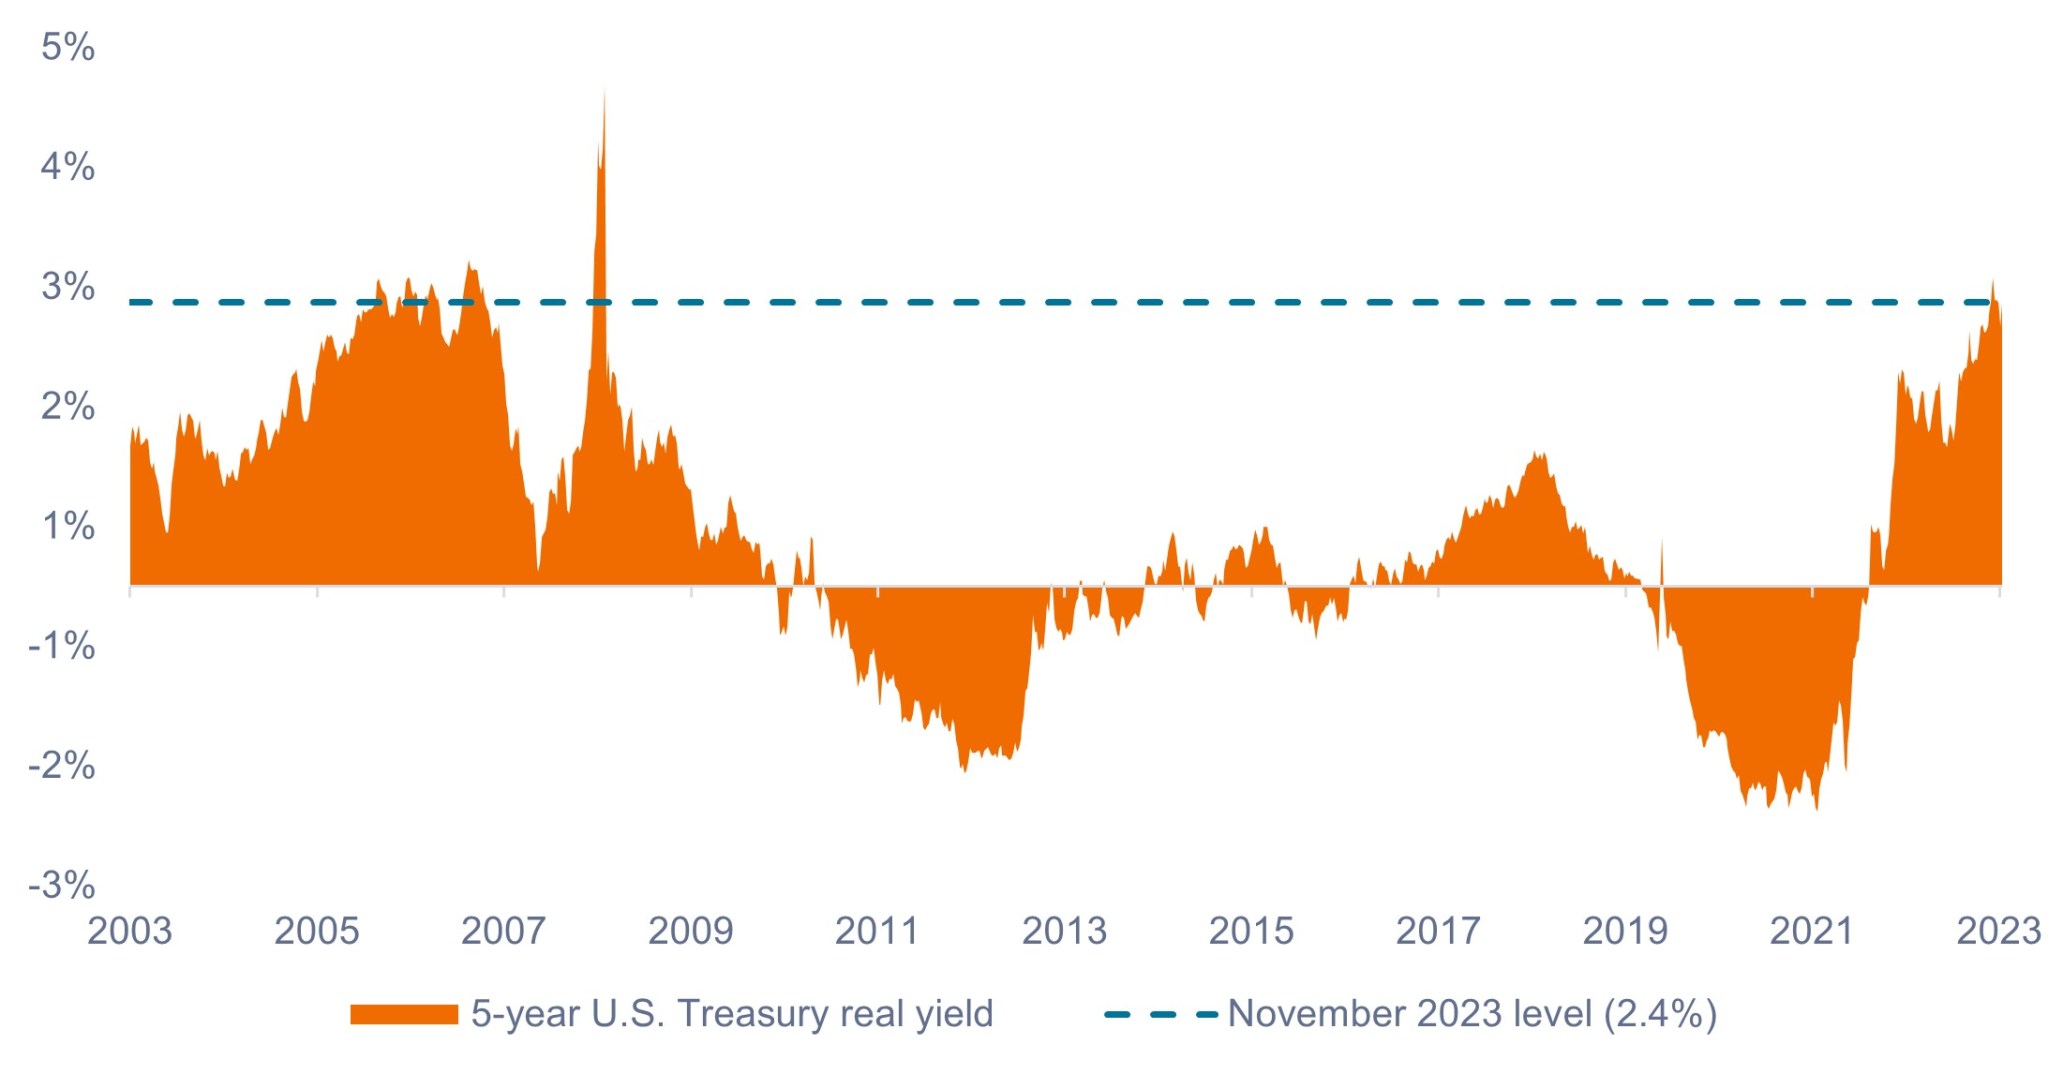 Source: Bloomberg, as of 10 November 2023. Past performance does not predict future returns.
3. Beaten-down duration is back.
Long-duration assets have faced stiff headwinds since the Fed began raising interest rates almost two years ago. As rates have risen, long-duration bonds (with higher interest-rate risk) have seen their prices fall more than low-duration bonds.
After suffering losses on their core bond portfolios, many investors moved to cash, or money markets, to protect against rising rates. But now that we are at the end of the hiking cycle, investors should beware of being too short duration as we move into the next phase of the economic cycle.
As shown in Figure 3, following the final rate increase during the last six hiking cycles, duration bonds outperformed money markets. In our view, if higher-for-longer rates lead to an economic slowdown, with equity markets repricing lower, investors would benefit from the counterbalance of price appreciation from bonds.
Figure 3: 12-month forward returns following the final rate hike
Duration has historically outperformed once the Fed stops hiking.
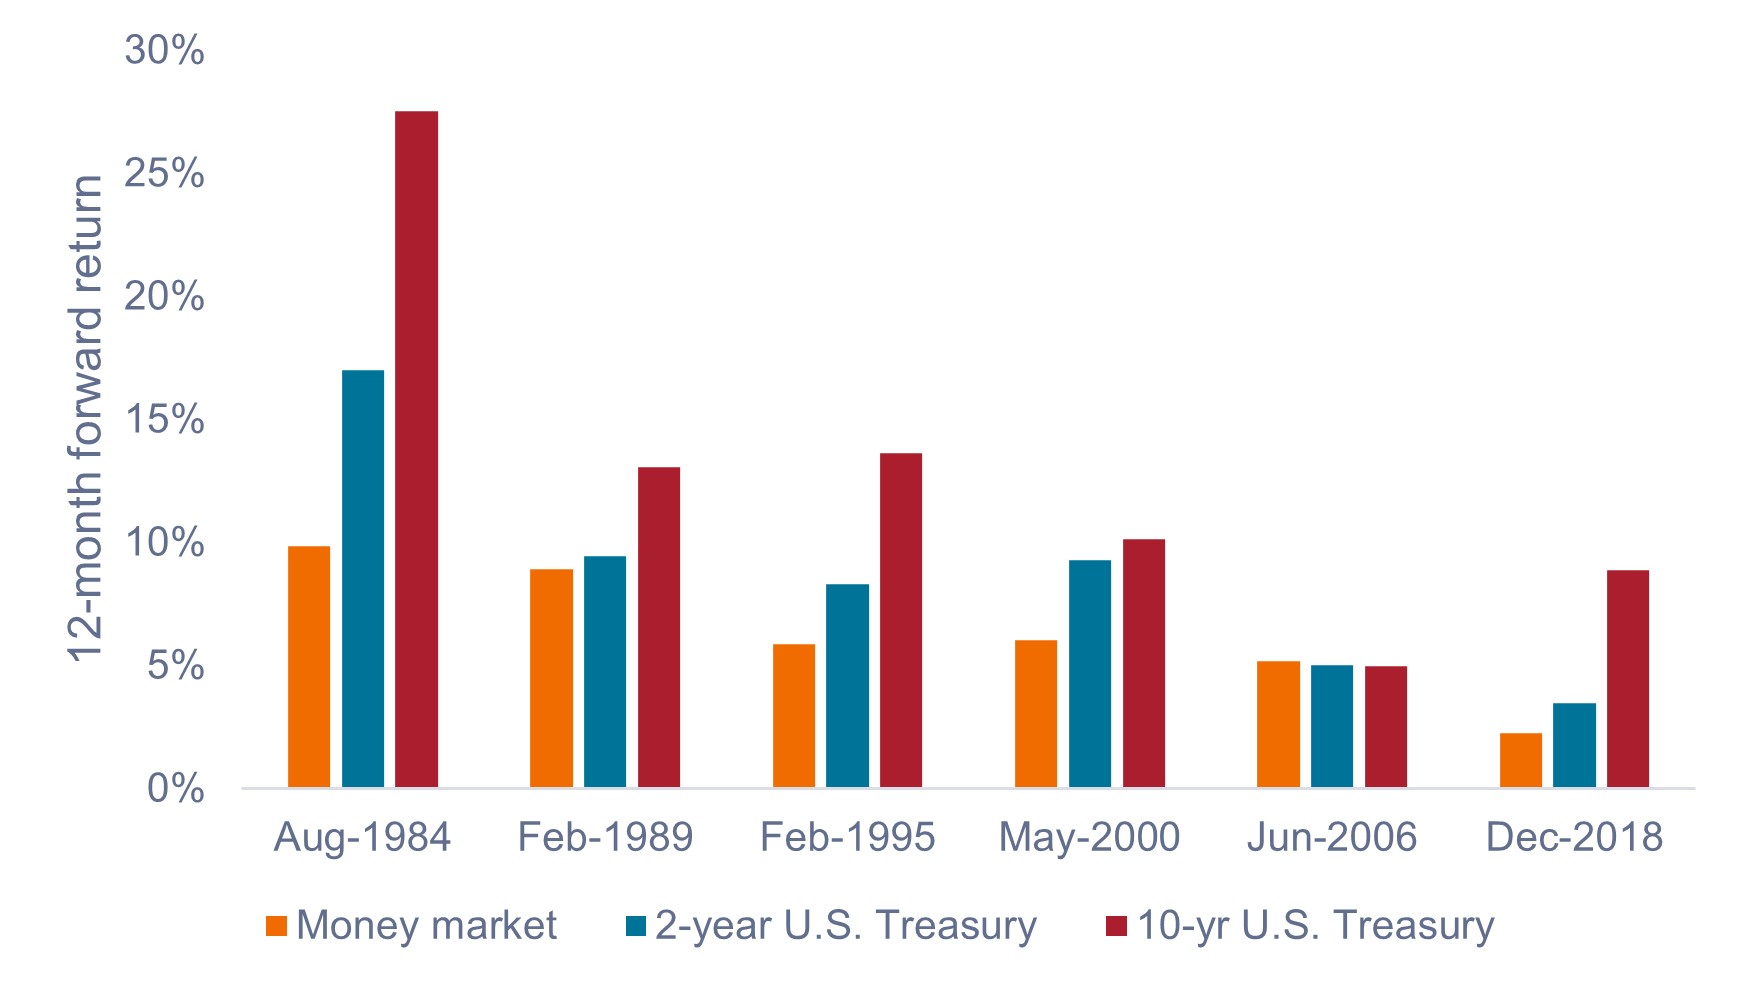
Source: Bloomberg, Janus Henderson Investors, as of 10 November 2023. Past performance does not predict future returns.
4. Falling inflation may be good for stock-bond correlations.
A fundamental reason to own fixed income is its historically low correlation to equities. As shown in Figure 4, the 3-year correlation between the S&P 500 Index and the 10-year U.S. Treasury has been mostly positive when 3-year average core inflation rises above 3%. In the past 12 months, bonds have largely moved in the same direction as equities and, therefore, fixed income allocations have not dampened overall portfolio volatility as investors would expect.
Nonetheless, negative correlation has typically returned when 3-year average core inflation has dropped below 3%. As inflation continues to fall and the Fed remains committed to its 2% target, we think correlations may move back to negative, with a corresponding return of the diversification benefits of owning bonds alongside equities.
Figure 4: Stock-bond correlations have been positive when core inflation is above 3%
The diversification benefits of bonds may return as core inflation declines back to the Fed’s 2% target.
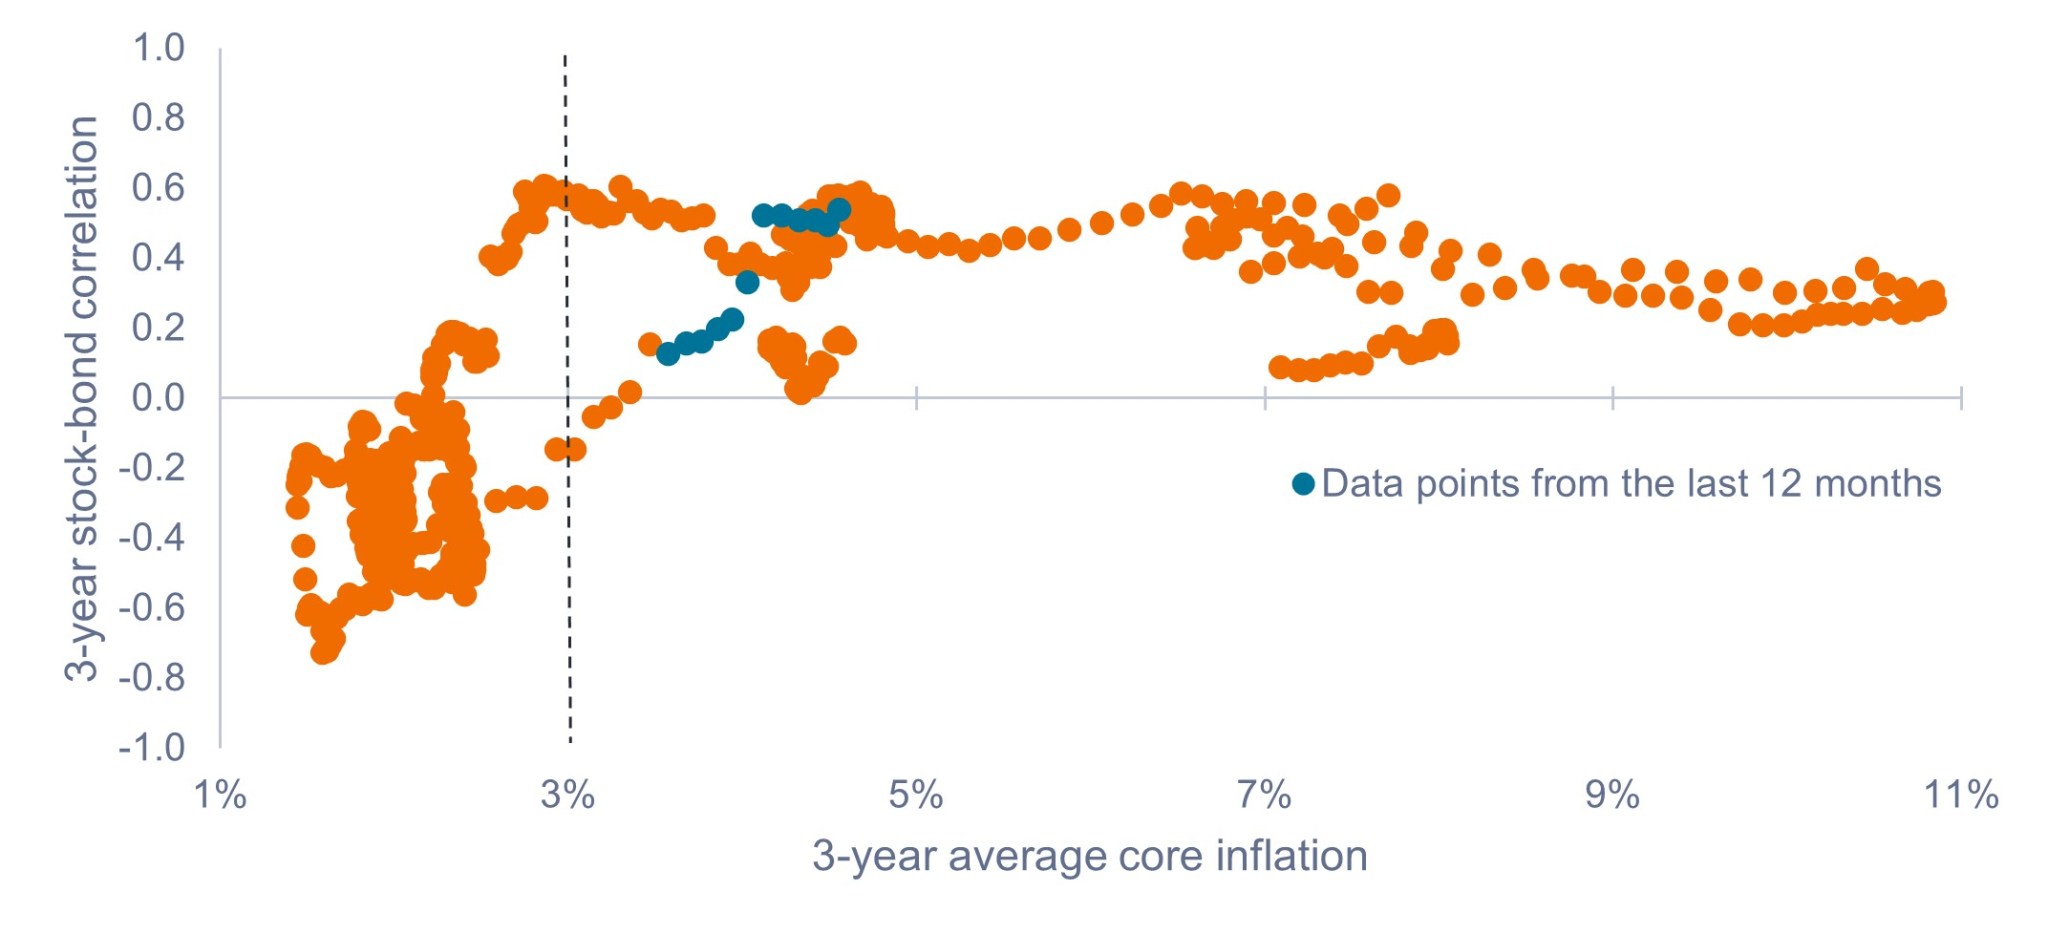 Source: Bloomberg, Janus Henderson Investors, as of 30 September 2023. 3-year stock-bond correlations based on rolling monthly data for the S&P 500 Index and 10-year U.S Treasury from February 1973 to September 2023.
5. Securitized sector valuations look attractive.
While yields have risen across the board, it is important to remember that bond yields comprise two elements: The yield on risk-free government bonds plus an additional yield – or credit spread – paid to investors to compensate them for the higher risk of the security.
It is important to evaluate sector spread valuations in relation to their historical levels, as well as in relation to other sectors, to determine which sectors look cheap on a relative basis.
As shown in Figure 5, securitized credit spreads are trading meaningfully wider than their 10-year averages, while investment-grade (IG) corporates are less attractively priced. If we equate these pricing levels to the risk of recession, securitized sectors are already pricing in some level of recession, whereas IG corporates are priced for a soft landing. In our view, this bifurcation in credit spreads has created the opportunity for better risk-adjusted returns in securitized sectors.
Figure 5: Current spread vs. 10-year average spread
Securitized spreads are trading wider than their 10-year averages, while corporates are less attractively priced.
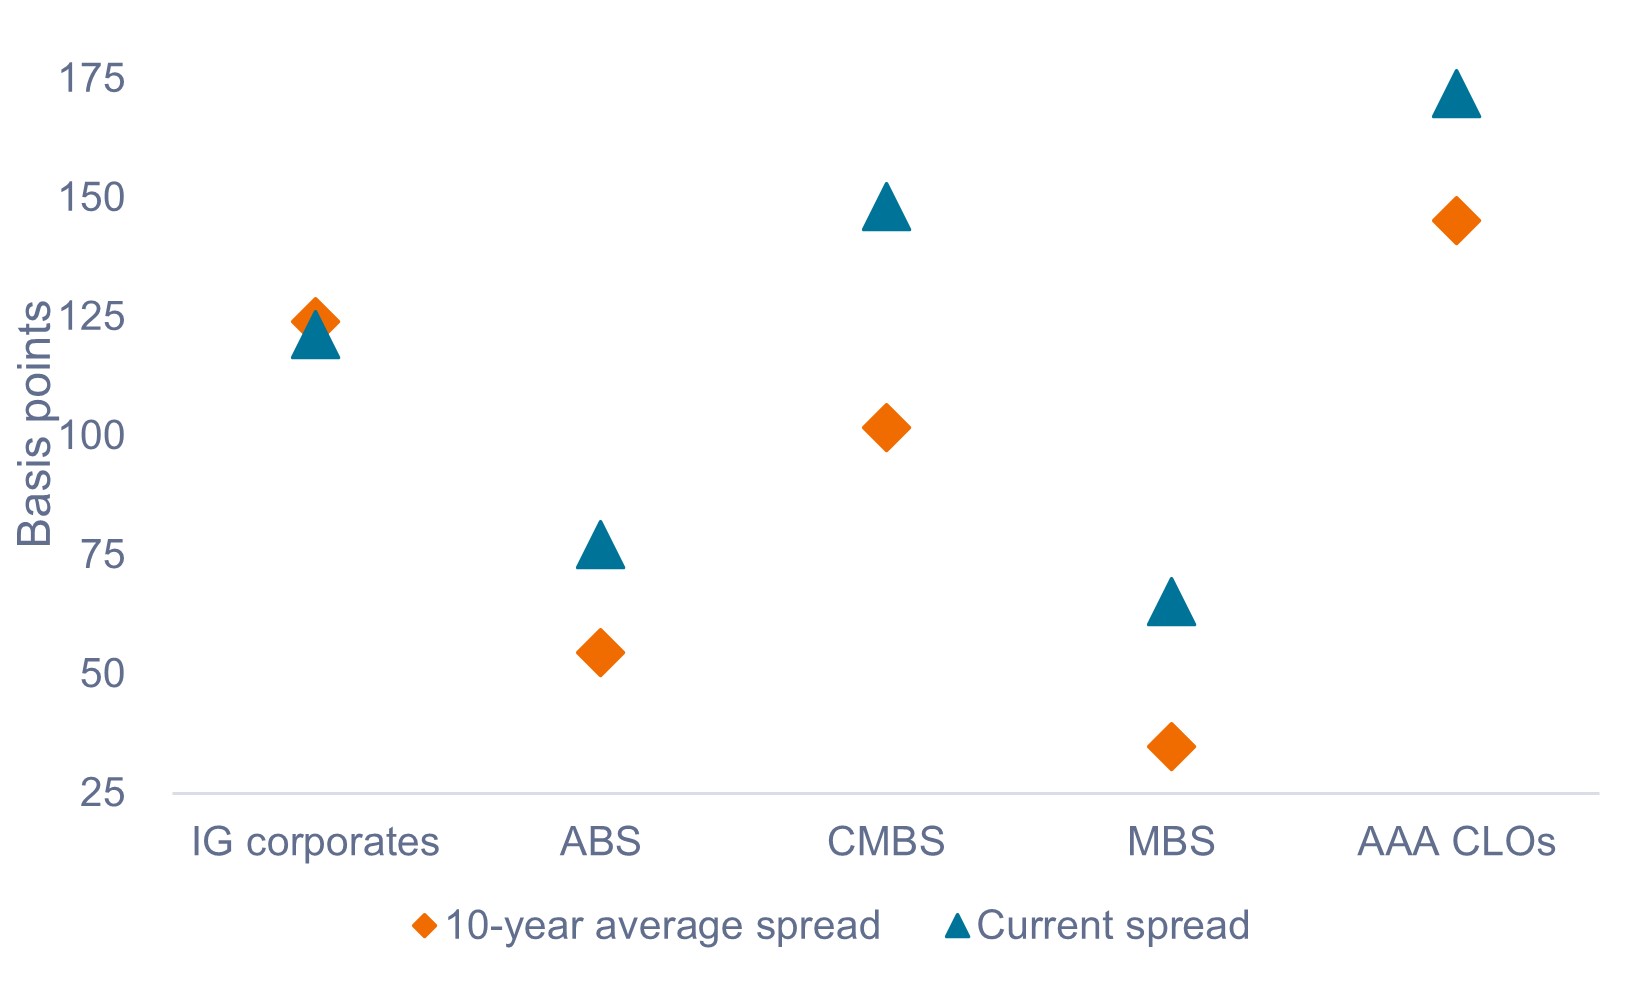 Source: Bloomberg, as of 10 November 2023. IG corporates = Bloomberg U.S. Corporate Bond Index, ABS = Bloomberg U.S. Aggregate Asset Backed Securities Index, CMBS = Bloomberg U.S. Commercial Mortgage Backed Securities Investment Grade Index, Agency MBS = Bloomberg Mortgage Backed Securities Index, AAA CLOs = J.P. Morgan CLO AAA Index. Past performance is no guarantee of future returns.
As investors look ahead to 2024, it will be important to remember that where we are today in fixed income markets is very different from where we have been in the preceding two years. In our view, the headwinds have dissipated, and bond markets have adjusted to a higher interest-rate regime. With attractive yields on offer, an end to the Fed hiking cycle, cooling inflation, and historically wide credit spreads in securitized sectors, we anticipate strong nominal and real returns from multi-sector fixed income in 2024.
10-Year Treasury Yield is the interest rate on U.S. Treasury bonds that will mature 10 years from the date of purchase.
Asset-backed securities (ABS): A financial security that is ‘backed’ (or collateralized) with existing assets (such as loans, credit card debts or leases), usually ones that generate some form of income (cash flow) over time.
Basis point (bp) equals 1/100 of a percentage point. 1 bp = 0.01%, 100 bps = 1%.
The Bloomberg U.S. Aggregate Asset Backed Securities (ABS) Index tracks fixed rate, investment-grade asset-backed securities. The index has three subsectors: credit and credit cards, autos, and utility.
The Bloomberg US Commercial Mortgage Backed Securities (CMBS) Investment Grade Index measures the investment-grade market of US Agency and US Non-Agency conduit and fusion CMBS deals with a minimum current deal size of $300mn.
The Bloomberg US Corporate Bond Index measures the investment grade, fixed-rate, taxable corporate bond market. It includes USD denominated securities publicly issued by US and non-US industrial, utility and financial issuers.
Bloomberg US Mortgage Backed Securities (MBS) Index measures the performance of U.S. fixed-rate agency mortgage backed pass-through securities.
Collateralized Loan Obligation (CLO): A bundle of generally lower quality leveraged loans to companies that are grouped together into a single security, which generates income (debt payments) from the underlying loans. The regulated nature of the bonds that CLOs hold means that in the event of default, the investor is near the front of the queue to claim on a borrower’s assets.
Commercial mortgage-backed securities (CMBS): fixed-income investment products that are backed by mortgages on commercial properties rather than residential real estate.
Credit Spread is the difference in yield between securities with similar maturity but different credit quality. Widening spreads generally indicate deteriorating creditworthiness of corporate borrowers, and narrowing indicate improving.
Correlation measures the degree to which two variables move in relation to each other. A value of 1.0 implies movement in parallel, -1.0 implies movement in opposite directions, and 0.0 implies no relationship.
Duration measures a bond price’s sensitivity to changes in interest rates. The longer a bond’s duration, the higher its sensitivity to changes in interest rates and vice versa.
Investment-grade bond: A bond typically issued by governments or companies perceived to have a relatively low risk of defaulting on their payments, reflected in the higher rating given to them by credit ratings agencies.
J.P. Morgan CLO AAA Index is a subset of the CLOIE index that only tracks the AAA rated CLO. J.P. Morgan Collateralized Loan Obligation Index (CLOIE) is comprised of US dollar denominated broadly syndicated arbitrage CLOs.
Mortgage-backed security (MBS): A security which is secured (or ‘backed’) by a collection of mortgages. Investors receive periodic payments derived from the underlying mortgages, similar to the coupon on bonds. Similar to an asset-backed security. Mortgage-backed securities may be more sensitive to interest rate changes. They are subject to ‘extension risk’, where borrowers extend the duration of their mortgages as interest rates rise, and ‘prepayment risk’, where borrowers pay off their mortgages earlier as interest rates fall. These risks may reduce returns.
A real yield is calculated by subtracting the expected inflation rate from a bond’s nominal yield.
S&P 500® Index reflects U.S. large-cap equity performance and represents broad U.S. equity market performance.
IMPORTANT INFORMATION
Diversification neither assures a profit nor eliminates the risk of experiencing investment losses.
Fixed income securities are subject to interest rate, inflation, credit and default risk. The bond market is volatile. As interest rates rise, bond prices usually fall, and vice versa. The return of principal is not guaranteed, and prices may decline if an issuer fails to make timely payments or its credit strength weakens.
Securitized products, such as mortgage- and asset-backed securities, are more sensitive to interest rate changes, have extension and prepayment risk, and are subject to more credit, valuation and liquidity risk than other fixed-income securities.
These are the views of the author at the time of publication and may differ from the views of other individuals/teams at Janus Henderson Investors. References made to individual securities do not constitute a recommendation to buy, sell or hold any security, investment strategy or market sector, and should not be assumed to be profitable. Janus Henderson Investors, its affiliated advisor, or its employees, may have a position in the securities mentioned.
Past performance does not predict future returns. The value of an investment and the income from it can fall as well as rise and you may not get back the amount originally invested.
The information in this article does not qualify as an investment recommendation.
Marketing Communication.
6 minute read
Key takeaways:
- Following three years of headwinds, fixed income markets today look very different than recent history.
- With attractive yields on offer, an end to the Fed hiking cycle, cooling inflation, and historically wide credit spreads in securitized sectors, we believe the prospects for U.S. fixed income look positive.
- In particular, we anticipate strong nominal and real returns from multi-sector fixed income in 2024 and believe we’re at an attractive entry point for investors to reevaluate their fixed income allocation.

