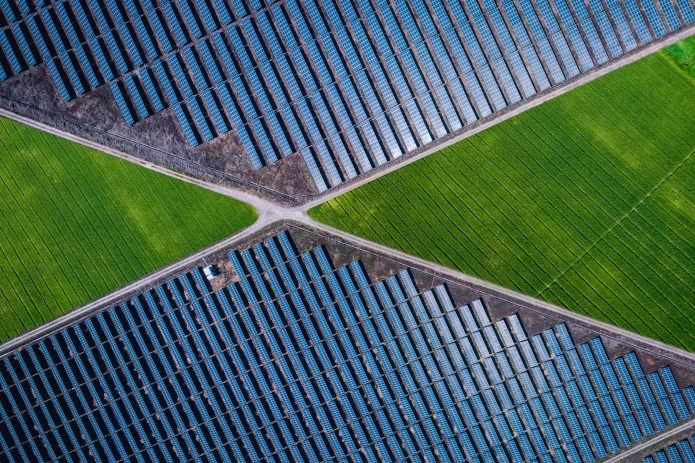
Since when did renewable energy become a contrarian call?
Richard Brown, European Equities Client Portfolio Manager, discusses what attractive valuations in the renewable energy sector could mean for investors in Europe.

6 minute read
Key takeaways:
- The renewable energy market has faced a challenging period marked by inflationary pressures and increased project financing costs.
- Although the political landscape in the US carries inherent risks, global climate targets suggest that the need for renewables remains intact.
- With the possibility of declining interest rates, there lies a potential opportunity to invest in a sector that could offer long-term growth at attractive valuations.
For much of the last market cycle the renewable energy industry has offered attractive returns for shareholders. Climate change has moved up the political agenda, stimulating higher levels of demand and, at the same time, technological innovation and cost deflation has made both solar and wind power far more competitive versus traditional fossil fuels. However, the aggressive inflationary cycle of 2022 and 2023 have seen project financing costs and raw materials costs rise. The uncertainty this has added to the profitability of future projects has seen many stocks within the sector de-rate to valuations that look attractive, especially as these inflationary pressures have lessened in recent months.
The last cycle
The renewable energy industry experienced significant cost deflation in the 2010s, dramatically shifting its competitiveness from something considered an expensive luxury to one that could genuinely compete with traditional fossil fuels. This deflation was driven by technological advances (e.g., solar module efficiency), larger turbines with larger blades, increased manufacturing economies of scale and vertical integration in the supply chain, amongst other factors.
Figure 1: Solar and wind cost deflation
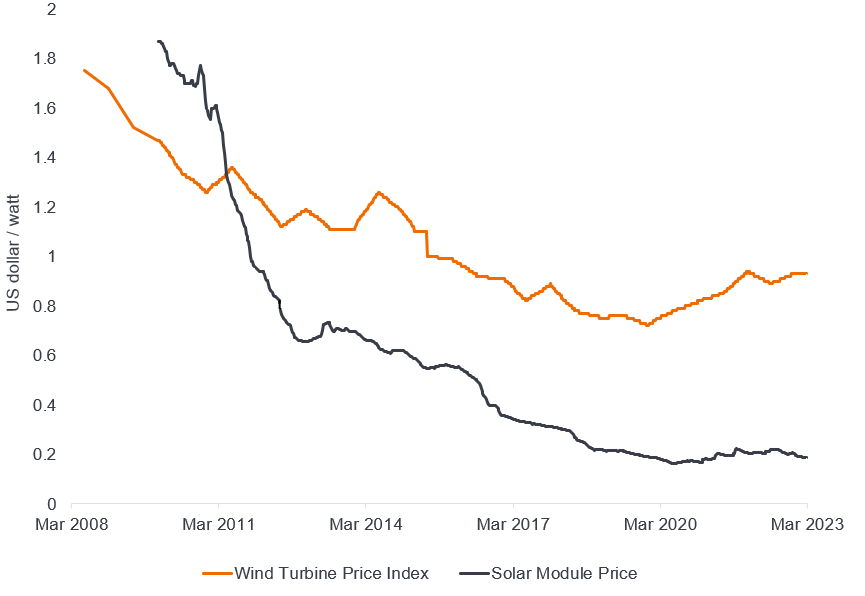
Source: Bloomberg, data as at 22 March 2023. For illustrative purposes only.
In 2010, the cost of onshore wind was 95% higher than the lowest fossil fuel cost. By 2022, new onshore wind projects were 52% lower than the cheapest fossil fuel-fired option, marking a dramatic shift in the competitive landscape.1
Shareholder returns
Strong shareholder returns followed, with the average European renewable energy company producing a 138% return over the 5 years to end 2020. However, since rates started to rise, their fortunes have reversed, returning -17.2% on average, well below the 21% delivered by the European market as a whole.
Figure 2: Fortunes have reversed for European renewables
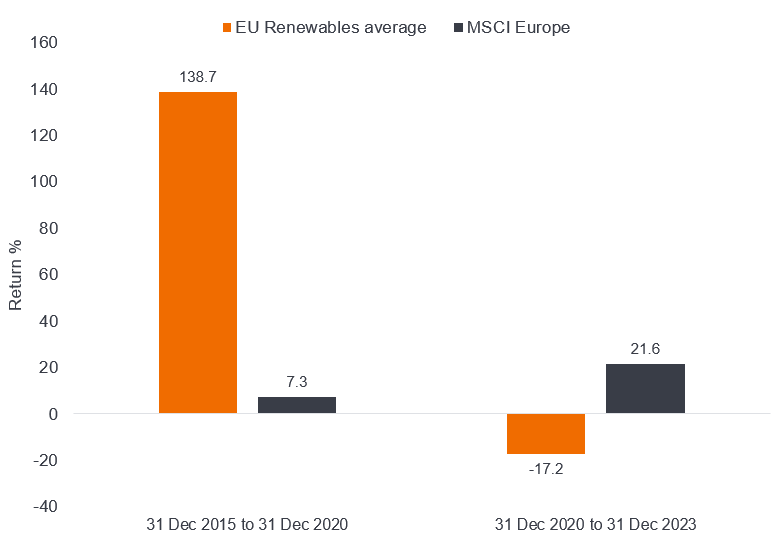
Source: Janus Henderson, MSCI ESG, Bloomberg, based on JH European curated bucket, outliers removed. Past performance does not predict future returns.
Renewable energy projects are particularly rate sensitive as most wind and solar farms are reliant on project financing; they require wind and solar developers to borrow a lot of capital up front to put the infrastructure in place before receiving the revenue over the life of the farm.
This can be illustrated using the matrix in Figure 3, which shows a theoretical wind and solar project’s levelized cost of electricity (LCOE). The LCOE is a measure of the average net present cost of electricity generation for a generator over its lifetime (including build, running and financing costs). It is the industry standard measure to compare the cost of various energy production assets/methods and is useful for comparing renewable energy cost to that of fossil fuels or the market rate.
The matrix shows the cost to produce each megawatt of energy in Euros and how this cost changes depending on the level of interest rates. At today’s European Central Bank base rate of 4.5%, the cost for each megawatt hour on the wind project is approximately €98-99, compared to the German base load forward price (the price the company can sell the energy for), which is €93. This means the project would lose €5 for every megawatt hour sold. However, if base rates fall back below 4%, as they are forecast to do by year end 2024, the project becomes profitable once again. But given the uncertainty around the direction of rates it is understandable that developers are pulling back from certain projects, potentially slowing the transition to renewable energy.
Figure 3: Cost matrix of wind and solar energy at different interest rates
| Base interest rate | |||||
| 2% | 3% | 4% | 5% | 6% | |
| Offshore wind LCOE (€/MWh) | 85 | 90 | 96 | 101 | 107 |
| Solar LCOE (€/MWh) | 34 | 37 | 40 | 43 | 46 |
Source: Goldman Sachs research, Janus Henderson Group. There is no guarantee that past trends will continue, or forecasts will be realised.
Figure 4: German base load forward price
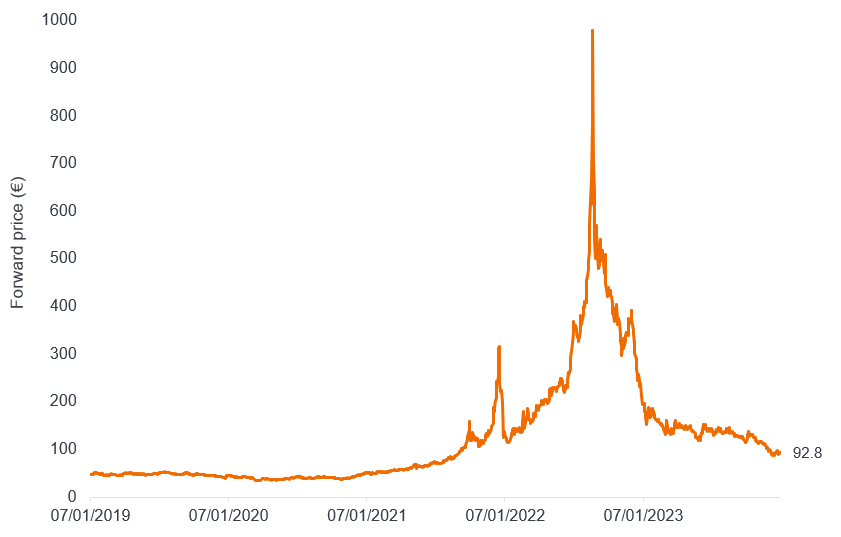
Source: Bloomberg, as at 31 December 2023. Base load forward price refers to the price at which a company can sell energy. Past performance does not predict future returns.
What is also clear from the matrix is the cost advantage of a typical solar farm versus that of offshore wind. However, peak solar generation happens in the middle of the day and is largely weather reliant, causing too great a demand on battery storage for solar to be the only or primary supplier to the grid. Conversely, wind generation is generally more consistent throughout the day and year, and we therefore expect it to remain vital in balancing the grid despite the higher cost.
Raw materials
There has been a similar picture for other costs such as raw materials – steel for turbines for example, which accounts for a large part of the total mass of a turbine. After a strong inflation period through 2021 and 2022, we are now seeing some cost normalisation easing the margin pressure on new projects.
Figure 5: Steel prices are levelling out
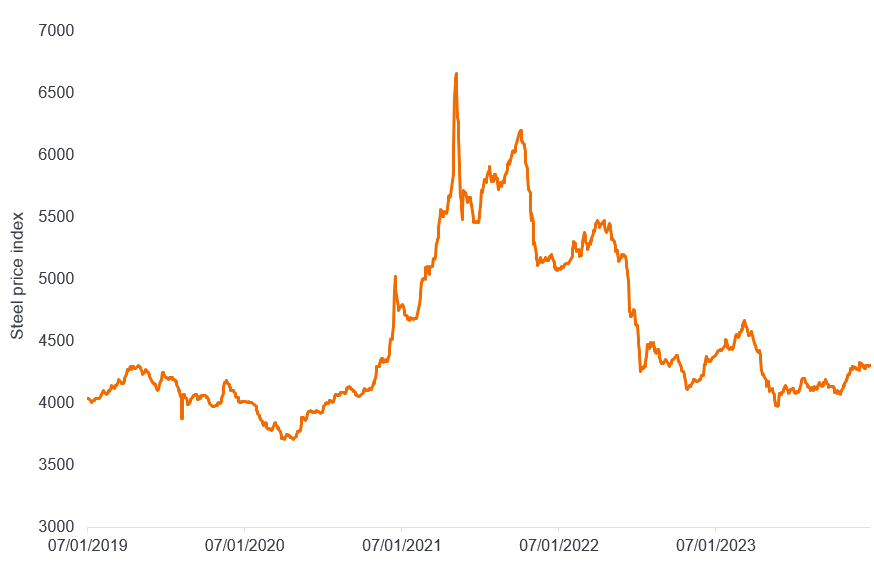
Source: Bloomberg, as at 31 December 2023. Past performance does not predict future returns.
Risks to the deflationary bounce?
Unfortunately, the sector is never too far away from politics, which is hard to calibrate for us as stock pickers. An election victory for former president Donald Trump could mean a repeal of the Inflation Reduction Act (or at least the green spending that it is part of the programme), causing a meaningful hit to earnings. Such a large repeal would likely require the support of the US Congress which makes it unlikely to happen, but it remains a risk nonetheless. More broadly, governments have also been reluctant to adjust auction parameters (the price they will pay for the energy) to respond to new market conditions in a bid to prioritise keeping costs to the electorate/consumers down.
Yet, there remains a broad consensus from stakeholders that we need to make wind and solar work, and that must involve a functioning and profitable private sector. We think investors should take note of the COP 28 (December 2023, Dubai) climate summit target of tripling renewable capacity by 2030, a figure which went largely unreported, which indicates long-term government support for new renewable energy projects. Another interesting datapoint comes from the UK, where the government recently raised its Administrative Strike Price (maximum price) for the upcoming auctions by over 65%. The willingness for other governments to follow will be key for the sector.
In conclusion, the renewable energy market has faced a challenging period marked by inflationary pressures and increased project financing costs. Although the political landscape in the US carries inherent risks, investors would do well to monitor the sector closely in 2024. With the possibility of declining interest rates, there lies a potential opportunity to invest in a sector that could offer long-term growth at present valuations far removed from the excessive peaks of 2020.
1 The International Renewable Energy Agency, IRENA, an intergovernmental organisation.
De-rate – The downward adjustment of a company’s financial valuation in response to business or market uncertainty. i.e. a falling price to earnings multiple
These are the views of the author at the time of publication and may differ from the views of other individuals/teams at Janus Henderson Investors. References made to individual securities do not constitute a recommendation to buy, sell or hold any security, investment strategy or market sector, and should not be assumed to be profitable. Janus Henderson Investors, its affiliated advisor, or its employees, may have a position in the securities mentioned.
Past performance does not predict future returns. The value of an investment and the income from it can fall as well as rise and you may not get back the amount originally invested.
The information in this article does not qualify as an investment recommendation.
Marketing Communication.
6 minute read
Key takeaways:
- The renewable energy market has faced a challenging period marked by inflationary pressures and increased project financing costs.
- Although the political landscape in the US carries inherent risks, global climate targets suggest that the need for renewables remains intact.
- With the possibility of declining interest rates, there lies a potential opportunity to invest in a sector that could offer long-term growth at attractive valuations.


