Multi-sector income
An active approach to capturing opportunities across global fixed income sectors.
Why Multi-Sector Fixed Income matters now
The global fixed income universe is vast, spanning numerous sectors and industries, each with different credit and interest rate risks. A Multi-Sector Income Fund aims to allow investors to maximise income and diversification by allocating flexibly to the most compelling opportunities.
How our Multi-Sector Income Fund works
Capturing global opportunities
Actively positioning the portfolio to access a breadth of sectors and diversification.
Optimal risk blend
Balancing fixed income risk exposures with the aim of supporting smoother returns and delivering resilient outcomes across different market environments.
Aiming to deliver consistent income
Dynamically allocating to maximise yield per unit of volatility.
Delivered competitive risk-adjusted returns
The chart compares annualised return and volatility over three years, five years and since inception, illustrating the fund's aim to improve risk-adjusted outcome versus a core bond benchmark.
Multi-Sector Income Fund risk/return profile versus US Aggregate Bond Index
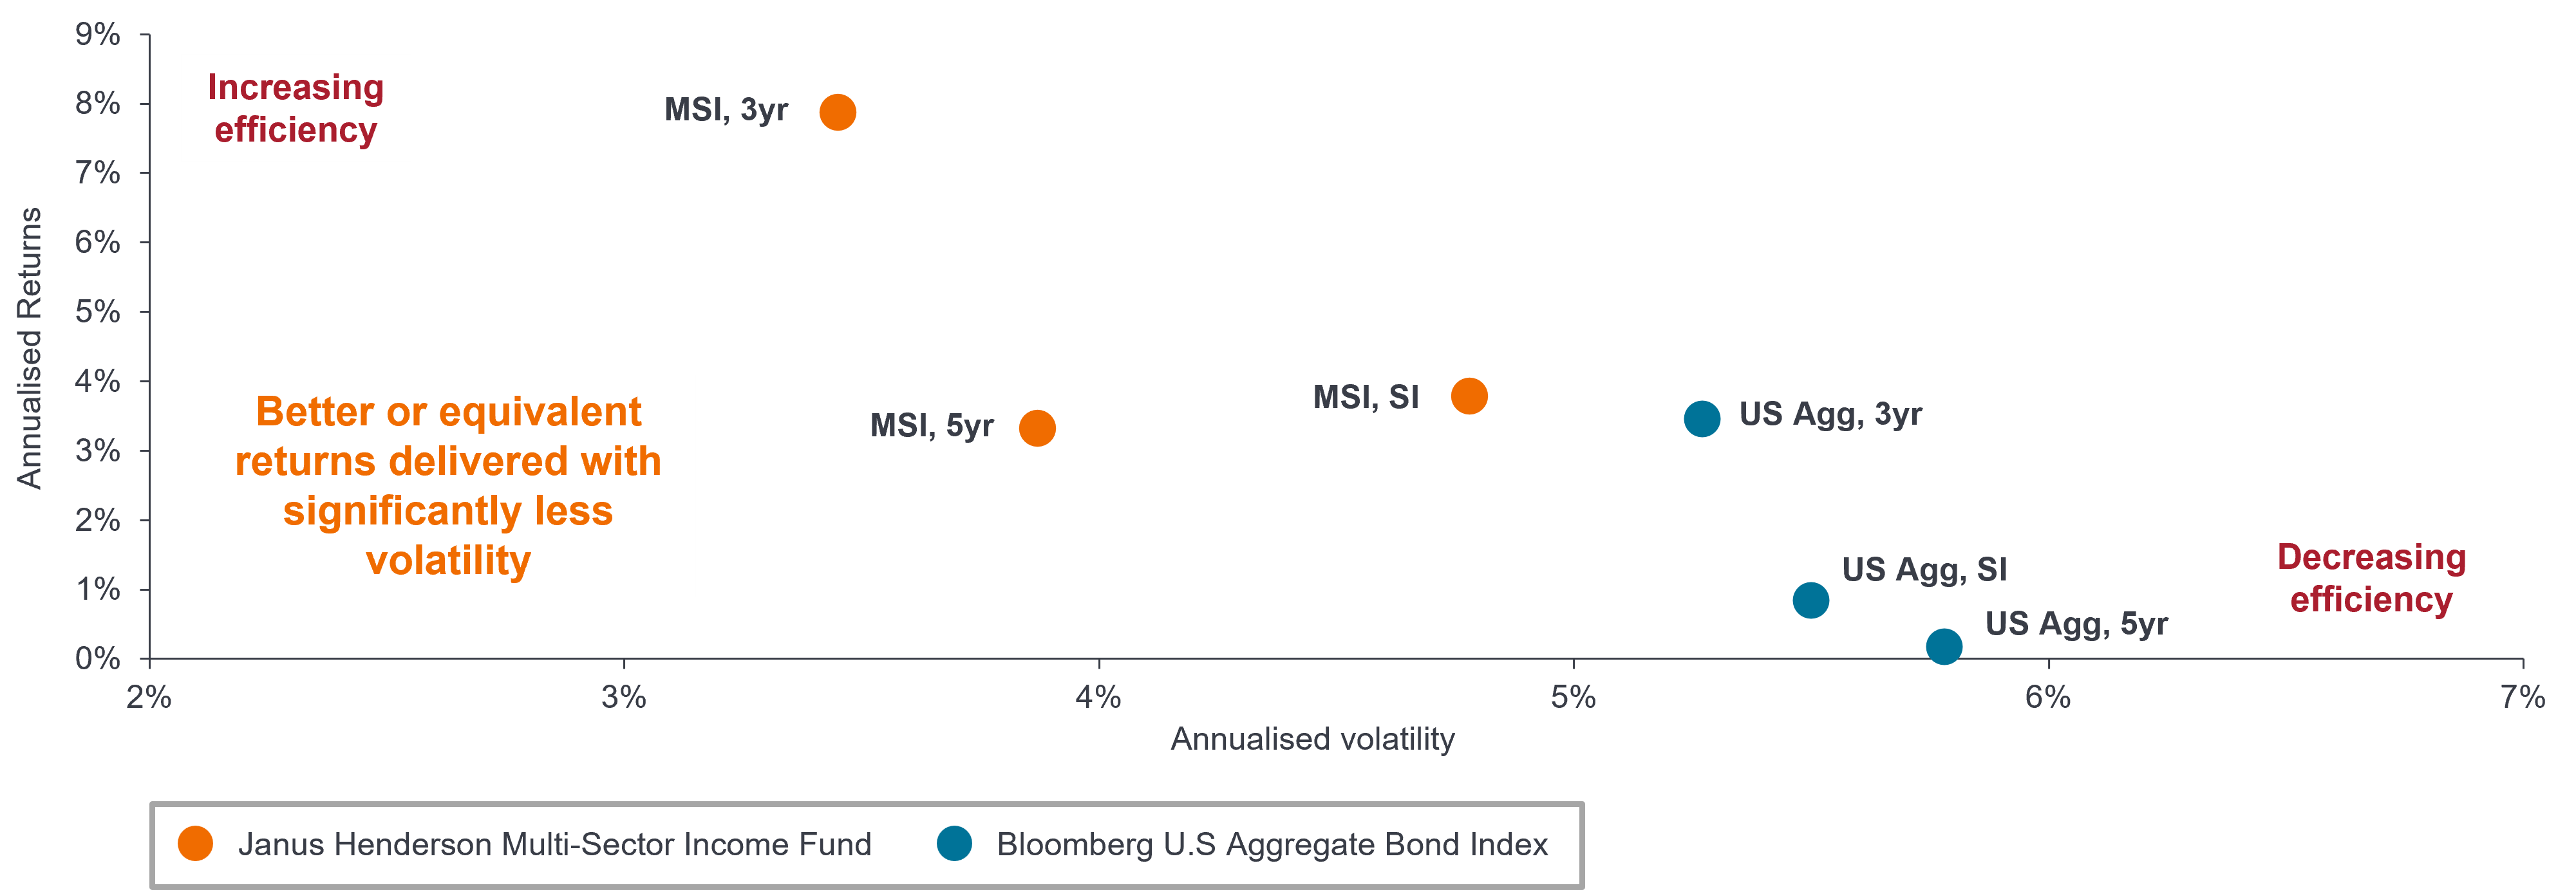
Source: Janus Henderson Investors, as at 30 April 2026.
Note: Since inception (SI) date: 4 December 2019.
Fund: Janus Henderson Multi-Sector Income Fund A2 USD, Gross of fees (AMC), in USD. Comparator Benchmark: Bloomberg U.S Aggregate Bond Index. Fees can have a material impact on the value of your investment. Past performance does not predict future returns.
Calendar year returns
| Performance (%) | YTD at 1Q26 | 2025 | 2024 | 2023 | 2022 | 2021 | 2020 | 2019* |
|---|---|---|---|---|---|---|---|---|
| Multi-Sector Income Fund (A2 USD) | -0.86 | 8.29 | 6.03 | 8.35 | -12.55 | 1.91 | 4.38 | 0.40 |
| Bloomberg US Aggregate Bond Index | -0.05 | 7.30 | 1.25 | 5.53 | -13.01 | -1.54 | 7.51 | -0.05 |
| USD Flexible Bond - OE | -0.88 | 7.70 | 4.27 | 6.07 | -9.38 | -0.24 | 6.86 | 0.74 |
Source: Janus Henderson Investors, as at 31 April 2026.
Note: *Partial year performance from 04 December 2019, as at Fund inception.
Fund: Janus Henderson Multi-Sector Income Fund, A2 USD shares, net of fees, in USD. Inception: 04 December 2019. Benchmark: Bloomberg US Aggregate Bond Index. Peer group category: EAA Fund USD Flexible Bond. Peer group average is based on valuation point of underlying funds in universe. Past performance does not predict future returns. Investing involves risk, including the possible loss of principal and fluctuation of value.
For important information on standard performance please see the fund page.
Our competitive edge
Global platform
Led by founding portfolio managers and supported by a robust global platform, we offer extensive sector expertise and comprehensive relative value insights.
Dynamic sector allocation
We adopt an agile, active approach, utilising sector outlooks and proprietary quantitative tools to inform relative value opportunities and adapt seamlessly to evolving market conditions.
Our best ideas
We seek the best part of the capital structure and use our knowledge of an issuer and sector from the loan market to the bond market and vice versa.
Why Janus Henderson for Fixed Income?
- Rigorous fundamental analysis, deep experience, and advanced quantitative tools combine to provide the perspective needed in seeking to generate high-conviction ideas and identify relative value.
- From pioneering securitised strategies to advancing active fixed income ETFs, innovation is core to our approach.
- All this is built on the foundation of more than 40 years of delivering fixed income solutions for our clients.

The role of U.S securitised assets in the Global Financial Crisis
John Kerschner, CFA, Global Head of Securitised Products and Portfolio Manager at Janus Henderson, explores how the securitised asset market has evolved since 2008. He examines the structural reforms that followed the financial crisis and why securitised assets may offer attractive opportunities for multi-sector fixed income investors.
U.S Securitised Assets: How 2008 Compares to Today
Download the report to hear from Head of U.S Securitised Products, John Kerschner, as he provides an overview of the securitisation process, and highlights the differences between securitised markets in 2008 vs Today.