Chart to Watch: What’s behind the curious path of 10-year Treasury yields?
Head of Global Short Duration and Liquidity Daniel Siluk notes that myriad factors could be behind persistently high 10-year U.S. Treasury yields – and that investors should be aware of all of them.
A higher 10-year Treasury yield this far into an easing cycle may indicate that investors are conscious of persistent inflation or are growing increasingly aware of the stress ‘fiscal dominance’ could place on developed market bonds.
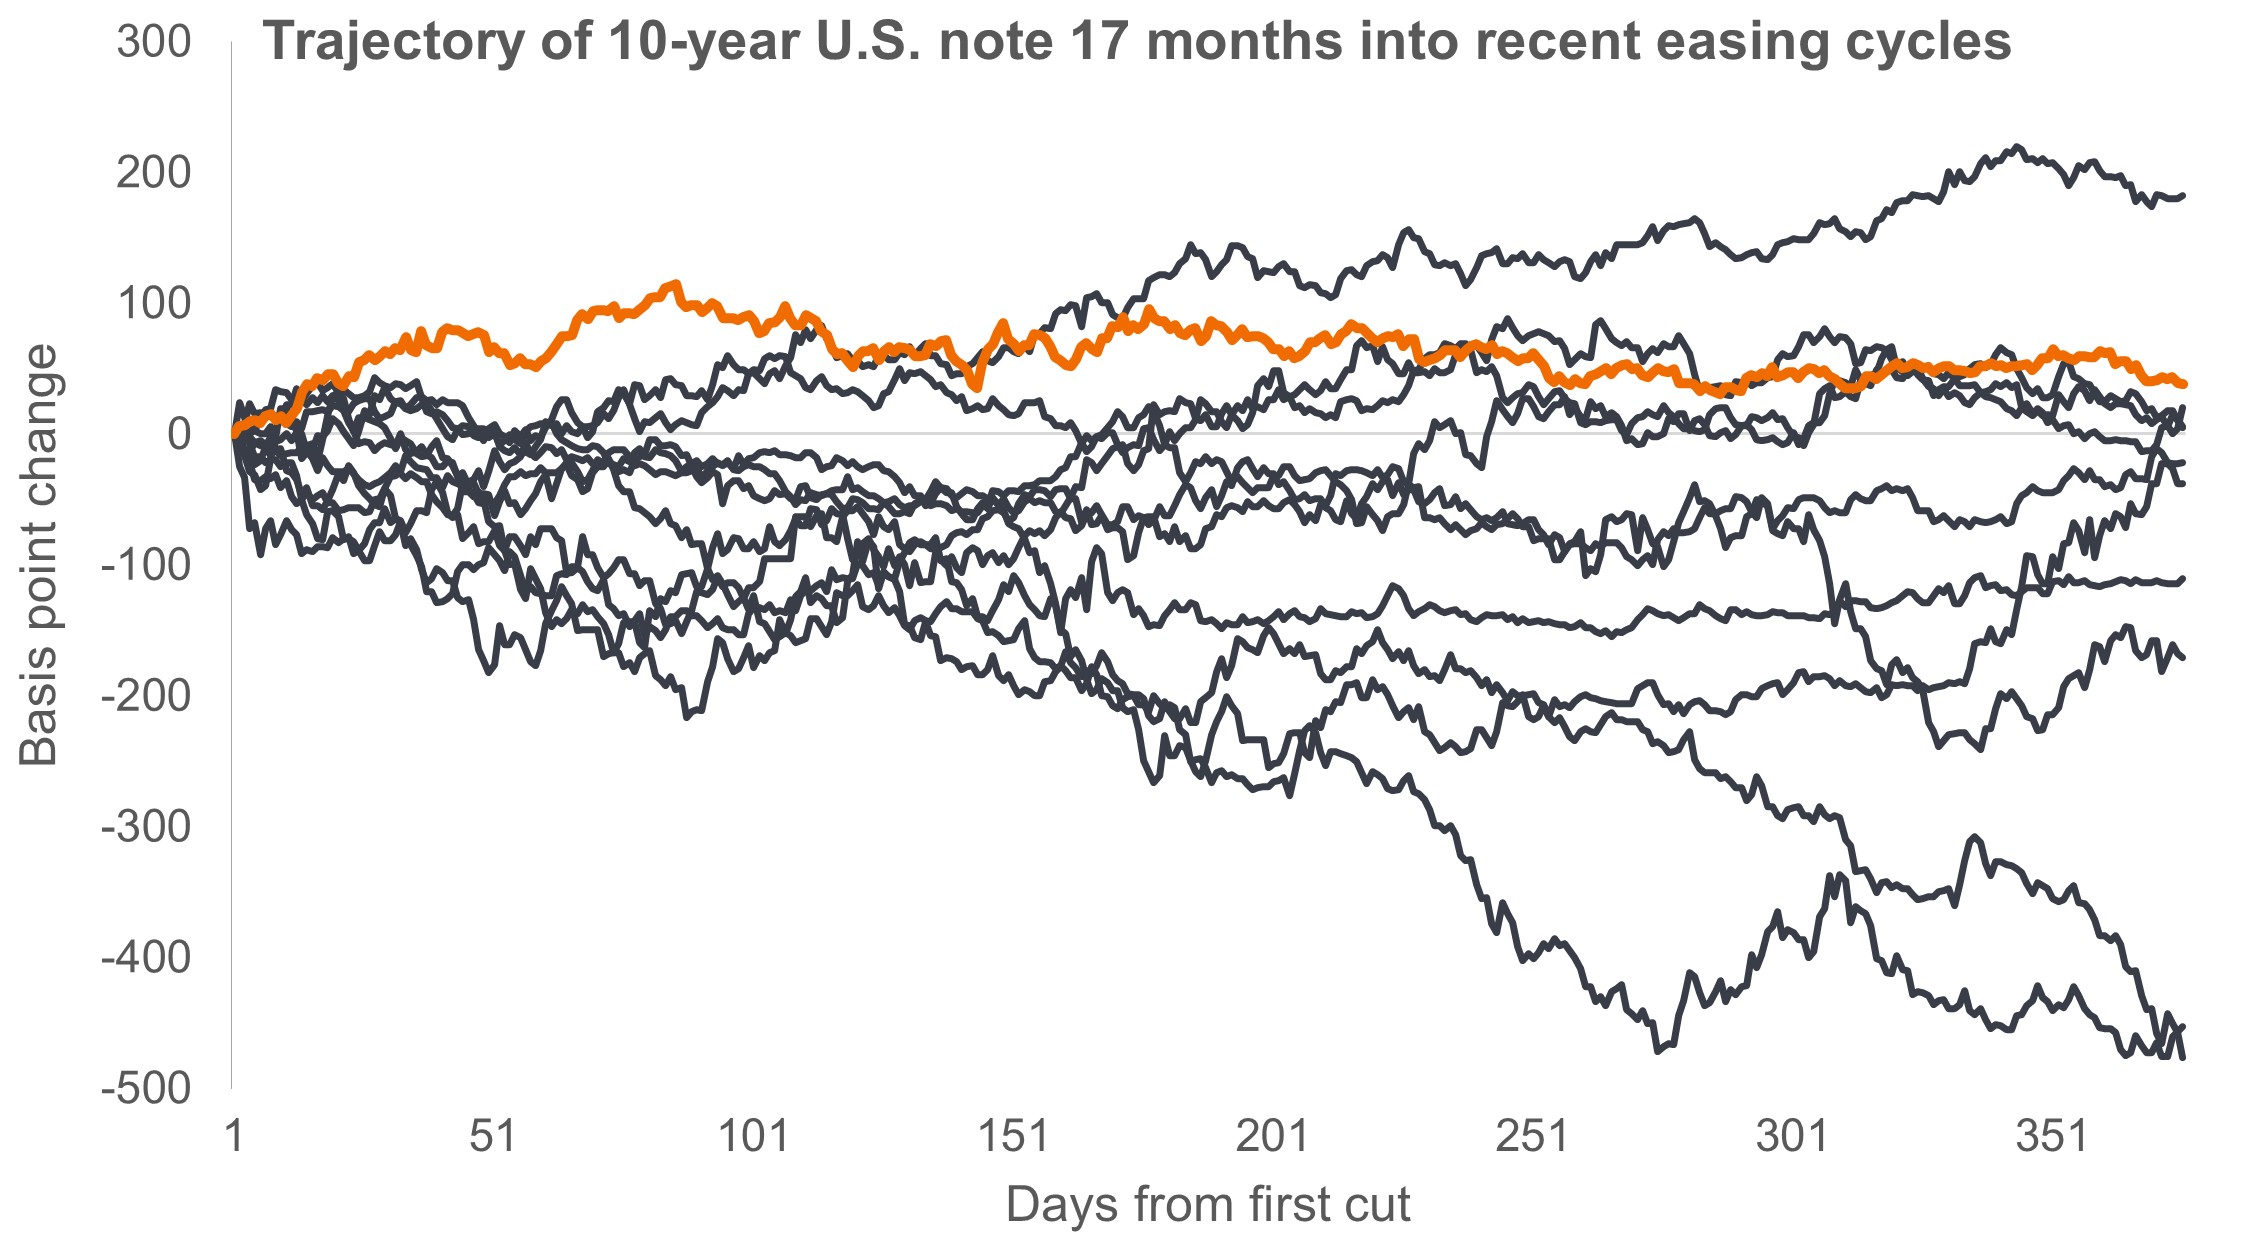
Source: Janus Henderson Investors, Bloomberg, as of 30 January 2026.
While a steeper yield curve reflects a certain return to normalcy, the risks posed by structurally higher inflation and ‘fiscal dominance’ must be appropriately weighed by bond investors when making allocation decisions. -Daniel Siluk
Key Takeaways
- Nearly 18 months into the current easing cycle, the yield of the 10-year U.S. Treasury has risen more than in all but one of the 11 most recent easing periods.
- Rising yields could indicate a period of normalization after a decade-plus of extraordinary policy, or they could signal that above-target inflation is here to stay.
- Elevated yields may also reflect a nascent era of fiscal dominance marked by the combination of increased defense expenditures and stretched entitlement outlays – due to unfavorable demographics – pushing government deficits higher.
The commencement of an easing cycle – one would think – has the potential to push up mid- to longer-dated Treasury yields as investors price in higher levels of economic growth and the inflation that could accompany it.
Recent history tells a different story. This far into the past 11 easing cycles, 10-year Treasury yields were lower than they had been just prior to the first rate cut seven times. Context helps explain this peculiarity. Many of these cycles occurred during the great moderation – an era marked by the disinflationary impact of low-cost labor entering a globalizing economy. This was followed by the era of financial repression1 as the Federal Reserve (Fed) expanded its balance sheet by becoming the marginal buyer of Treasuries in the wake of the Global Financial Crisis. That episode of quantitative easing paled in comparison to the Fed’s response to the COVID-19 pandemic.
The current easing cycle – 175 basis points thus far – has pulled 2-year yields down to as low as 3.42% and sent the 10-year in the opposite direction. The subsequent steepening of the yield curve could be viewed as reflecting policy normalization and a return of a term premium unfettered by an assertive central bank.
Investors should, however, be aware of other forces that may be at work. In developed markets, the era of big government is evidently not over after all. Heighted geopolitical risk has forced Europe to commit to increased defense outlays. More recently, the Trump administration has proposed a significantly toothier $1.5 trillion defense budget. Poor demographics only exacerbate matters with rising dependency ratios in the U.S., Japan, and much of Europe stressing social safety nets.
The upshot is the steepening yield curve may contain signals about the future state of the U.S. and global economies – and bond markets – that investors should not ignore.
Higher government debt, the potential inflationary impact of deglobalization – including tariffs – and possibly higher real economic growth due artificial intelligence (AI) all lend credence to 10-year yields remaining above 4.0%. And while that is an attractive level relative to the past 15 years, investors would have to accept an array of unforeseen risks, including inflation reversing course or geopolitical discord igniting a sell-America trade.
1Financial repression is the concept that monetary policy is used as an instrument to manipulate interest rates across the yield curve, often to the benefit of highly indebted actors in an economy, including governments.
2Quantitative easing is a monetary policy tool typically entailing expanding a central bank’s balance sheet to increase the level of reserves – and thus broad money – in the banking system.
10-Year Treasury Yield is the interest rate on U.S. Treasury bonds that will mature 10 years from the date of purchase.
Basis point (bp) equals 1/100 of a percentage point. 1 bp = 0.01%, 100 bps = 1%.
Monetary Policy refers to the policies of a central bank, aimed at influencing the level of inflation and growth in an economy. It includes controlling interest rates and the supply of money.
A yield curve plots the yields (interest rate) of bonds with equal credit quality but differing maturity dates. Typically bonds with longer maturities have higher yields. Basis point (bp) equals 1/100 of a percentage point. 1 bp = 0.01%, 100 bps = 1%.
These are the views of the author at the time of publication and may differ from the views of other individuals/teams at Janus Henderson Investors. References made to individual securities do not constitute a recommendation to buy, sell or hold any security, investment strategy or market sector, and should not be assumed to be profitable. Janus Henderson Investors, its affiliated advisor, or its employees, may have a position in the securities mentioned.
Past performance does not predict future returns. The value of an investment and the income from it can fall as well as rise and you may not get back the amount originally invested.
The information in this article does not qualify as an investment recommendation.
There is no guarantee that past trends will continue, or forecasts will be realised.
Marketing Communication.