2023’s home stretch: What we are watching
With the weight of elevated interest rates potentially cooling the appetite of the economic growth engine that is the U.S. consumer, Global Head of Multi-Asset Adam Hetts explains why investors should take a defensive stance by prioritizing quality companies and cross-asset diversification.


6 minute read
Key takeaways:
- The prospect of policy rates remaining elevated for the foreseeable future has diminished the hope that the U.S. economy could nail a soft landing.
- In the wake of higher borrowing costs, we doubt that U.S. consumers can maintain their pace of spending, which has been increasingly financed by debt.
- In anticipation of the global economy losing this powerful growth engine, we believe investors should prioritize quality companies capable of steady cash flows and possessing sound financials as we enter the later stages of the cycle.
Along with the change of seasons in the northern hemisphere, global financial markets have decidedly cooled in recent months. We believe this reflects a widening range of economic outcomes as a much hoped-for soft landing becomes less of a sure thing. While it may appear that a resilient economy and steady corporate performance belie our growing sense of caution, we see a common thread among key indicators that reveals an environment that is potentially more fragile than many market participants realize.
Woe be the consumer?
As evidenced by blow-out third-quarter U.S. gross domestic product (GDP) data, the U.S. consumer continues to power the domestic economy. Consumption accounted for 2.69 percentage points of the aggregate 4.9% annualized quarterly growth rate. We don’t know how much longer this pace can last. The bulge in personal savings owed to pandemic-era stimulus packages has largely run its course. Furthermore, consumption has more recently been powered by credit cards. With borrowing costs having reset to decade-plus highs, we question American households’ desire – or ability – to keep racking up such purchases.
U.S. personal savings and credit card debt
Households are saving less of their pay checks than they did prior to the pandemic, and credit card debt since the end of 2021 has grown at twice the pace of overall consumer debt, topping out at over $1 trillion.
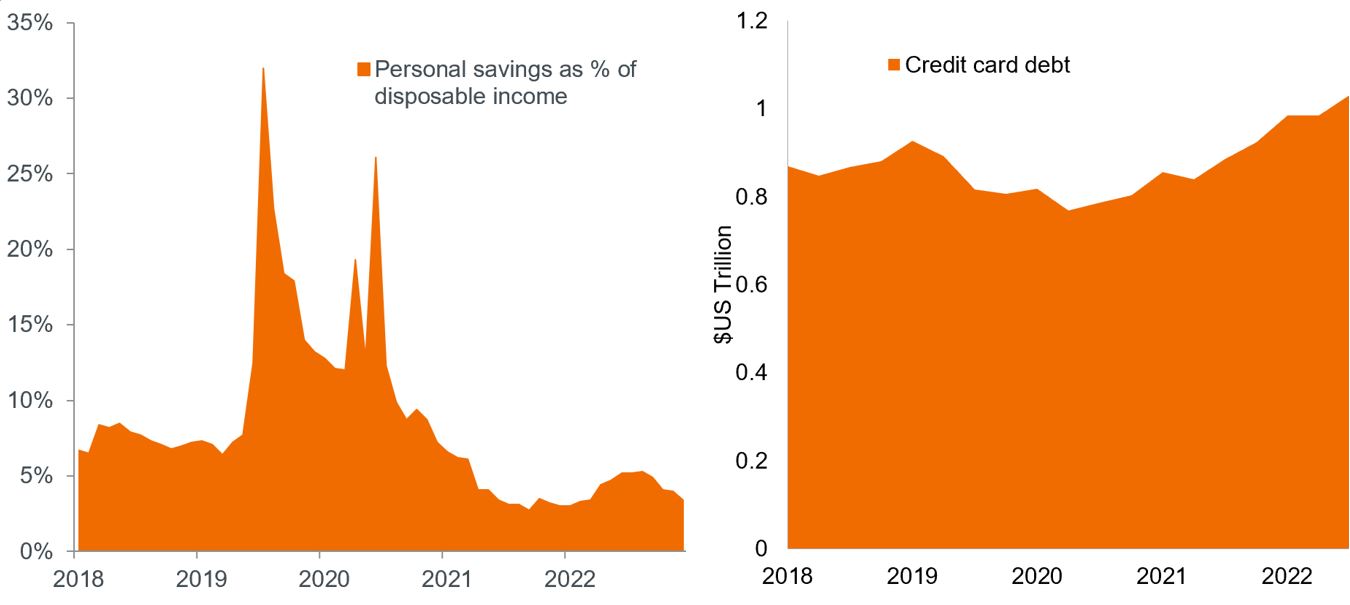
Source: Bloomberg, personal savings as of 30 September, 2023; credit card debt as of 30 June, 2023.
Higher, longer, inevitable
Our reason for doubting consumption’s durability is our long-held view that policy rates will remain elevated for longer – an assessment that is now largely accepted by the market. Compounding this risk is our belief that the U.S. economy – and others, for that matter – have yet to feel the full brunt of previous rate hikes. Relative to other tightening cycles, we are still in fairly early innings, meaning the curtailment of demand that is the intention of hawkish policy is still working its way through the system. Already business investment has slowed, with non-residential fixed investment contributing nothing to third-quarter GDP growth.
Market-based policy rate forecasts
In many markets, expectations of an early 2024 policy pivot have been tempered.
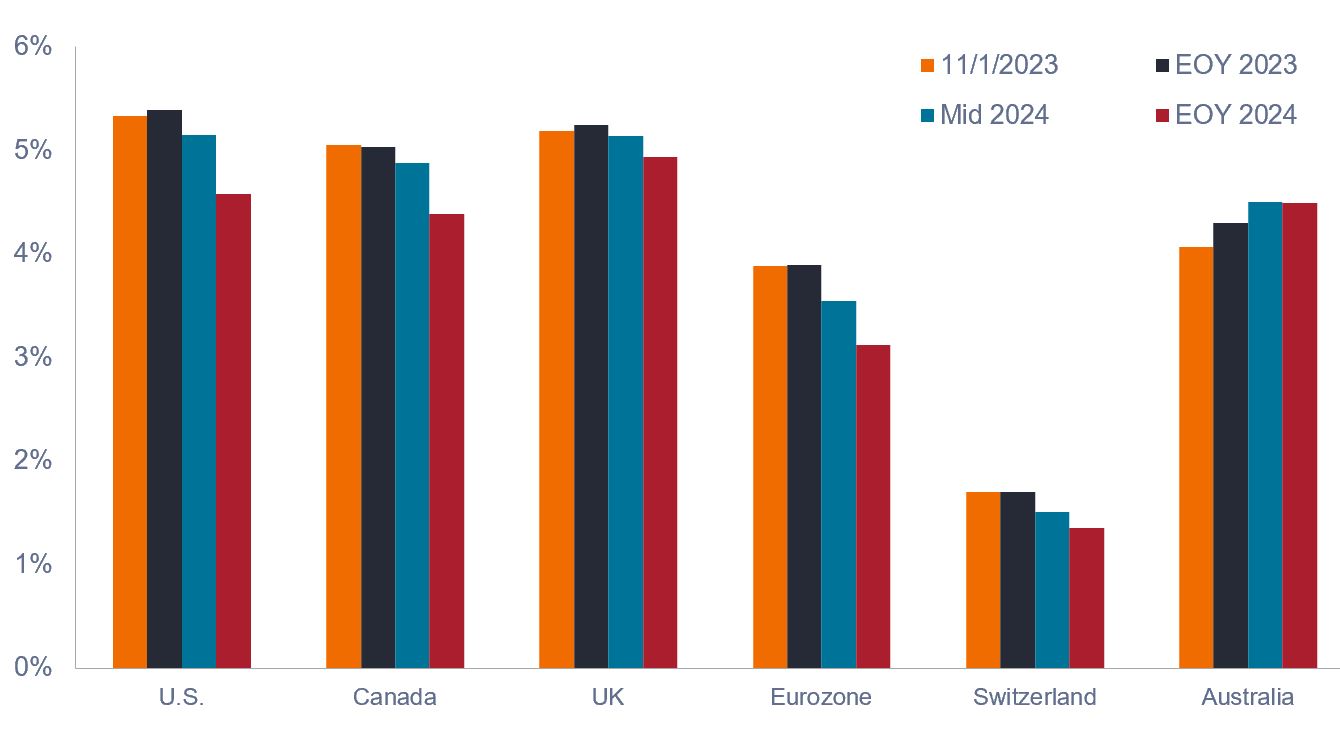 Source: Bloomberg, as of 01 November 2023; 1 November data reflect current effective rate.
Perhaps the most powerful signal that economic growth faces headwinds is the meteoric rise in real yields, with that of the 10-year Treasury at roughly 2.50%. This represents the highest cost of capital in inflation-adjusted terms in 15 years. Importantly, nominal yields have continued to climb even as inflation has subsided. We interpret this as the recognition of a potential regime change in rates. Consequently, corporate managers will likely become more selective when allocating capital, as returns on investments must meet a higher threshold.
Composition of nominal 10-year U.S. Treasury yields
At well above 2.0%, the inflation-adjusted yield on the 10-year Treasury represents the highest cost of capital U.S. businesses and households have faced in over a decade.
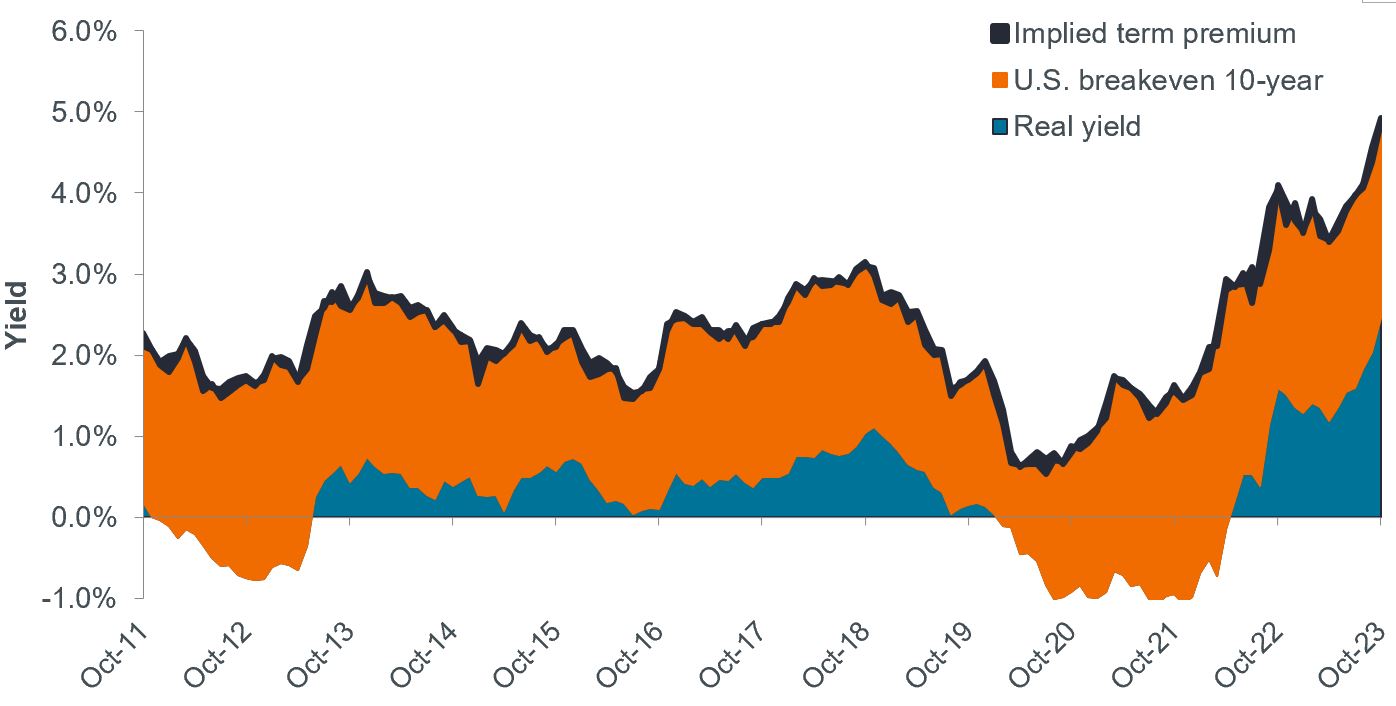
Source: Bloomberg, as of 31 October 2023.
Markets: Staying invested, staying defensive
With both equities and bonds well beneath their mid-year highs, some investors may presume current prices adequately reflect the myriad risks posed by elevated rates. But we believe it’s too early to sound the “all clear.” Within fixed income, mid- to longer-date Treasuries and mortgage-backed securities (MBS) have borne the brunt of the sell-off. Given our view that rates are likely nearing their peak in the U.S., these segments could merit consideration for investors seeking attractive yields.
This view, however, does not carry over to high-yield corporates, as the spread between their yields and those of their risk-free benchmarks remains below long-term averages. Our concerns for this segment are compounded by the risk of a harder-than-expected landing, which could stress some of these companies’ leveraged business models.
Spreads between corporate bond yields and those of their risk-free benchmarks
Lower quality corporate bonds – especially at current valuations – are likely more vulnerable to an economic slowdown than are investment-grade corporates and MBS.
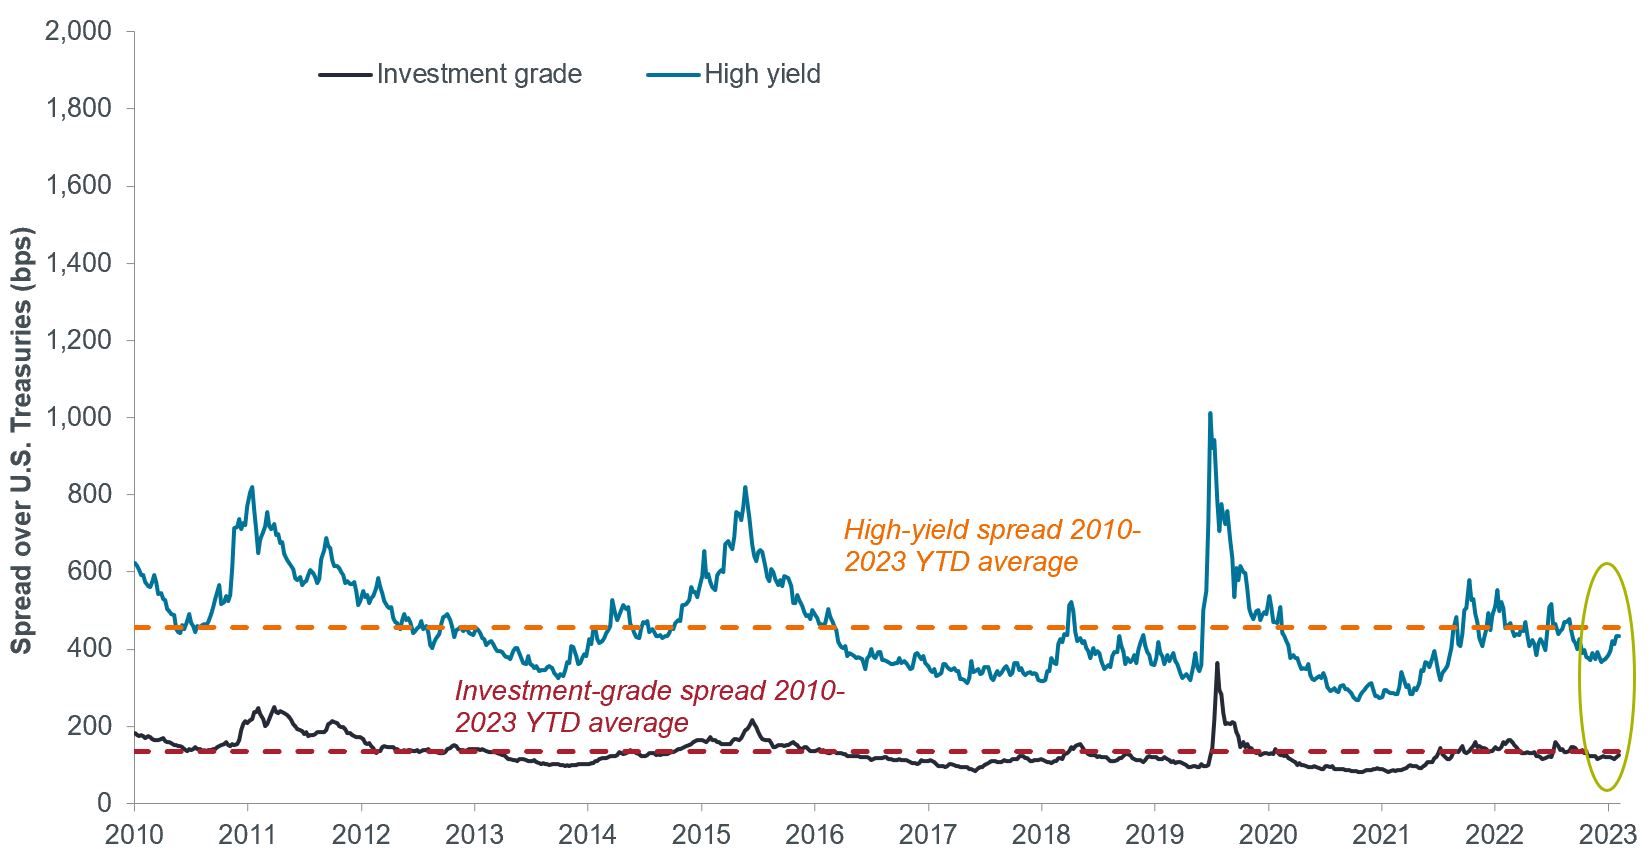
Source: Bloomberg, as of 31 October 2023.
Similarly, we don’t see risks dispersed evenly across the equities landscape. Over the course of 2023, mega-cap technology and Internet names have held up better than the broader market, and their valuations remain above their long-term averages. Yet unlike still-frothy high-yield credit, many of these business models, in our view, are well positioned to weather an economic downturn given their consistent cash flow generation, strong balance sheets, and exposure to durable secular themes. Value and more cyclically exposed names, on the other hand, could come under additional pressure in a slowing economy.
Despite gathering headwinds, earnings estimates for U.S. stocks have held up well during the sell-off, while estimates for ex-U.S. equities have proven softer. The resilience of tech’s business models has likely played a role in U.S. estimates holding firm, but we are less confident in other sectors should the country’s consumption engine lose steam.
Composition of 2023 year-to-date total equity returns
While earnings revisions have indicated healthier corporate performance than previously expected, across most markets, 2023 total stock returns have largely been driven by multiple expansion.
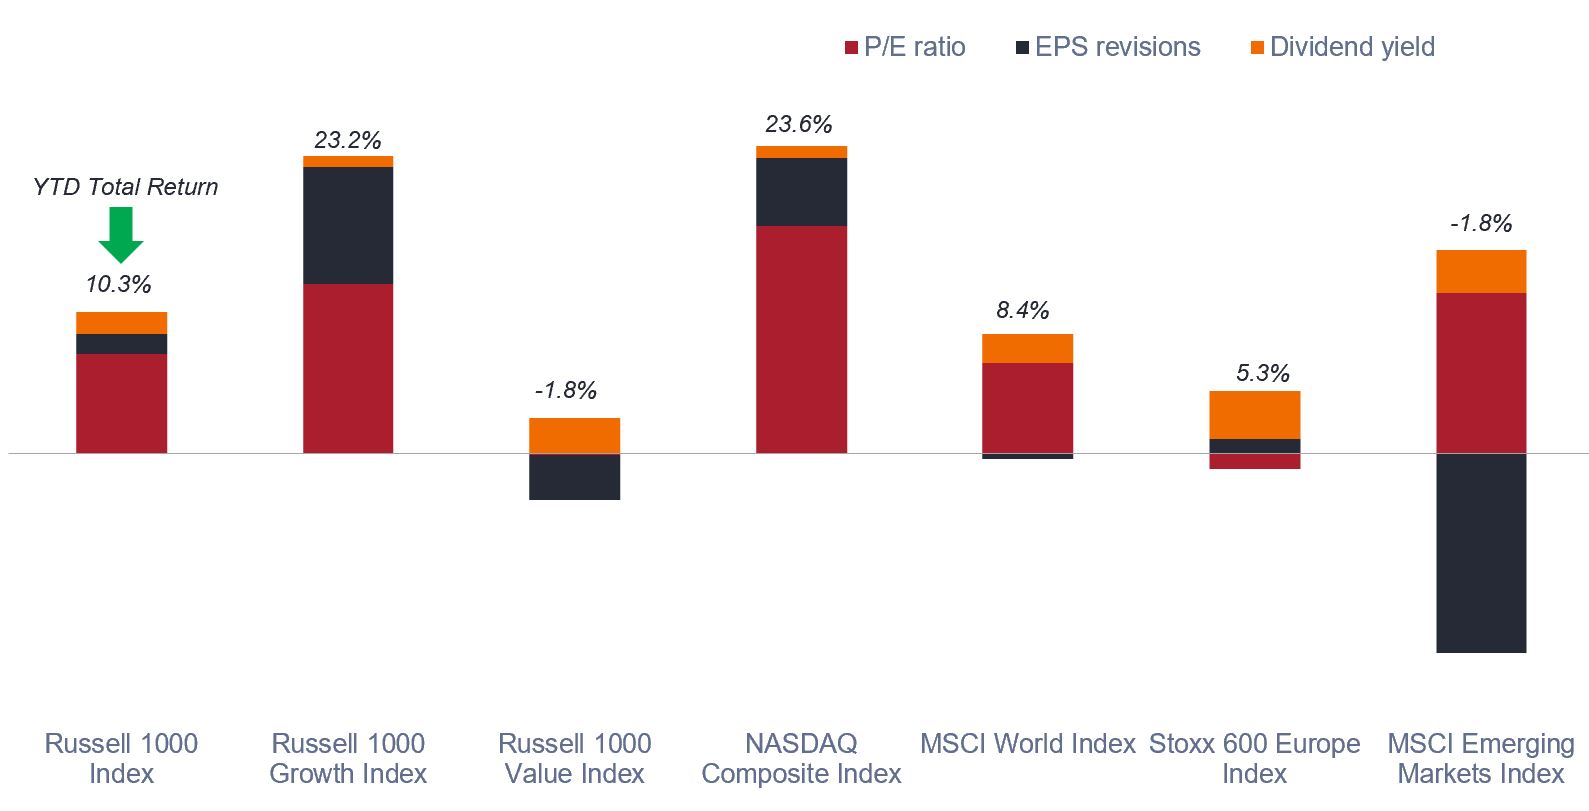
Source: Bloomberg, as of 31 October 2023. EPS denotes earnings per share. Russell Indices for large-cap U.S., U.S. growth, and U.S. value; MSCI for international and emerging markets; NASDAQ for higher growth U.S.; and Stoxx for pan European equities.
The merits of diversification
Lastly, a widening range of economic outcomes lends itself to increased market volatility. Uncertainty about the duration of elevated rates and rising geopolitical risks further clouds the situation.
When this type of volatility and uncertainty causes asset classes to move in tandem – as they have occasionally done of late – investors can lose sight of the need for diversification. After years of it not being the case, bonds once again have the potential to act as ballast to riskier assets in a broad portfolio. Yields have risen to levels that offer both attractive income potential and possibly lower levels of volatility if rates stay within their current range. And should a rapidly weakening economy force central banks to pivot – not our base case – bonds’ potential for capital appreciation could offset losses in more cyclically exposed asset classes.
Relative attractiveness of U.S. equities and Treasuries
While cross-asset diversification is always a wise tactic, higher interest rates means that bonds once again have the potential generate income and also capital generation in a risk-off scenario.
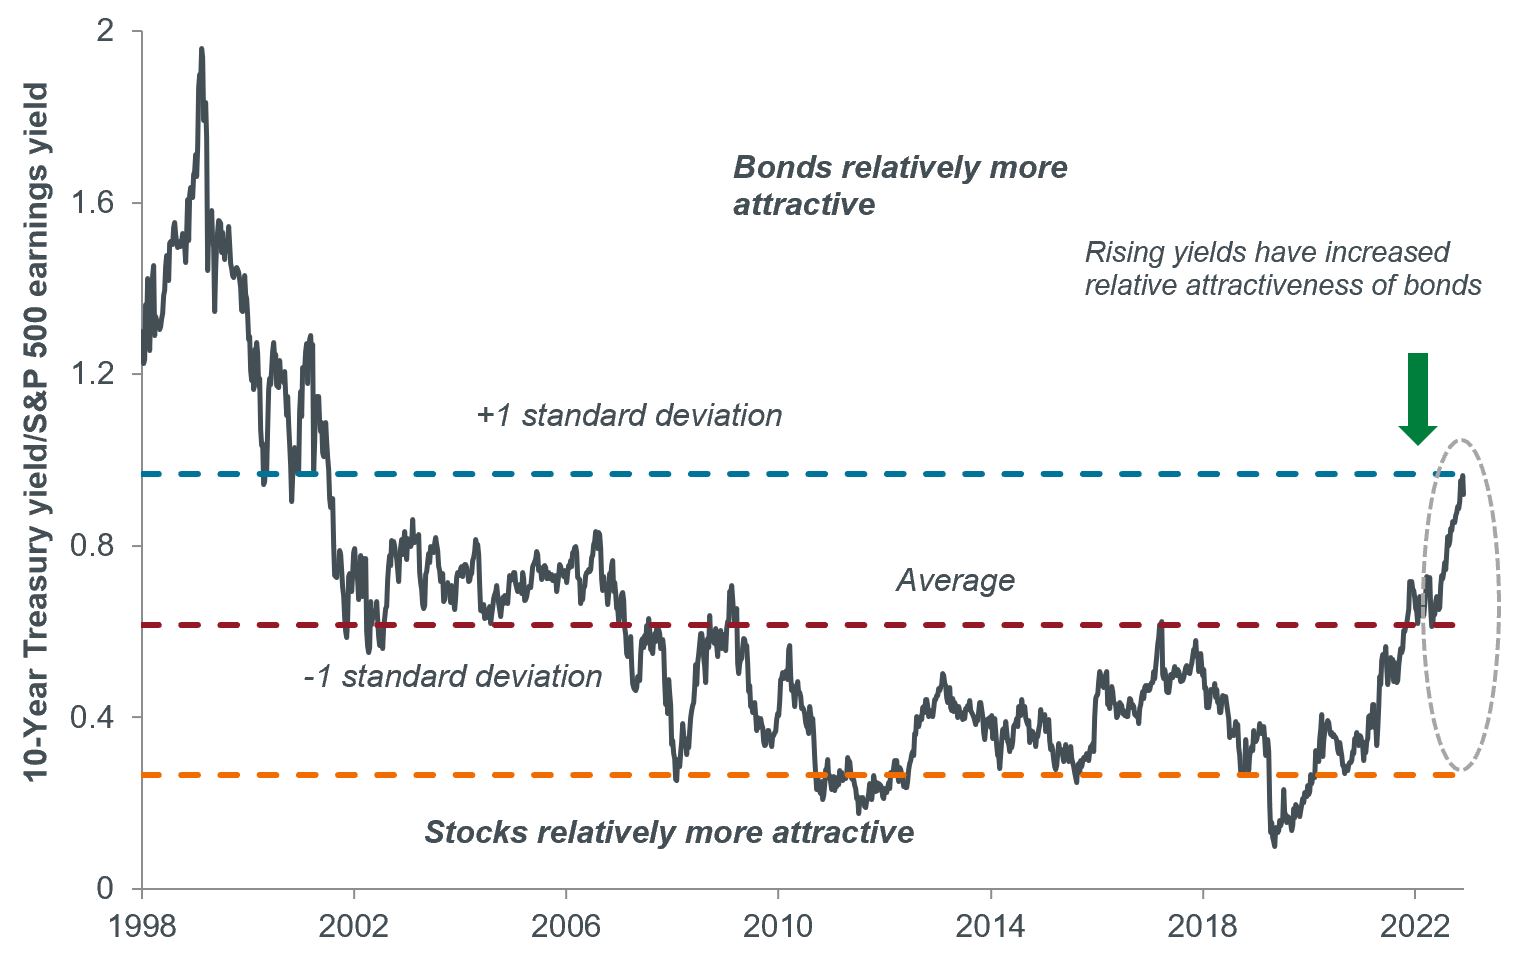
Source: Bloomberg, as of 31 October 2023. Past performance is no guarantee of future results.
IMPORTANT INFORMATION
Diversification neither assures a profit nor eliminates the risk of experiencing investment losses.
10-Year Treasury Yield is the interest rate on U.S. Treasury bonds that will mature 10 years from the date of purchase.
Basis point (bp) equals 1/100 of a percentage point. 1 bp = 0.01%, 100 bps = 1%.
Credit Spread is the difference in yield between securities with similar maturity but different credit quality. Widening spreads generally indicate deteriorating creditworthiness of corporate borrowers, and narrowing indicate improving.
The MSCI World Index captures large and mid-cap representation across 23 Developed Markets (DM) countries*. The index covers approximately 85% of the free float-adjusted market capitalization in each country.
The MSCI Emerging Markets Index captures large and mid cap representation across 24 Emerging Markets (EM) countries. The index covers approximately 85% of the free float-adjusted market capitalization in each country.
The Nasdaq Composite Index is a stock index that conveys the overall performance of all Nasdaq-listed stocks according to market capitalization.
Price-to-Earnings (P/E) Ratio measures share price compared to earnings per share for a stock or stocks in a portfolio.
Quantitative Tightening (QT) is a government monetary policy occasionally used to decrease the money supply by either selling government securities or letting them mature and removing them from its cash balances.
The Russell 1000® Index is a subset of the Russell 3000 Index that includes approximately 1,000 of the largest companies in the US equity universe.
The Russell 1000® Growth Index measures the performance of the large-cap growth segment of the US equity universe. It includes those Russell 1000 companies with relatively higher price-to-book ratios, and higher sales and earnings forecast over the medium term.
The Russell 1000® Value Index measures the performance of the large-cap value segment of the US equity universe. It includes those Russell 1000 companies with relatively lower price-to-book ratios and lower sales and earnings forecast over the medium term.
Standard Deviation measures historical volatility. Higher standard deviation implies greater volatility.
The STOXX 600 Europe Index captures the 600 largest publicly traded companies on a range of exchanges across the European region.
These are the views of the author at the time of publication and may differ from the views of other individuals/teams at Janus Henderson Investors. References made to individual securities do not constitute a recommendation to buy, sell or hold any security, investment strategy or market sector, and should not be assumed to be profitable. Janus Henderson Investors, its affiliated advisor, or its employees, may have a position in the securities mentioned.
Past performance does not predict future returns. The value of an investment and the income from it can fall as well as rise and you may not get back the amount originally invested.
The information in this article does not qualify as an investment recommendation.
Marketing Communication.
6 minute read
Key takeaways:
- The prospect of policy rates remaining elevated for the foreseeable future has diminished the hope that the U.S. economy could nail a soft landing.
- In the wake of higher borrowing costs, we doubt that U.S. consumers can maintain their pace of spending, which has been increasingly financed by debt.
- In anticipation of the global economy losing this powerful growth engine, we believe investors should prioritize quality companies capable of steady cash flows and possessing sound financials as we enter the later stages of the cycle.

