Emerging Markets Debt: a bright spot despite an uncertain macro picture
The Emerging Markets Debt Hard Currency Team, in its outlook for 2024, see tailwinds for the asset class, with yields offering a buffer against elevated global macro uncertainty.


7 minute read
Key takeaways:
- Emerging Market debt hard currency (EMDHC) represents a bright spot among risk assets, with an expected widening in the growth differential between emerging markets (EM) and developed markets in favour of EM, and the end of the US Federal Reserve (Fed) tightening cycle.
- Within EMDHC, high single-digit yields and reasonably resilient issuer fundamentals should provide a buffer against potential spread widening.
- We see particularly interesting carry opportunities in the high yield segment (e.g., single B and BB-rated countries), as well as with extending maturities in certain investment-grade countries where curves are steep.
Emerging market debt hard currency (EMDHC) assets proved resilient in 2023 in the face of tighter financial conditions, slowing global growth, and investor outflows. As represented by the JP Morgan Emerging Market Bond Index Global Diversified (EMBIGD), total returns for 2023 (year-to-date, as at 31 October 2023) stood at 0.39% in US dollar terms, dragged down by the rise in Treasury yields. Sovereign credit spreads have been very resilient – moving tighter year to date – resulting in positive excess returns over this period.1
For 2024, we see a number of positives for the asset class (discussed later on), not least attractive carry opportunities and potential tailwinds from the end of US Federal Reserve (Fed) tightening. That said, broader market sentiment is always an important driver of the direction of EMDHC assets and with this in mind, we believe ongoing global macro uncertainty may temper upside potential.
Indicative of the wide range of possible outcomes for the US economy, Goldman Sachs has year-on-year real gross domestic product (GDP) growth for 2024 at 2.1%, the International Monetary Fund (IMF) has year-on-year real GDP growth at 1.5%, while consensus forecasts for the US next year are for 1% growth.2 While developed economies have been more resilient than expected, leading indicators are not signalling an imminent upturn, and recession risks remain elevated in the US and Europe. That said, the major central banks now have ample ammunition to ease policy/cut rates. The end of Fed tightening cycles has typically been a more positive environment for EMDHC, particularly if the US dollar weakens alongside.
Improving EM-DM growth differentials. The recovery in growth alpha (i.e., the difference between Emerging Market and Developed Market (DM) economic growth) seen in 2023 is forecast to be sustained in 2024, making emerging and developing countries more attractive for global flows of capital. Figure 1 shows the widening disparity in year-on-year real GDP growth forecasts for emerging economies compared to those for advanced economies.
Figure 1: Divergent growth prospects: EM versus advanced economies
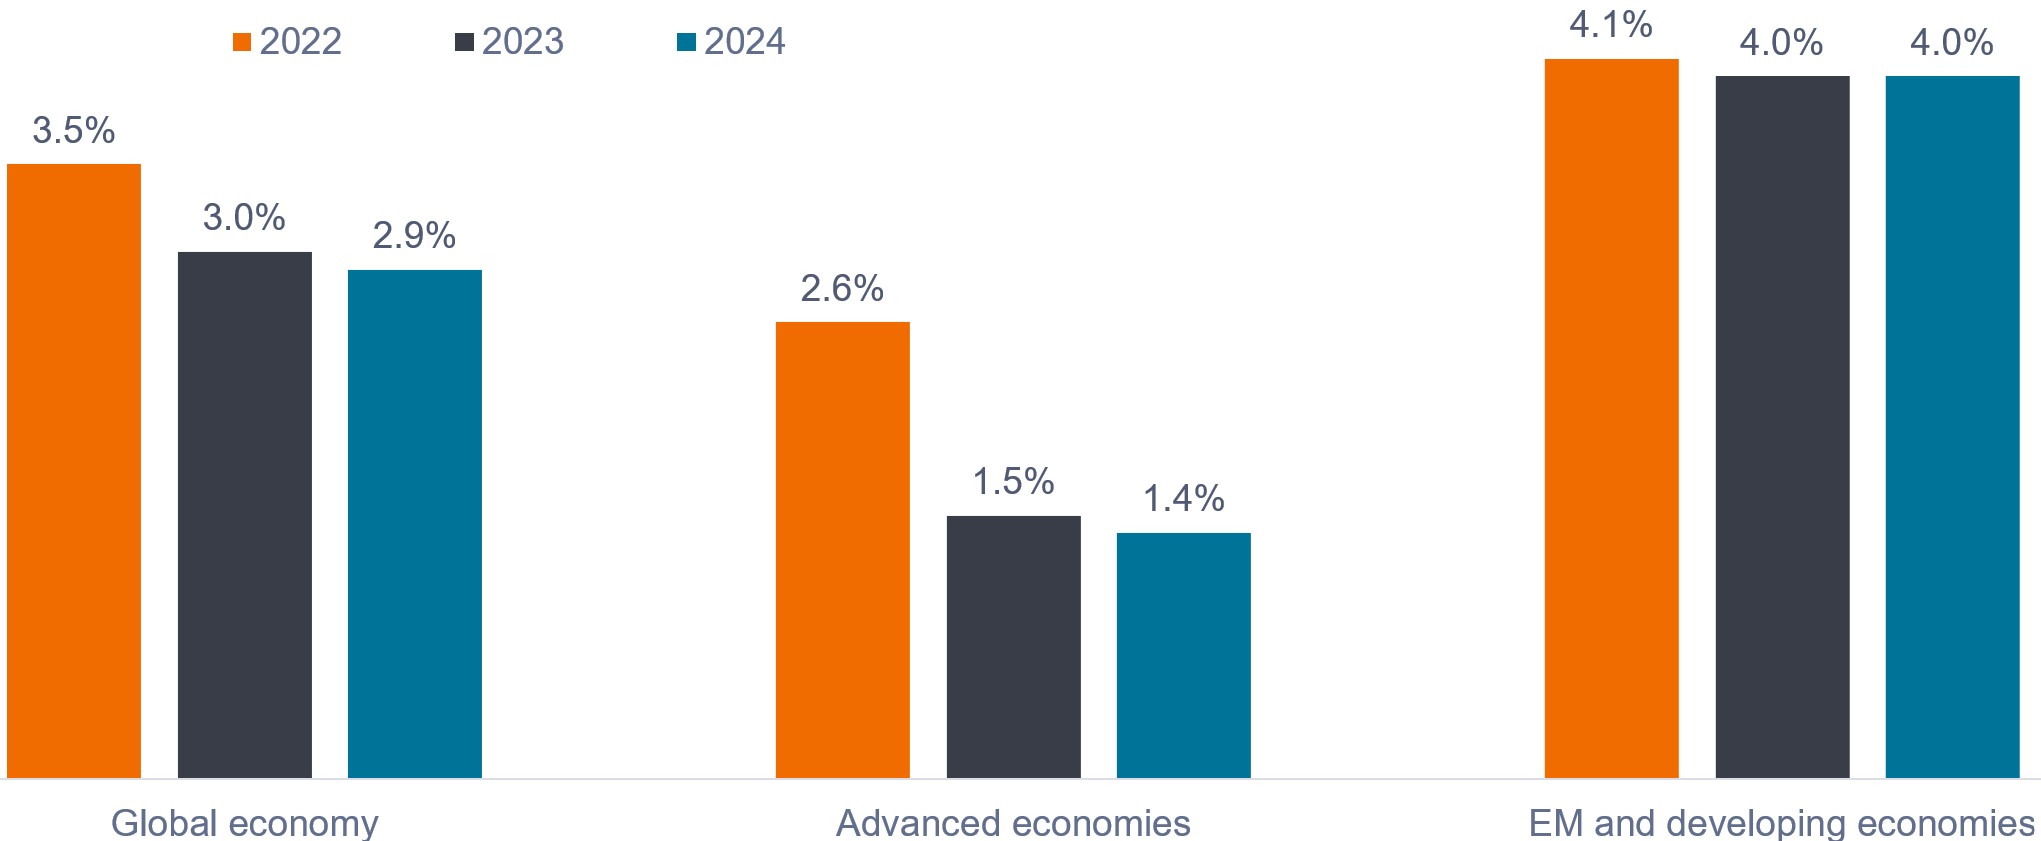
Source: IMF World Economic Outlook. Real GDP growth, percentage change. Data as of 10 October 2023. Note: There is no guarantee that past trends will continue, or forecasts will be realised.
Credit fundamentals are holding up. Developing countries have been making progress on recovering from the economic shocks of the past three years, despite social constraints. In our view, the impact of positive policy adjustments is often underestimated over the medium term and fundamentals currently are not as bad as some headlines suggest. Clearly, debt accumulation in China is still rising, but if you look at debt weighted by the widely used EMBIGD benchmark (China’s weighting is only around 4.7%), fundamentals at the aggregate EMBIGD level are holding up. See Figures 2 and 3.
Figure 2: EMBIGD-weighted government debt as a percentage of GDP
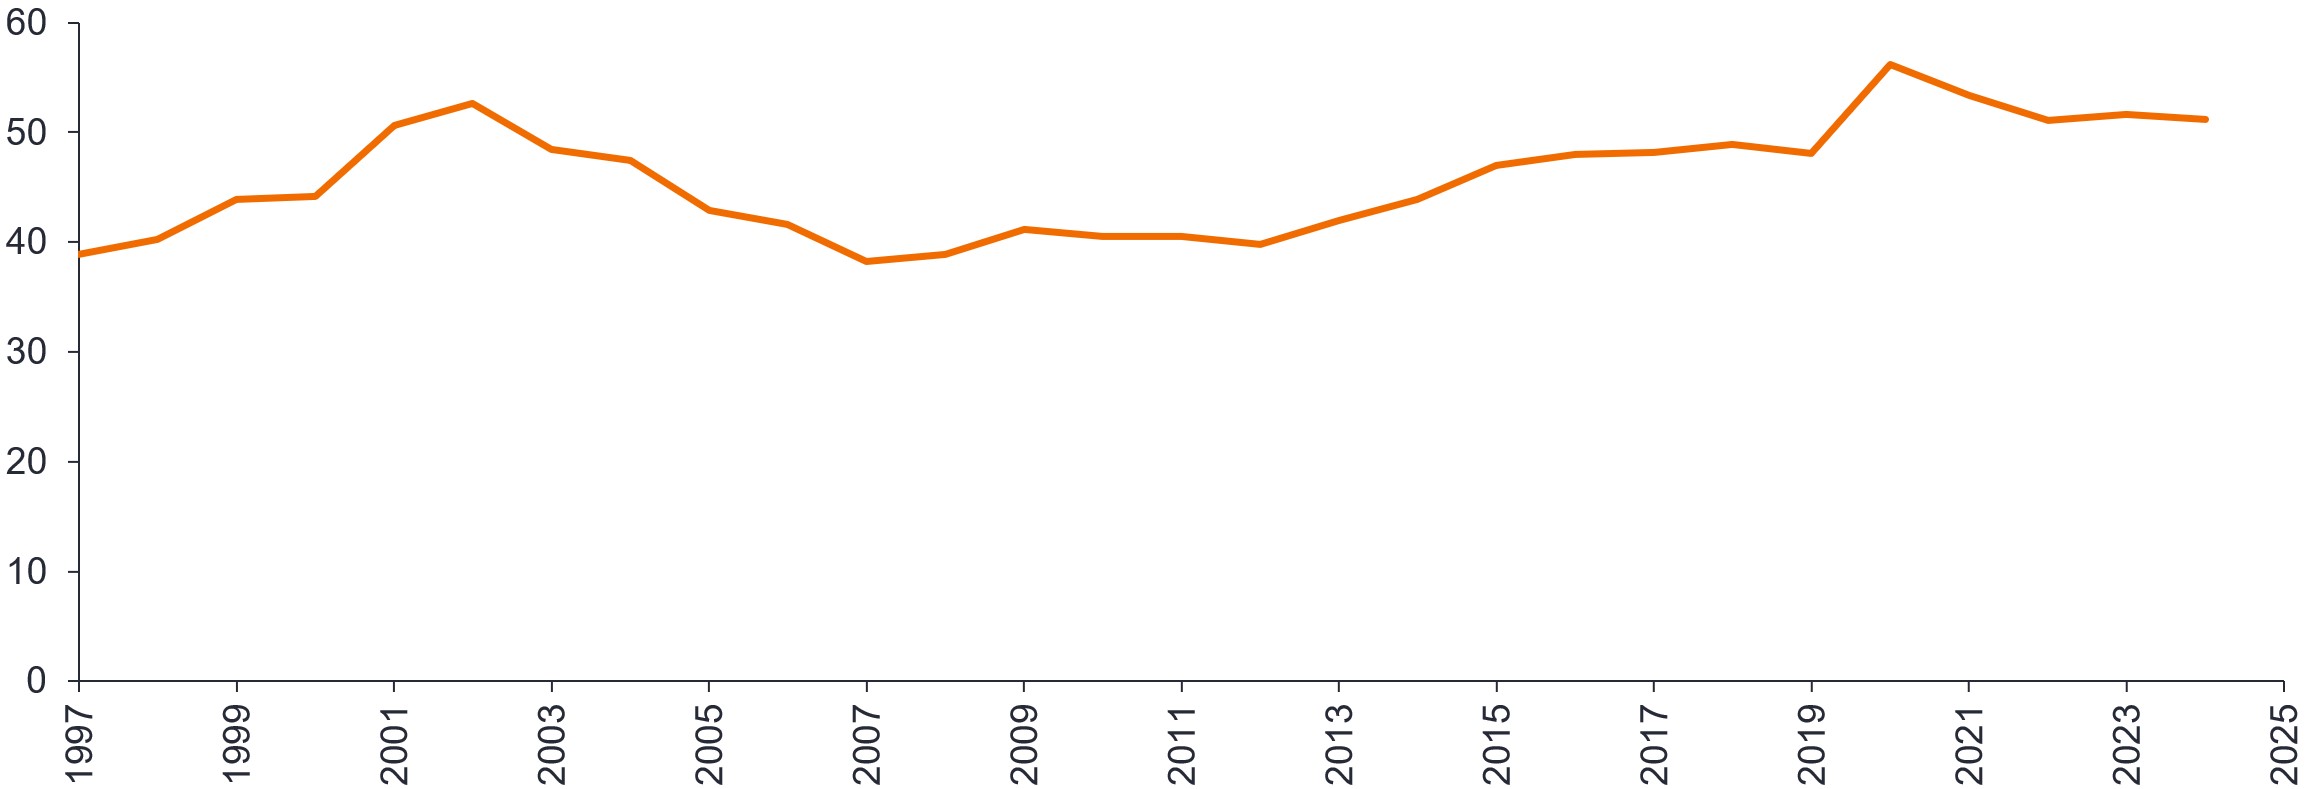
Source: Janus Henderson Investors, Moody’s, as at 30 June 2023. Note: There is no guarantee that past trends will continue, or forecasts will be realised.
Figure 3: EMBIGD-weighted fiscal balance as a percentage of GDP
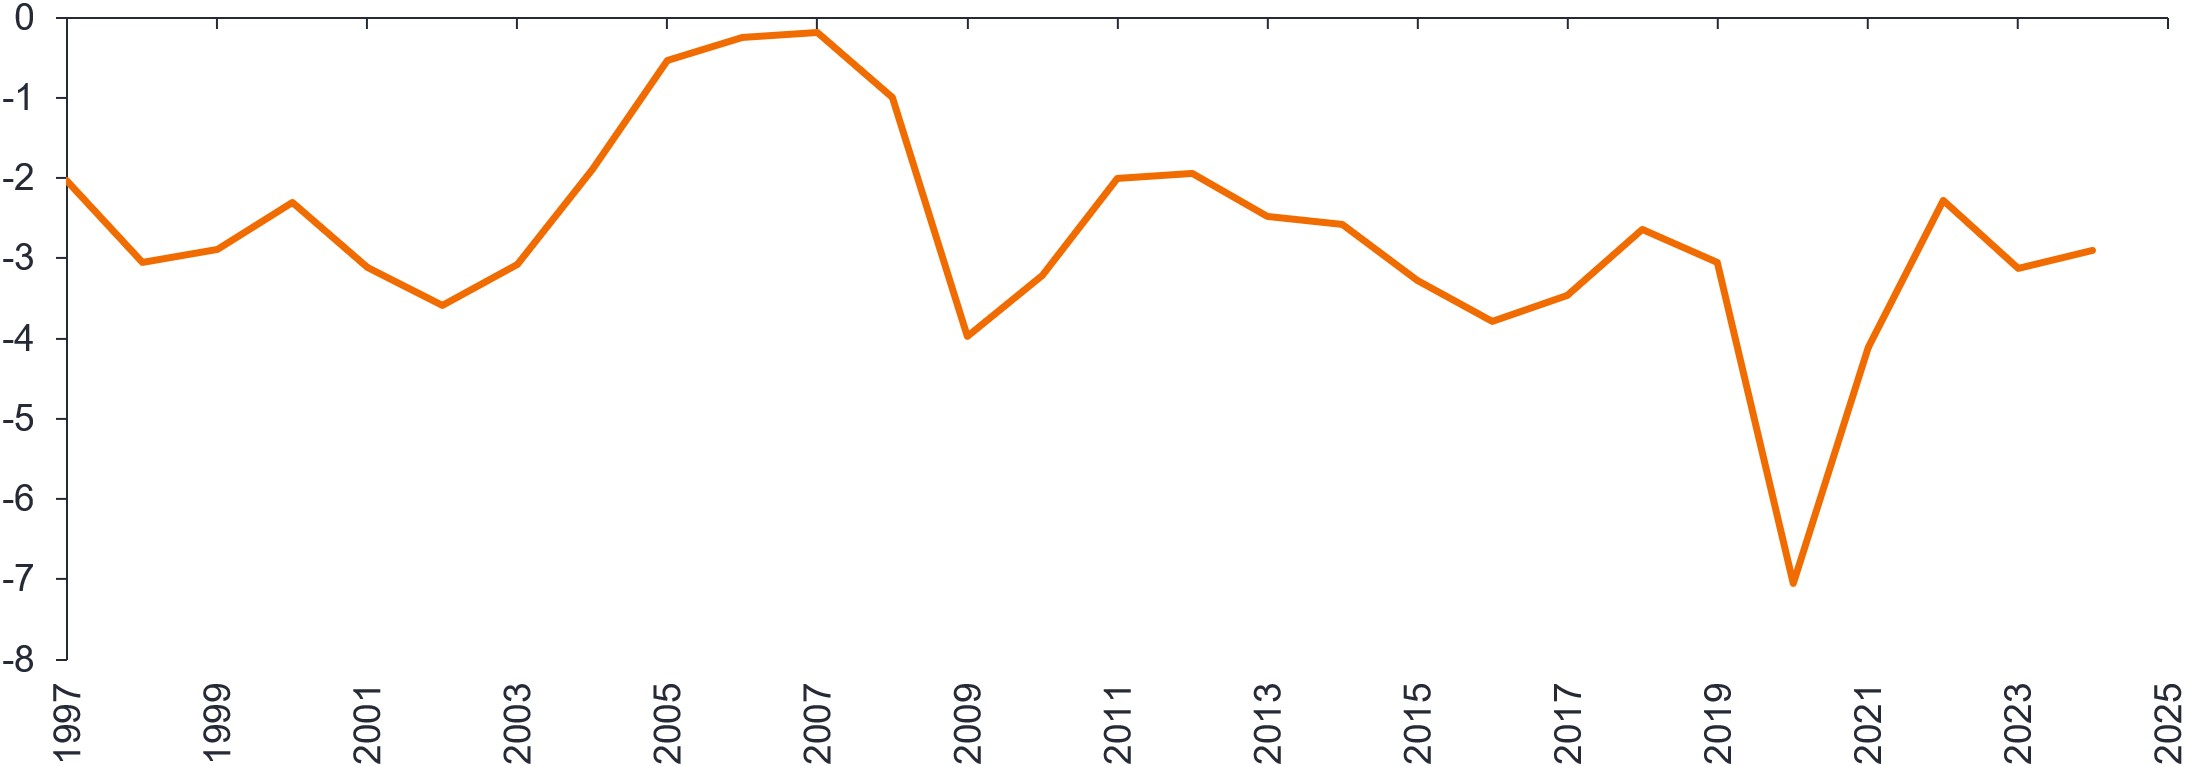
Source: Janus Henderson Investors, Moody’s, as at 30 June 2023. Note: There is no guarantee that past trends will continue, or forecasts will be realised.
Attractive yields and prospective returns. As can be seen in Figure 4, yields on the EMBIGD have risen significantly above their 20-year median level. Yields at this level are supportive for total returns and offer a meaningful buffer against potential spread widening.
Figure 4: EMBIGD yield-to-worst is elevated relative to the last 20 years
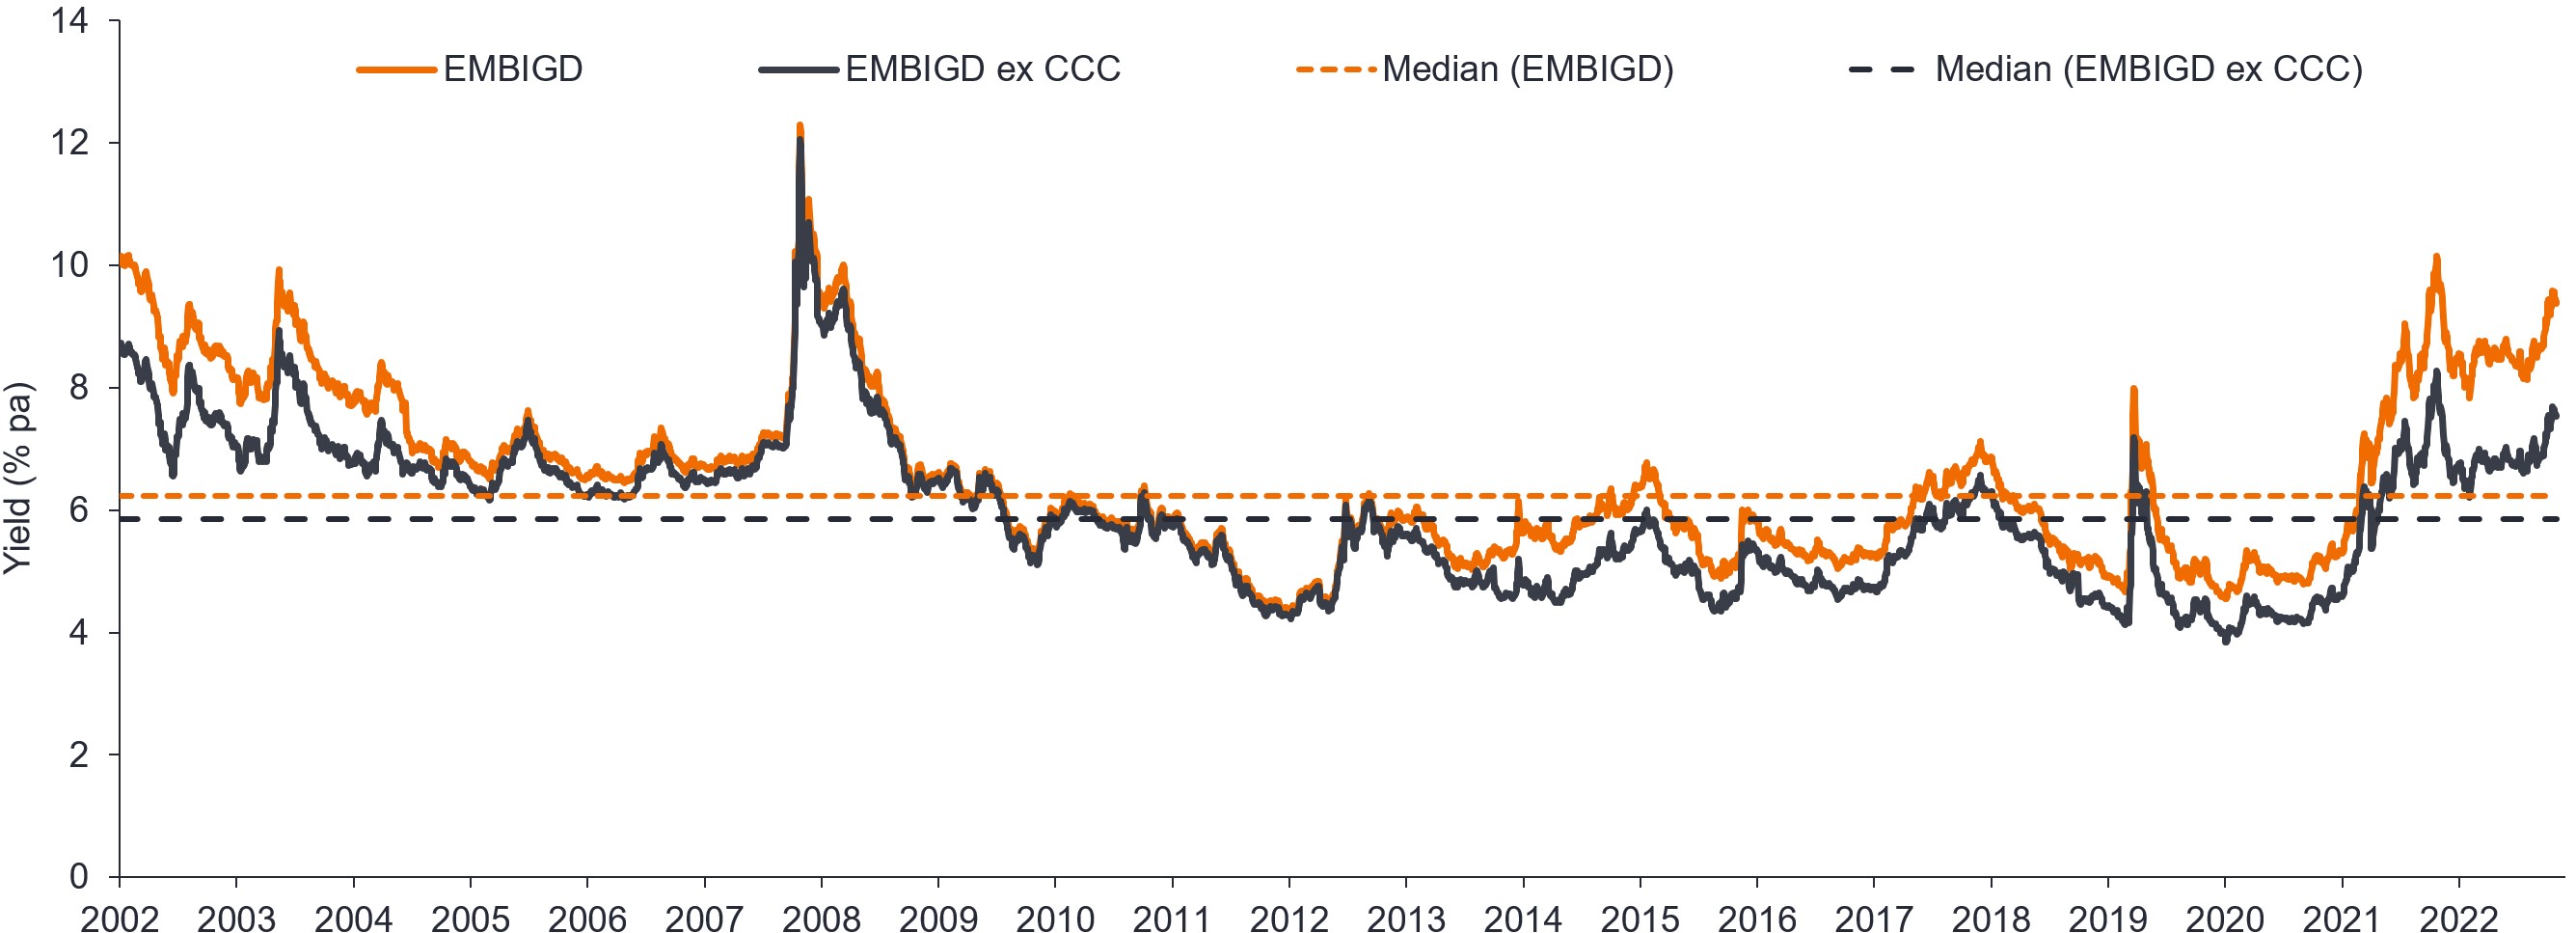
Source: Janus Henderson Investors and Macrobond, as at 31 October 2023. Note: The above are the teams’ views and should not be construed as advice and may not reflect other opinions in the organisation. The views are subject to change without notice. There is no guarantee that past trends will continue, or that forecasts will be realised. Yields may vary and are not guaranteed.
Putting this into perspective, the matrix in Figure 5 shows estimated prospective percentage returns over a one-year horizon, based on various EMBIGD spread levels and US 10-year Treasury yield levels. It shows that, based on spreads/yields as at 31 October 2023, investors could expect an annual return of 7.6% assuming the EMBIGD sovereign spread and US 10-year Treasury remain constant over the period. For the index to deliver a negative return (top-right), we would need to see both a significant widening in EMBIGD spreads and a substantial rise in Treasury yields. If you believe, as we do, that US Federal Reserve is now at terminal rates, then US Treasury yields could actually be a supportive tailwind for the asset class in 2024.
Figure 5: Attractive yields supportive of prospective total returns
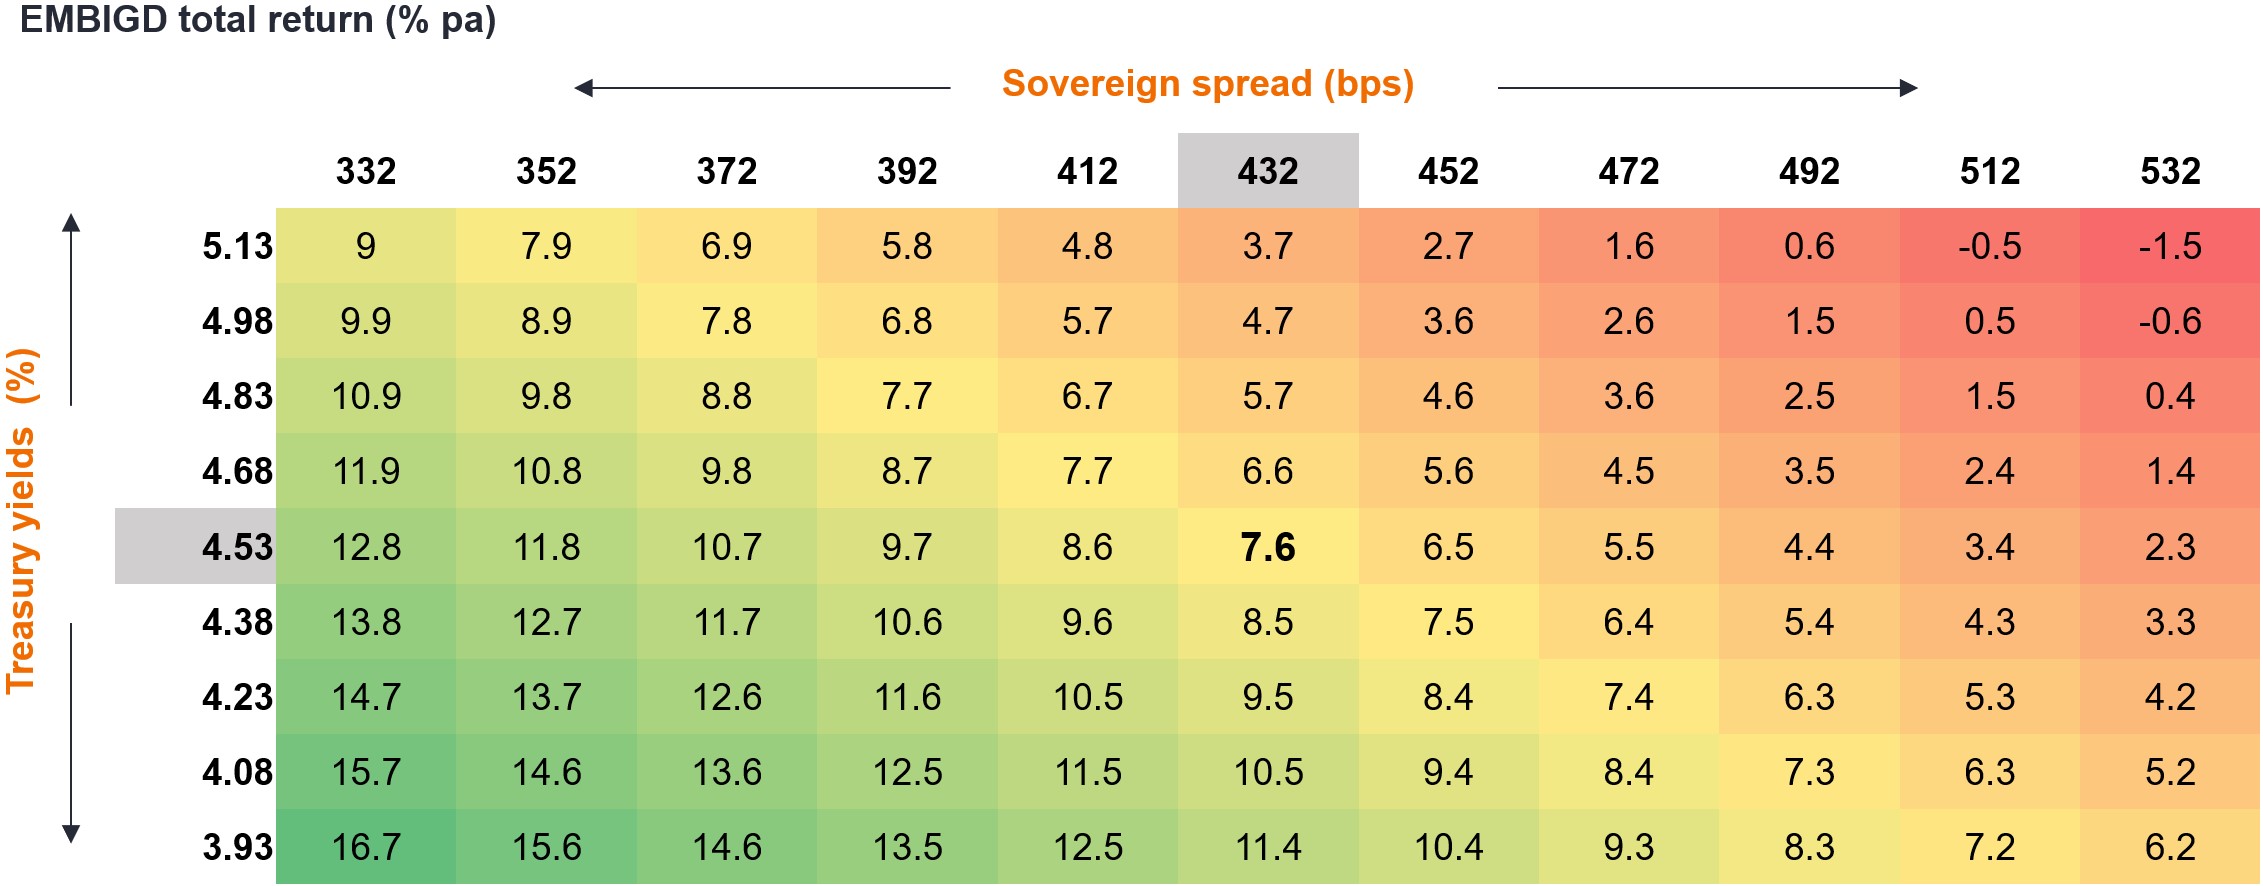
Source: Janus Henderson Investors. Data as at 31 October 2023. Treasury yields here refer to US 10-year Treasury yields. For illustrative purposes. Estimated returns based on annual carry calculation, adjusted for rates and spread changes. Past performance does not predict future returns. Yields may vary and are not guaranteed.
High yield segment offers more interesting opportunities
Overall, sovereign credit spreads are pricing in more of a soft landing – particularly, once headline EMBI spreads are adjusted for the distressed (CCC and lower) segment. Our universe continues to see elevated spread dispersion and desynchronisation across countries, creating opportunities for active investors. Given the bifurcation in spreads (Investment Grade versus High Yield), we see an opportunity to capture attractive carry by favouring the shorter end of the curve and paying more attention to BB and single-B rated countries, where valuations are more compelling.
Market technicals
Market technicals could well be better than many expect. Perhaps too much focus is put on the record outflows seen over the last two years. The flip side is this has left a cleaner starting point in terms of investor positioning, and higher all-in yields in fixed income should support demand from EM dedicated investors. A more bullish decline in yields next year may see market access returning for some high yield countries, which creates a positive feedback loop.
China growth slowing but will muddle through
Much has been written about China’s structural slowdown. More recently, we have seen better-than-expected Q3 GDP growth (4.9% year-on-year, albeit following a weak Q2 figure) and a modest policy stimulus package. For us, the stimulus is too small to revive “animal spirits” and does not represent a baseline change, but it does serve to signal that the government is more focused on the economy than the market may have previously thought, and it does reduce downside risk over the next 3-6 months. The property market slump has hurt confidence, while elevated youth unemployment and an unwillingness of households to spend savings remain consistent headwinds. We expect a muddle-through scenario, not a crisis.
Footnotes
1 The JP Morgan EMBI Global Diversified Index (EMBIGD) tracks liquid US dollar emerging market fixed and floating-rate debt instruments issued by sovereign and quasi-sovereign entities and is a widely followed benchmark. Source for EMBIGD return: JP Morgan. There is no guarantee that past trends will continue, or forecasts will be realised. Past performance does not predict future returns.
2 Sources: Goldman Sachs report titled Macro Outlook 2024: The Hard Part Is Over (forecasts as at 8 November 2023) and IMF World Economic Outlook dated 10 October 2023. According to the IMF report, the likelihood of a hard landing has receded, but the balance of risks to global growth remains tilted to the downside.
Definitions
Emerging market. The economy of a developing country that is transitioning to become more integrated with the global economy. This can include making progress in areas such as depth and access to bond and equity markets and development of modern financial and regulatory institutions.
Spread/credit spread. The difference in the yield between two bonds with the same maturity, but different credit quality. It is often used to describe to difference in yield between a corporate bond and an equivalent government bond.
IMPORTANT INFORMATION
Fixed income securities are subject to interest rate, inflation, credit and default risk. The bond market is volatile. As interest rates rise, bond prices usually fall, and vice versa. The return of principal is not guaranteed, and prices may decline if an issuer fails to make timely payments or its credit strength weakens.
High-yield or “junk” bonds involve a greater risk of default and price volatility and can experience sudden and sharp price swings.
The 10-Year Treasury Yield is the interest rate on U.S. Treasury bonds that will mature 10 years from the date of purchase.
Basis point (bp) equals 1/100 of a percentage point. 1 bp = 0.01%, 100 bps = 1%.
Credit Spread is the difference in yield between securities with similar maturity but different credit quality. Widening spreads generally indicate deteriorating creditworthiness of corporate borrowers and narrowing indicate improving.
Emerging Markets Debt Hard Currency Composite, benchmarked to the JP Morgan Emerging Markets Bond Index Global Diversified includes portfolios that seek to provide a total return in excess of the benchmark. Portfolios will typically invest at least 70% of its net assets in emerging market bonds and other fixed and floating rate securities denominated in hard currency. The portfolios may invest up to 10% in distressed debt securities, i.e., securities that are rated at CCC-/Caa3 or below, and up to 10% in non-rated debt. Portfolios may utilize derivative instruments for investment and hedging purposes. The composite was created in September 2022.
These are the views of the author at the time of publication and may differ from the views of other individuals/teams at Janus Henderson Investors. References made to individual securities do not constitute a recommendation to buy, sell or hold any security, investment strategy or market sector, and should not be assumed to be profitable. Janus Henderson Investors, its affiliated advisor, or its employees, may have a position in the securities mentioned.
Past performance does not predict future returns. The value of an investment and the income from it can fall as well as rise and you may not get back the amount originally invested.
The information in this article does not qualify as an investment recommendation.
Marketing Communication.
7 minute read
Key takeaways:
- Emerging Market debt hard currency (EMDHC) represents a bright spot among risk assets, with an expected widening in the growth differential between emerging markets (EM) and developed markets in favour of EM, and the end of the US Federal Reserve (Fed) tightening cycle.
- Within EMDHC, high single-digit yields and reasonably resilient issuer fundamentals should provide a buffer against potential spread widening.
- We see particularly interesting carry opportunities in the high yield segment (e.g., single B and BB-rated countries), as well as with extending maturities in certain investment-grade countries where curves are steep.

