Emerging markets debt: brighter prospects ahead as the storm passes
Amid continued global economic uncertainty, the outlook for emerging markets is looking relatively brighter. The Emerging Markets Debt Hard Currency (EMDHC) team outlines their thoughts on the investment outlook.


11 minute read
Key takeaways:
- We expect volatility and data dependency to remain elevated in this late-cycle environment. Inflation data is encouraging, but market pricing on US growth appears too optimistic.
- Overall credit quality in Emerging Markets has stabilised and we expect a slight improvement in credit quality overall in 2023/24.
- Distressed issuers are obscuring the value picture in the Emerging Markets Debt (EMD) hard currency asset class and dispersion could remain high in 2023, creating opportunities for active investors.
The Emerging Markets Debt Hard Currency (EMDHC) team considers four key factors when assessing the outlook. In the near-term, the uncertain global macro environment is the key factor that is driving the outlook and trajectory for the asset class in the remainder of 2023, but we expect to see more positive flow dynamics over the medium term on the back of a widening economic growth differential between emerging markets (EM) and developed markets (DM). Currently, there is also considerable spread dispersion within the EMDHC asset class, which represents an opportunity for active investors.1
The never-landing US and China’s cyclical recovery
Developed markets are expected to lead the global growth slowdown, while emerging markets remain relatively resilient. The International Monetary Fund (IMF) projects that growth across advanced economies will slow from 2.7% in 2022 to 1.5% in 2023 and 1.4% in 2024, with the US seeing growth slow from 2.1% in 2022 to 1.8% in 2023 and 1.0% in 2024. Conversely, EM and developing economies are expected to expand 4.0% in 2023 – in line with the 4% figure for 2022 – and rise to 4.1% in 2024.2 Within the EM space, developing Asia is a particularly bright spot, expected to post growth rates of 5.3% in 2023 and 5% in 2024, according to the IMF, but this is dependent on speed of the China recovery. It is also important to remember that the investible universe includes frontier countries with growth rates in the mid-to-high single digits.
In the US, leading indicators still point to a significant recession risk, though hard data has been more resilient, including the labour market. Moreover, significant progress has been seen on the inflation front, with CPI inflation falling to 3.0% for the 12 months to June 2023; the smallest
12-month increase since the period ending March 2021.3 Estimates suggest core inflation may average 2.5% annualised in the second half, and it is less likely that we will see further hawkish repricing with the growing disinflationary trend in place. This should be supportive for EM, paving the way for less policy-related uncertainty as both rates and the US dollar are past their peak.
In our view, market pricing is too optimistic on US growth scenarios and the adjustment to a recession will dampen risk appetite as the Federal Reserve (Fed) is unlikely to step in as quickly to pivot monetary policy as in recent slowdowns. We believe the late-cycle environment will likely keep volatility elevated and data dependency high. However, as inflation comes down, Fed policy ammunition grows and consequently the risk of a harder landing declines. Hence, the negative scenario of a hard landing is time sensitive.
In China, sequential growth has likely already peaked. To date, the recovery is mainly service-driven and state-led and the global slowdown is dampening exports. A broadening out of the recovery depends on Chinese consumers turning less pessimistic. However, the property market slump has hurt confidence, while elevated youth unemployment and an unwillingness among households to spend their savings remain headwinds. We expect the Chinese authorities to remain path-dependent to ensure growth targets are met. This implies the use of more targeted fiscal policies (eg. property). On that basis, we conclude that the positive spill-over effects of China’s recovery on other EM countries will be more muted than in the past.
Figure 1 shows on a regional basis the degree to which economic data and inflation has surprised relative to market expectations since the start of 2023. In China, we have seen disappointment on growth but inflation that has been lower than expected (CPI is now following PPI into deflationary territory). Growth in Latin America has been very resilient, significantly beating expectations so far this year. To us, this suggests we should not get too bearish on China going forward as negative surprises are already at historical highs.
Figure 1: Economic / inflation surprise indices by region
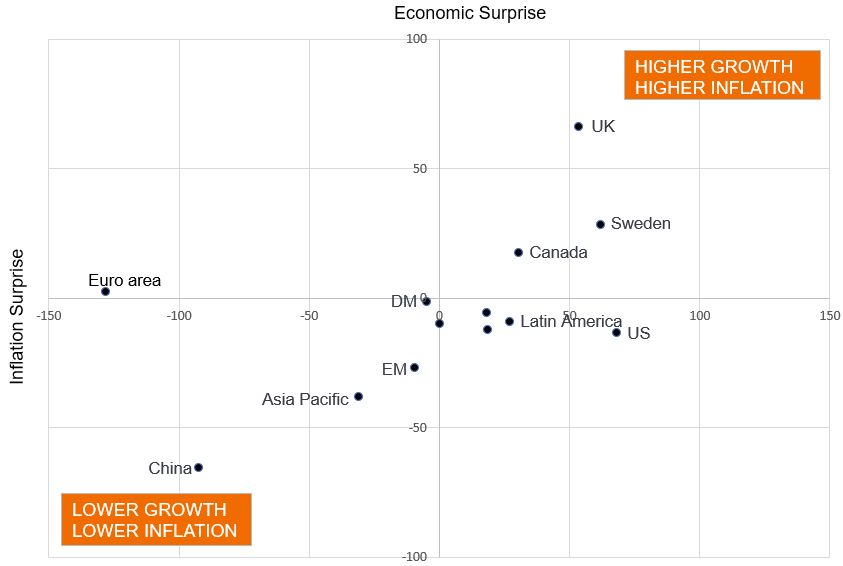
Source: Janus Henderson Investors and Macrobond, year to date to 30 June 2023. Note: The above are the teams’ views and should not be construed as advice and may not reflect other opinions in the organisation. The views are subject to change without notice. There is no guarantee that past trends will continue, or forecasts will be realised. There is no guarantee that past trends will continue, or forecasts will be realised. The views are subject to change without notice. Past performance does not predict future returns.
Our base case is that the divergence in economic growth between EM and DM is shifting significantly higher. This is illustrated in Figure 2, which shows the widening disparity in forecasted global growth dynamics. An improving EM-DM differential has historically signalled stronger relative performance.
Figure 2: The EM-DM economic growth differential is finally shifting
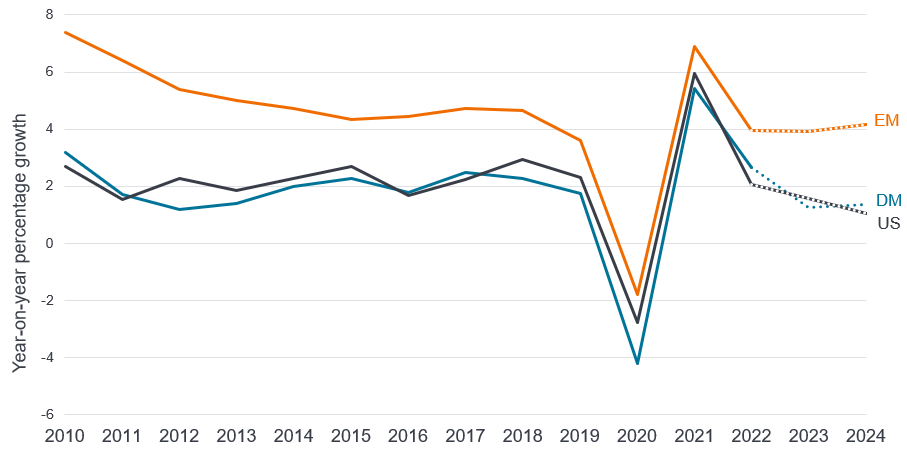
Source: Janus Henderson Investors, IMF and Macrobond, as at 7 April 2023. Note: The views and forecasts are subject to change without notice. There is no guarantee that past trends will continue, or forecasts will be realised. There is no guarantee that past trends will continue, or forecasts will be realised. Past performance does not predict future returns.
The EM fundamental outlook is holding up
Despite the headlines, many emerging markets remain relatively robust, with progress on fiscal consolidation and improving debt metrics. Relatively strong real GDP growth overall for countries in the benchmark JP Morgan Emerging Market Bond Index Global Diversified (EMBIGD) universe is highlighted in Figure 3.4 Also positive for EM countries, they have ample scope for monetary policy easing due to the higher starting point for real rates and improving inflation dynamics. EM inflation is falling, as evidenced by global supply chain normalisation and weakening PPI – most notably in China. EM central banks were early into the rate hiking cycle relative to the rest of the world – inflation is now falling and a number of these central banks are now closer to start cutting rates (eg. Brazil, Mexico), providing a buffer – although this is not universal. The policy response in EM to rising inflation, in our view, solidifies EM policy credibility.
Figure 3: Fundamental outlook is holding up
EMBIGD weighted real growth
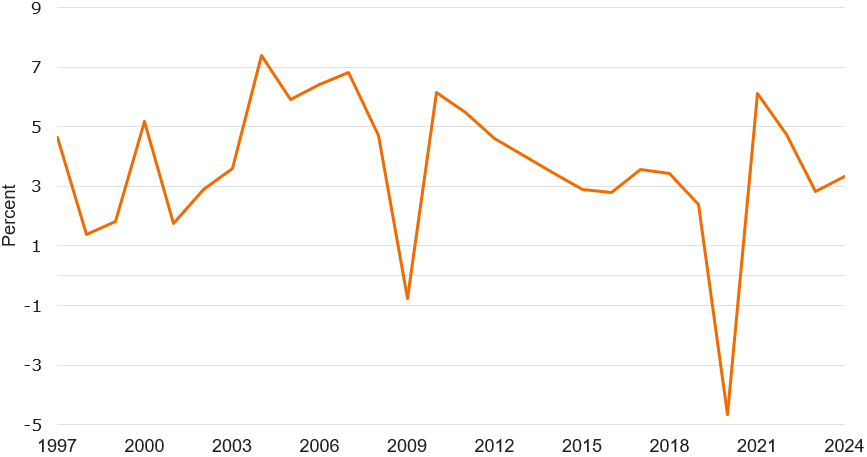
Source: Janus Henderson Investors, Macrobond, as at 31 March 2023. Note: There is no guarantee that past trends will continue, or that forecasts will be realised.
Credit quality in EM, overall, has stabilised, but a slowing global economy does weigh on EM as many are dependent on international trade and overall credit quality is under some modest downward pressure. The slowdown is putting pressure on fundamental credit metrics; in some sense the resilience seen in the first half of 2023 is front-loading, meaning the second half of the year could disappoint.
Within our overall ratings outlook, there are key differences between higher-rated and lower-rated countries. Weaker countries face various headwinds – slowing growth, elevated funding costs and lack of market access – and this is reflected in our average ratings outlook by credit segment.
Several distressed countries are going through restructurings or are trying to avoid defaults by making policy adjustments, often supported by the IMF. As time is critical in restructurings, slow progress (or lack of it) has weighed on market pricing for the most of the first half. Recently, a flurry of constructive news has lifted sentiment, including a debt restructuring agreement between official creditors and Zambia; approval of an IMF-program for Pakistan; and progress on local debt restructurings in Ghana and Sri Lanka. While there is still a long road ahead before these countries can regain market access, recent progress bodes well for future restructuring processes. The risk of broader contagion from distressed countries to the broader emerging markets asset class is, in our view, limited.
‘Core’ EMD spreads now fairly valued
Current credit spread valuations are perhaps the most difficult area to unpick due to the continued bifurcation of the market. It is mainly lower rated single B and CCC-rated issuers that offer wider spreads, both relative to long-term history and when comparing emerging market US dollar sovereign debt to US corporate credit. Those in the investment grade portion are below their historical averages.
Another way to look at it is shown in Figure 4, which suggests that current market spreads are not far from fair value. Of course, the universe of 70 countries is broader than that the 12 ‘core’ countries included here, but it is a reasonable barometer at the top level. It is important to bear in mind that this assessment (and EM spreads themselves) are a function of risk aversion/volatility, which has fallen significantly year-to-date. Given the uncertain macro environment in developed markets, it is hard to discount that we will not see higher levels of risk aversion in the second half (our current risk aversion indicator, which is an input to the valuation model, is now below median levels). That leaves us a little more cautious in our credit risk positioning compared to earlier in the year, but not underweight.
Figure 4: Spread model shows EM core (12 countries) fairly valued
EM core (12) fair value spread model
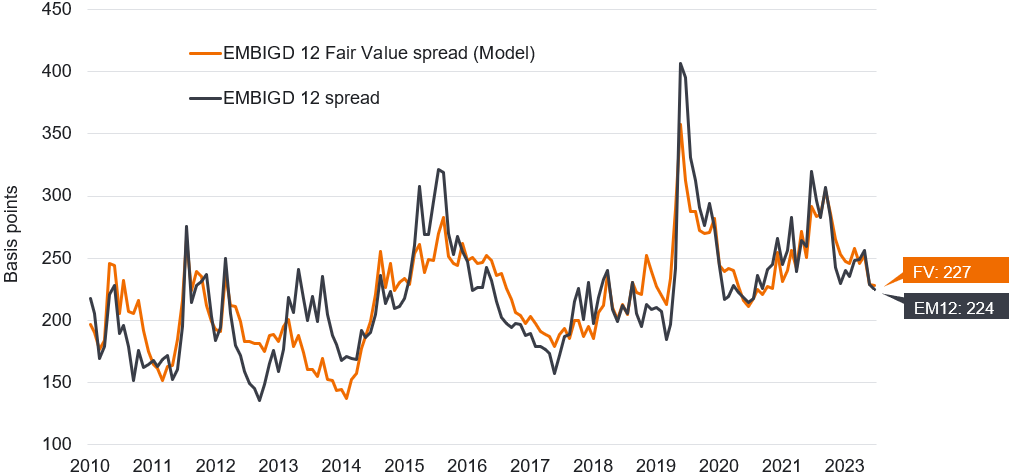
Source: Macrobond, Janus Henderson Investors as at 30 June 2023. Basis points (bps) is a standard measure in finance. One basis point equals 0.01%; 227bps here would indicate a spread of 2.27%. Note: Janus Henderson’s fair value spread model seeks to determine an appropriate spread level for a bond or group of bonds based on independent analysis of various risk factors relating to that bond or group of bonds. Divergences between actual spreads and estimated fair value spreads can help highlight buy/sell opportunities.
However, as is the case with other fixed income asset classes, the repricing of treasury yields over the last 12 months has dramatically improved the prospective returns for investors in the asset class. Whether you look at the whole universe or exclude CCCs, the current index yields are in the top quartile, looking at the last 20 years.5
We also note that the bifurcation of the market can create opportunities within the asset class. Within the EMDHC universe, as represented by the JP Morgan Emerging Market Bond Index Global Diversified (EMBIGD), standard deviations have risen to an all-time high (Figure 5). This dispersion indicates that the asset class has matured: its constituents are no longer behaving as uniformly as in the past, the number of countries in the universe has broadened out and there are more idiosyncratic stories that an active, bottom-up, analytical investment approach can exploit.
Figure 5: Spread dispersion can present investment opportunities
Standard deviation of spreads in EMBIGD universe
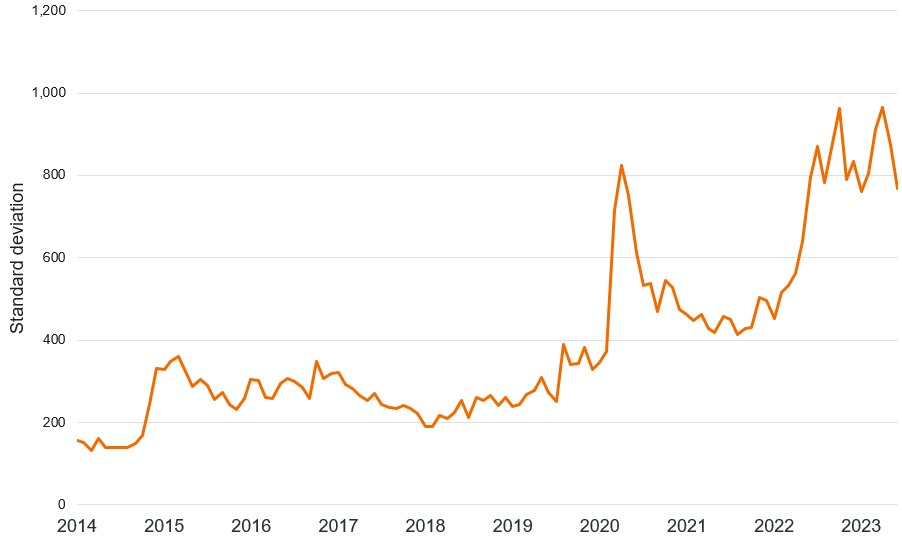
Source: Macrobond, Janus Henderson Investors as at 30 June 2023. EMBIGD is JP Morgan Emerging Market Bond Index Global Diversified. Past performance does not predict future returns.
Our focus is on the medium-term trend of sovereign credit risk (as reflected in ratings), which in tandem with current valuations leaves us favouring the high yield portion of the universe, including Uzbekistan, Gabon, Mozambique and Benin, whilst having less exposure to some of the larger issuers in Latin America and Asia.
Footnotes
1 In statistics, the word dispersion is used as a measure of how spread out the underlying data is. In this instance, we are referring to dispersion in credit spreads.
2 Source: IMF World Economic Outlook as at 25 July 2023.
3 Source: U.S. Bureau of Labor Statistics, as at 12 July 2023. Figures are before seasonal adjustment.
4 The JP Morgan Emerging Market Bond Index Global Diversified (EMBIGD) is a uniquely weighted USD-denominated emerging markets sovereign index. According to JP Morgan, the EMBIGD is the most widely followed USD EM sovereign index.
5 CCCs refer to bonds rated CCC by a credit rating agency. Credit ratings refer to the assessment by a credit rating agency as to the creditworthiness of the entity issuing the bond – in other words, the ability of the issuing entity to meet its financial obligations, including its bond payments. Bonds rated CCC are considered speculative, or non-investment grade.
Carry: The excess income earned from holding a higher yielding security relative to another. Consumer Price Index (CPI): A measure that examines the price change of a basket of consumer goods and services over time. It is used to estimate ‘inflation’. Headline CPI or inflation is a calculation of total inflation in an economy, and includes items such as food and energy, in which prices tend to be more prone to change (volatile). Core CPI or inflation is a measure of long-run inflation and excludes transitory/volatile items such as food and energy. Correlation: How far the price movements of two variables (eg, equity or fund returns) match each other in their direction. If variables have a correlation of +1, then they move in the same direction. If they have a correlation of -1, they move in opposite directions. A figure near zero suggests a weak or non-existent relationship between the two variables. Credit rating: A score usually given by a credit rating agency such as Standard & Poors, Moody’s and Fitch on their creditworthiness of a borrower. Standardised scores such as ‘AAA’ (a high credit rating) or ‘B’ (a low credit rating) are used however can vary depending on the credit rating agency. Moody’s, another well-known credit rating agency, uses a slightly different format with Aaa (a high credit rating) and B3 (a low credit rating). Credit risk: The risk that a borrower will default on its contractual obligations to investors, by failing to make the required debt payments. Credit spread: The difference in the yield of corporate bonds over equivalent government bonds. Debt issuance is an approach used by both the government and public companies to raise funds by selling bonds to external investors. Dispersion: This refers to the range of possible returns on an investment. It can also be used to measure the risk inherent in a particular security or investment portfolio. Distressed debt: A security issued by a company that is either in default or in high risk of default and involves significant investment risk. Diversification: A way of spreading risk by mixing different types of assets/asset classes in a portfolio. It is based on the assumption that the prices of the different assets will behave differently in a given scenario. Assets with low correlation should provide the most diversification. neither assures a profit nor eliminates the risk of experiencing investment losses. Fiscal/Fiscal policy: Connected with government taxes, debts and spending. Government policy relating to setting tax rates and spending levels. It is separate from monetary policy, which is typically set by a central bank. Fiscal austerity (fiscal consolidation) refers to raising taxes (revenues) and/or cutting spending in an attempt to reduce the level of government debt. Fiscal expansion (or ‘stimulus’) refers to an increase in government spending and/or a reduction in taxes. Fundamental analysis: The analysis of information that contributes to the valuation of a security, such as a company’s earnings or the evaluation of its management team, as well as wider economic factors. This contrasts with technical analysis, which is centred on idiosyncrasies within financial markets, such as detecting seasonal patterns. Gross Domestic Product (GDP): The value of all finished goods and services produced by a country, within a specific time period (usually quarterly or annually). It is usually expressed as a percentage comparison to a previous time period, and is a broad measure of a country’s overall economic activity. Hard currency: A hard currency is a currency that is liquid (easily tradable) in foreign exchange markets and is expected to be relatively stable over the short term. Examples of hard currency are the US dollar, the euro and the Japanese yen. Hawkish: Restrictive monetary policy that favours higher interest rates in order to curb inflation. High yield bond: A bond which has a lower credit rating below an investment grade bond. It is sometimes known as a sub-investment grade bond. These bonds usually carry a higher risk of the issuer defaulting on their payments, so they are typically issued with a higher coupon to compensate for the additional risk. Monetary policy: The policies of a central bank, aimed at influencing the level of inflation and growth in an economy. It includes controlling interest rates and the supply of money. Monetary stimulus (or easing) refers to a central bank increasing the supply of money and lowering borrowing costs. Monetary tightening refers to central bank activity aimed at curbing inflation and slowing down growth in the economy by raising interest rates and reducing the supply of money. Near-shoring: The transfer of business processes to companies in a nearby country, where both parties expect to benefit from this. Producer Price Index (PPI): The Producer Price Index refers to the average change in selling price over time that domestic producers receive for their output. It is an industry measure of inflation – from the perspective of the producer – and is sometimes seen as an earlier predictor of inflation than the Consumer Price Index (CPI). Real interest rate: Expressed in percentage terms, the real interest rate, or real rate, is the level of interest the lender receives (borrower pays) adjusted for inflation. Also defined as the nominal, or stated, interest rate less the rate of expected inflation. Real GDP: Real GDP is a macroeconomic statistic that measures the value of the goods and services produced by an economy in a specific period, adjusted for inflation. Risk assets: Financial securities that can have significant price movements (hence carry a greater degree of risk). Examples include equities, commodities, property and bonds. Sequential growth: This refers to growth relative to an immediately prior period. Yield: The level of income on a security, typically expressed as a percentage rate. For equities, a common measure is the dividend yield, which divides recent dividend payments for each share by the share price. For a bond, this is calculated as the coupon payment divided by the current bond price.
IMPORTANT INFORMATION
Emerging market investments have historically been subject to significant gains and/or losses. As such, returns may be subject to volatility.
High-yield or “junk bonds” involve a greater risk of default and price volatility and can experience sudden and sharp price swings.
The JP Morgan Emerging Market Bond Index Global Diversified (EMBIGD) is a uniquely weighted USD-denominated emerging markets sovereign index. It tracks liquid, US dollar emerging market fixed and floating- rate debt instruments issued by sovereign and quasi sovereign entities.
These are the views of the author at the time of publication and may differ from the views of other individuals/teams at Janus Henderson Investors. References made to individual securities do not constitute a recommendation to buy, sell or hold any security, investment strategy or market sector, and should not be assumed to be profitable. Janus Henderson Investors, its affiliated advisor, or its employees, may have a position in the securities mentioned.
Past performance does not predict future returns. The value of an investment and the income from it can fall as well as rise and you may not get back the amount originally invested.
The information in this article does not qualify as an investment recommendation.
Marketing Communication.
11 minute read
Key takeaways:
- We expect volatility and data dependency to remain elevated in this late-cycle environment. Inflation data is encouraging, but market pricing on US growth appears too optimistic.
- Overall credit quality in Emerging Markets has stabilised and we expect a slight improvement in credit quality overall in 2023/24.
- Distressed issuers are obscuring the value picture in the Emerging Markets Debt (EMD) hard currency asset class and dispersion could remain high in 2023, creating opportunities for active investors.


