
Key takeaways:
- Bond bear steepenings are rare. Since 1960, there have been only 15 occurrences of bear steepenings prior to the current one – and only four occurrences when the yield curve has been inverted.
- The current bear steepening is the biggest that has occurred when yield curves have been inverted.
- While the past is not always a guide to the future, previous occurrences of bear steepening when yield curves have been inverted have typically signalled a fall from peak yields and have coincided with the onset of a recession.
We are three years into a bond bear market driven by a severe inflation shock and a ratcheting up of short rates. Just as we approach terminal rates in many countries and core inflation begins to surprise to the downside, we get hit with a rare bear steepener. Is this the beginning of a whole new bond bear market or the death throes of the existing one?
In the financial world, a bond bear steepening of the magnitude we have seen in recent weeks is rare. In fact, we will demonstrate that it has occurred only 15 times (before the current episode) in the last 60 years. And when yield curves have been inverted – as they are now – it has typically led to a fall from peak yields and coincided with the onset of a recession.
What is a bond bear steepener?
This term is used to define a situation in which yields on longer term bonds rise more than the rise in yield on shorter dated bonds. It is called a steepener because the yield curve that plots yields of bonds of the same quality but different time to maturity is normally upward sloping from bottom-left to top-right. So, if yields on longer dated bonds rise faster than on shorter dated bonds, this would cause the yield curve to steepen.
Figure 1: Bear steepener illustration
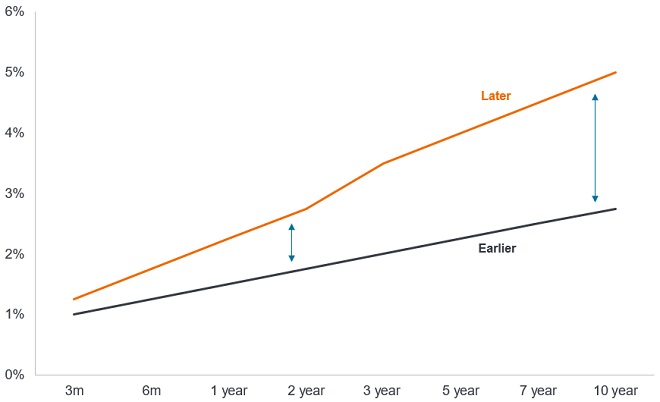
Source: Janus Henderson Investors. For illustrative purposes only.
One of the most widely followed measures is the difference between the yield on the 10-year US government bond and the yield on the 2-year US government bond. This difference is known as the 2s10s. Normally, the difference is positive (10-year bonds typically yield more than 2-year bonds) but when it turns negative, the yield curve is described as inverted.
A rare occurrence
Bloomberg bond curve data only goes back to 1976, so we used a dataset from Macrobond (sourced from the Federal Reserve Bank of New York) to show a longer history of bear steepening moves back to 1960. This additional historical data uses the 1-year and 3-year bonds which existed pre-1976 and interpolates a 2-year yield (pre-1976 there was no 2-year yield).
Below is a table (in chronological order) of all the bear steepening examples looking at the data back to 1960. The methodology we used to identify instances of bear steepening was that the 2s10s steepening needed to be greater than 10 basis points (bp) and last for a minimum of a week. The move in the 2-year yield is anything greater than 0 bp. This is not an onerous definition, but it only finds 15 examples in 63 years, plus the current one.
We bucketed them into three categories, based on the initial shape of the yield curve at the time:
- ORANGE: A bear steepener off inverted curves (like we have today)
- BLUE: A bear steepener off a relatively flat curve, with the 2s10s curve ranging between 7-56 bps.
- GREEN: A bear steepener off a very steep curve.
By grouping these instances into the aforementioned three categories we can look back on what subsequently happened to rates and whether they signalled a recession was around the corner.
Figure 2: Bear steepening episodes
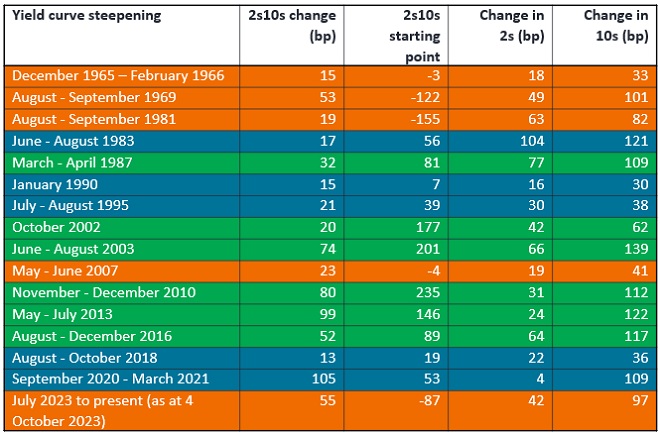
Source: Macrobond, Janus Henderson Investors, January 1960 to September 2023. Data reflects intraday highs. Current bear steepening reflects 13 July 2023 to 4 October 2023. Basis point (bp) equals 1/100 of a percentage point. 1 bp = 0.01%, 100 bps = 1%. Past performance does not predict future returns.
The following graphs show how these moves relate to the peak in bond yields for the cycle. We focus on the orange examples as this condition is the most similar to what we are seeing today (a bear steepening from a deeply inverted yield curve). It generally corresponds with the peak in 2-year yields while for 10-year yields it is close to the peak (with a notable difference being the 1969 episode).
Figure 3: US 2-year Treasury yield
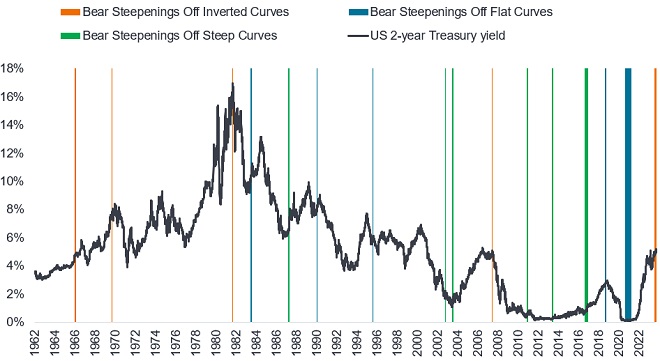
Source: Macrobond, Janus Henderson Investors, 2 January 1960 to 4 October 2023.
Figure 4: US 10-year Treasury yield
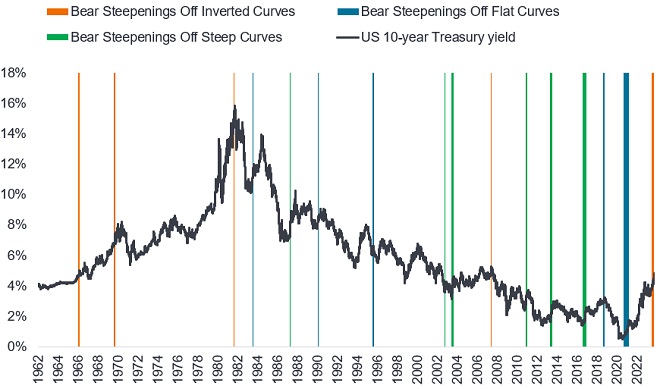
Source: Macrobond, Janus Henderson Investors, 2 January 1960 to 4 October 2023.
Bear steepenings off inverted curves (1966, 1969, 1981, 2007 & today)
The bear steepening move we are currently experiencing is unusual, in combining both a high magnitude and the starting point of a deeply inverted 2s10s curve. The closest direct comparison is the bear steepening in August-September 1969, when the curve bear steepened 53 bps over 6 weeks off a deeply inverted curve. The current move has superseded that example given it bear steepened 55 bps from 13 July to 4 October 2023.
1. Relation to the economy:
In all but one of these four examples when we bear steepened off an inverted curve we were in recession or going into recession soon. In 1969, we had to wait two months before the recession started in December 1969. In 1981, we were already in a recession for two months when the bear steepening completed in September. In 2007, the recession started in December 2007, six months after the bear steepening.
The exception was 1966 (the bear steepening actually began on 29 December 1965 and continued through the first two months of 1966) where there was no recession but there was a period of relatively slow economic growth for the subsequent 18 months. Therefore, looking at the examples above, there is no precision in timing of when a recession will occur, however the likelihood of one occurring is high.
2. Relation to bond yield peak:
Now let’s look at whether these bear steepener incidents coincided with peaks in US 10-year yields. In 1981 (generational yield peak) and June 2007 they were practically coincident with yield peaks.
In 1966, yields dipped for a few months before reaching a high in late 1966 and then falling below the levels reached in the bear steepener, but this was a punctuation in an otherwise upward trend. In 1969, the yield peak occurred two months after in December 1969 where 10-year yields went 90 bps higher and peaked around 8%, then yields fell 110 bps into February 1970, before rising again to make marginal higher highs in May 1970, before tumbling. Yields therefore traded a volatile range for six months before coming down heavily post the bear steepening.
The worst scenario would be the 1966 scenario, where the bear steepener heralded an upward trend in rates that would last approximately four years. This coincided with a period of rising inflation from 1965, with US CPI climbing from the sub-2% levels prevailing in the early 1960s to 6% by the end of 1969.1 What is notable is that 2-year bond yields climbed sharply post the bear steepening.
Contrast that with today, where inflation is declining and 2-year bond yields appear to have plateaued, suggestive of a near-terminal peak in policy rates (both for the US Federal Reserve and the European Central Bank).
Figure 5: Today’s 2-year government bond yields appear to be plateauing
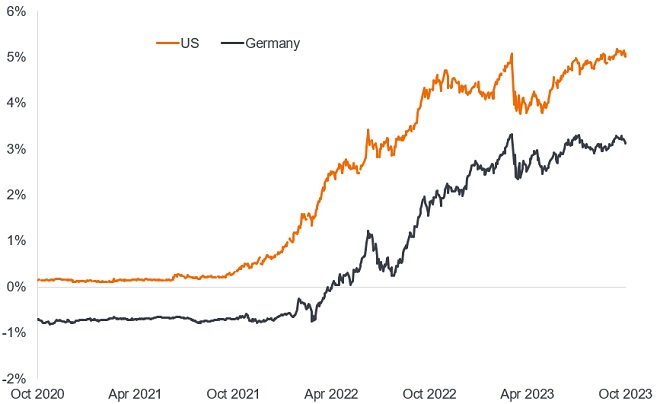
Source: Bloomberg, generic 2-year US government bond yield, generic 2-year German government bond yield, 2 January 1960 to 6 October 2023. Yields may vary over time and are not guaranteed.
Parallels with today
The magnitude of the current bear steepening from a deeply inverted curve would suggest today’s move has more in common with the 1969 and 1981 episodes. If true, it implies that a recession is likely. It would also signal that we are either at or near the peak in terms of rising rates.
1Source: LSEG Datastream, US Bureau of Labor Statistics, US consumer price index – all urban sample: all items, annual inflation rate. Between January 1961 and December 1965, the inflation rate was below 2%, it rose above 2% from January 1966 and peaked at 6.2% in December 1969.
Bear market: A financial market in which the prices of securities are falling. The opposite of a bull market.
Cycle: Upswing and downswings in activity. Cyclical companies are those that sell discretionary consumer items, such as cars, or industries highly sensitive to changes in the economy, such as miners. The prices of equities and bonds issued by cyclical companies tend to be strongly affected by ups and downs in the overall economy, when compared to non-cyclical companies.
Default: The failure of a debtor (such as a bond issuer) to pay interest or to return an original amount loaned when due.
Inflation: The annual rate of change in prices, typically expressed as a percentage rate. The Consumer Price Index (CPI) is a measure of the average change over time in the prices paid by urban consumers for a market basket of consumer goods and services.
Interest rate risk: The risk to bond prices caused by changes in interest rates. Bond prices move in the opposite direction to their yields, so a rise in rates and yields causes bond prices to fall and vice versa.
Monetary policy: The policies of a central bank, aimed at influencing the level of inflation and growth in an economy. It includes controlling interest rates and the supply of money. Easing refers to a central bank increasing the supply of money and lowering borrowing costs. Tightening refers to central bank activity aimed at curbing inflation and slowing down growth in the economy by raising interest rates and reducing the supply of money. Restrictive policy is where policy is being tightened.
Recession: A significant decline in economic activity lasting longer than a few months. A soft landing is a slowdown in economic growth that avoids a recession. A hard landing is a deep recession.
Treasury: a debt security issued by the US government. A Treasury Bill is for 12 months or less, while a Treasury Bond is for longer.
Yield: The level of income on a security, typically expressed as a percentage rate. The 10-year Treasury yield is the interest rate on US Treasury bonds that will mature 10 years from the date of purchase.
Yield curve: A graph that plots the yields of similar quality bonds against their maturities. In a normal/upward sloping yield curve, longer maturity bond yields are higher than short-term bond yields. With an inverted yield curve, yields are higher on shorter-dated bonds than longer-dated bonds. A yield curve can signal market expectations about a country’s economic direction.
Volatility: The rate and extent at which the price of a portfolio, security or index, moves up and down. If the price swings up and down with large movements, it has high volatility.
These are the views of the author at the time of publication and may differ from the views of other individuals/teams at Janus Henderson Investors. References made to individual securities do not constitute a recommendation to buy, sell or hold any security, investment strategy or market sector, and should not be assumed to be profitable. Janus Henderson Investors, its affiliated advisor, or its employees, may have a position in the securities mentioned.
Past performance does not predict future returns. The value of an investment and the income from it can fall as well as rise and you may not get back the amount originally invested.
The information in this article does not qualify as an investment recommendation.
There is no guarantee that past trends will continue, or forecasts will be realised.
Marketing Communication.