
Key takeaways:
- Weakness in private debt appears contained, with limited evidence of broader financial system risk
- Illiquidity can support returns, but it also limits flexibility when access to capital becomes more important
- Private investments may restrict cash flows when they are most needed, like during inflationary periods, reinforcing the need for balanced portfolio exposure.
When investors can’t determine the difference between the financial markets and the betting/prediction markets, it’s clear that the financial markets are in a very speculative phase, if not a full-blown bubble.
The financial markets exist for capital formation that benefits both households and businesses as a cheaper cost of capital creates real investment, improved productivity, and jobs. Betting markets add very little value to the economy.
One asset class that seemed to get overly speculative but has apparently met its match is private debt. Private debt was not long ago thought to be a safe, higher yielding asset class but, like many speculative asset classes before it, has demonstrated that risk and return are mutually exclusive. It is important to note that the asset class includes a range of sectors and approaches, such as direct lending versus more resilient asset-backed finance, so understanding what you own is more important than ever.
Some have started to question whether the problems in private debt are systemic and if investors will face another financial crisis like 2008’s. But this might be an overreaction, because the problems in private debt so far do not appear to be systemic.
How bad has it been?
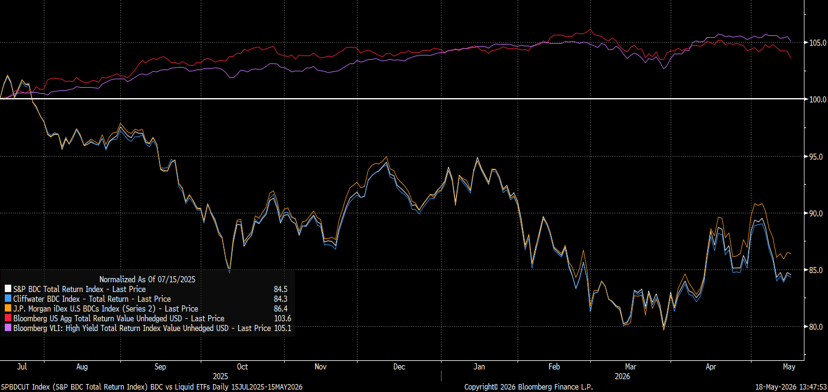
Headlines have highlighted that private debt investments have significantly underperformed over the past year. Chart 1 compares the performance of the several Business Development Company (BDC) Indices to that of the Bloomberg US Aggregate Index and the Bloomberg VLI High Yield Index since July 2025’s peak in private debt-related investments.
The overall bond market and even high-yield bonds have provided about 5% total return since that point, but BDCs are down around 14%-15%. The underperformance of private debt investments is notable, but most would not consider it calamitous.
The issue for some investors was illiquidity and the inability to withdraw assets from a private debt manager. Illiquidity can be a benefit to long-term returns, but it can also be a negative factor for shorter-term returns. Some investors apparently overlooked this consideration.
Chart 1: BDC Indices vs. The Bloomberg Aggregate and Bloomberg High Yield Indices
Source: RBA/JHI, Bloomberg Finance LLP, as of May 18, 2026.
Are the problems systemic?
By our reckoning, the problems in private debt do not yet suggest systemic risk, and so far, seem limited to a single sector and direct lending. To date, there is little market-related evidence that the overall banking sector is at risk because of the issues relating to private debt.
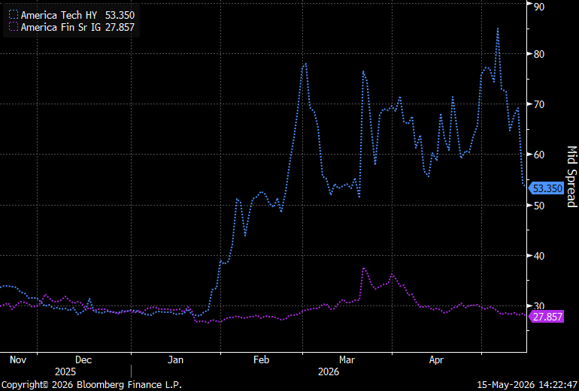
Bank stocks have underperformed the overall stock market, but that might be more attributable to the speculative nature of the stock market than a comment on the health of the major banks. However, Chart 2 highlights credit default swap (CDS) spreads for various sectors of bonds. CDS is essentially a hedge against bond default, with higher spreads suggesting greater risk of default and accordingly a higher cost.
CDS spreads for bonds in the high-yield (i.e., riskier) Technology sector have significantly risen over the past year, reflecting the perception that bonds in this sector have an increasing probability of default. However, CDS spreads for investment-grade financials have not meaningfully changed.
Rising CDS spreads suggest the fears of default may be increasing within the Technology sector, but those fears seem very sector specific and are not geared toward the larger financial system. If the financial system were at risk, then it would be likely that the risk of default among financial companies’ bonds would also be rising, and that is not the case.
CDS data are not available for bonds during the Global Financial Crisis (GFC). However, in 2011, three years after the worst of the GFC, CDS spreads for investment-grade financial bonds were roughly 10 times their current level, according to Bloomberg.
Chart 2: CDS Spreads: U.S. high-yield Tech vs. U.S. investment-grade Financials (Nov. 15, 2025 – May 15, 2026)
Source: RBA/JHI, Bloomberg Finance LLP, as of May, 15, 2026].
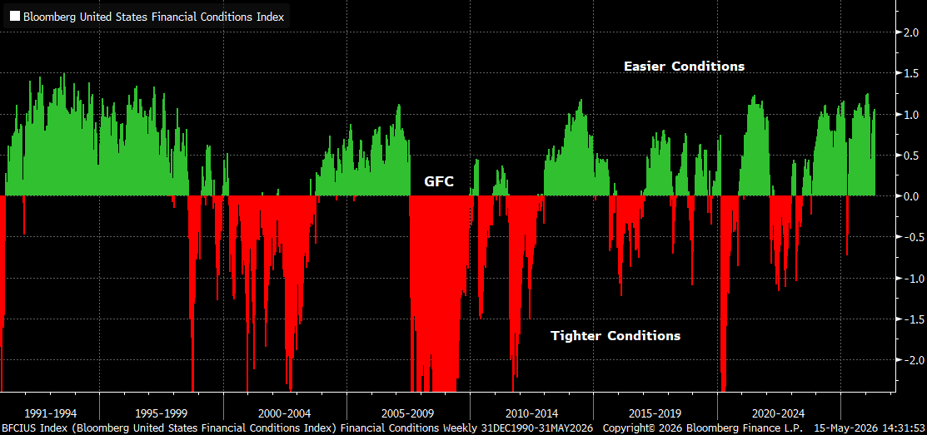
General market-related financial conditions remain very easy, which also argues against a systemic problem. Chart 3 shows the Bloomberg Financial Conditions Index, which incorporates a range of capital formation indicators. Financial conditions are nowhere near resembling those of the significant tightening in 2007 related to the GFC.
Chart 3: Bloomberg Financial Conditions Index
Source: RBA/JHI, Bloomberg Finance LLP, as of May 15, 2026.
Negative convexity might be kryptonite for privates
Duration generally refers to the interest rate sensitivity of a bond, and measures how much return investors should expect and when to expect to receive it. For example, a 10-year zero-coupon bond has a duration equal to its maturity because there are no interim coupons and the return occurs when the bond matures in 10 years. A 10-year coupon-bearing bond would have a shorter duration than the zero-coupon bond because the coupons are interim returns.
Bonds with longer durations tend to outperform when 10-year Treasury yields fall, whereas bonds with shorter durations tend to outperform when interest rates increase because of simple present-value calculations
Convexity is a measure of how duration changes as interest rates change. Negative convexity typically refers to bonds whose duration increases as interest rates rise and shortens when interest rates fall. The duration of bonds with positive convexity tends to increase as interest rates fall and shorten when interest rates rise.
Some alternatives, such as private equity and private debt, might possess negative convexity. Here is a simple way to think of what causes this negative convexity:
Negative convexity of private investments
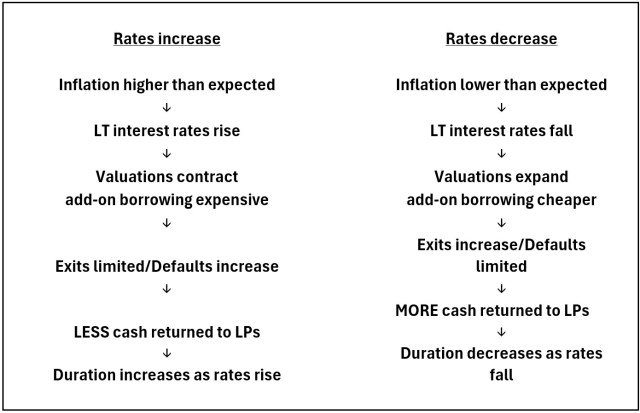
Essentially, private investments tend to distribute cash to investors during disinflationary periods when the demand for near-term cash flow is relatively reduced, but they tend NOT to distribute cash to investors during inflationary periods when near-term cash flows become paramount because of increasing operating and living costs.
What offsets negative convexity?
Again, there is nothing inherently wrong with private investments, so long as one understands the liquidity risks and considers whether one can balance the negative convexity of such investments against needs for near-term cash flow should inflation continue to increase.
Our positioning continues to serve as a diversifier relative to generic private debt and private equity. In this environment, this translates to a bias toward pro-inflation assets, such as stocks with dividend yield and shorter-duration higher-quality fixed income. Dividend yield might be a good simple offset to private investments’ negative convexity.
IMPORTANT INFORMATION
Alternative investments include, but are not limited to, commodities, real estate, currencies, hedging strategies, futures, structured products, and other securities intended to be less correlated to the market. They are typically subject to increased risk and are not suitable for all investors.
Derivatives can be more volatile and sensitive to economic or market changes than other investments, which could result in losses exceeding the original investment and magnified by leverage.
Equity securities are subject to risks including market risk. Returns will fluctuate in response to issuer, political and economic developments.
Fixed income securities are subject to interest rate, inflation, credit and default risk. As interest rates rise, bond prices usually fall, and vice versa. High-yield bonds, or “junk” bonds, involve a greater risk of default and price volatility. Foreign securities, including sovereign debt, are subject to currency fluctuations, political and economic uncertainty and increased volatility and lower liquidity, all of which are magnified in emerging markets.
Financials industries can be significantly affected by extensive government regulation, subject to relatively rapid change due to increasingly blurred distinctions between service segments, and significantly affected by availability and cost of capital funds, changes in interest rates, the rate of corporate and consumer debt defaults, and price competition.
Technology industries can be significantly affected by obsolescence of existing technology, short product cycles, falling prices and profits, competition from new market entrants, and general economic conditions. A concentrated investment in a single industry could be more volatile than the performance of less concentrated investments and the market as a whole.
Private debt/credit refers to direct lending or debt financing outside of traditional banking, typically involving non-publicly traded companies, and comes with increased risk including limited liquidity, reliance on the borrower’s financial health, and less regulatory oversight compared to traditional bank lending.
Private equity investments are speculative and involve a high degree of risk. These strategies are typically illiquid, rely on estimated or unaudited valuations, and may be sensitive to shifts in financing conditions. Returns often depend on access to debt or equity markets, which can be constrained during periods of stress. Regulatory scrutiny of private markets continues to evolve, potentially increasing compliance burdens and limiting flexibility. Long holding periods, limited transparency, and reliance on manager execution further contribute to the elevated risk profile.
Swap agreements are derivative contracts that provide synthetic exposure to a reference asset or index and may introduce counterparty default risk, valuation uncertainty, and leverage effects. Returns may differ from the reference exposure due to fees, collateral requirements, or imperfect correlation. Swap exposures may be less liquid or more volatile during periods of market stress.
The following descriptions, while believed to be accurate, are in some cases abbreviated versions of more detailed or comprehensive definitions available from the sponsors or originators of the respective indices. Anyone interested in such further details is free to consult each sponsor’s or originator’s website.
The past performance of an index is not a guarantee of future results.
Each index reflects an unmanaged universe of securities without any deduction for advisory fees or other expenses that would reduce actual returns, as well as the reinvestment of all income and dividends. An actual investment in the securities included in the index would require an investor to incur transaction costs, which would lower the performance results. Indices are not actively managed, and investors cannot invest directly in the indices.
The S&P BDC Index measures the performance of Business Development Companies that trade on major U.S. exchanges. Constituents are float-adjusted market capitalization (FMC) weighted, subject to a single constituent weight cap of 10%. U.S. Business Development Companies (BDCs) are publicly traded private equity firms that invest equity and debt capital in small and mid-sized businesses and make managerial assistance available to portfolio companies. subject to certain eligibility criteria such as minimum FMC and liquidity requirements.
The Cliffwater BDC Index is a capitalization-weighted index that measures the performance of lending-oriented, exchange-traded Business Development Companies (BDCs), subject to certain eligibility criteria regarding portfolio composition, market capitalization, and dividend history.
J.P. Morgan iDex U.S. BDCs Index: The J.P. Morgan iDex U.S. BDCs Index is a synthetic, rules-based proprietary index. Monthly rebalanced with a 12.5% cap-weighting, using a 90 day dollar notional trading estimate. Monthly, a takeover and borrow screen is applied.
Bloomberg Financial Conditions Index is a composite metric that tracks the overall level of stress or ease in money, bond, and equity markets to assess the availability and cost of credit. It provides a daily snapshot of how restrictive or accommodative financial conditions are.
The Bloomberg US Aggregate Index is a broad-based flagship benchmark that measures the investment grade, US dollar-denominated, fixed-rate taxable bond market. The index includes Treasuries, government-related and corporate securities, MBS (agency fixed-rate pass-throughs), ABS and CMBS (agency and non-agency).
Bloomberg VLI High Yield Total Return Index: The Bloomberg VLI High Yield Total Return Index is a component of the US Corp High Yield Index that is designed to track a more liquid component of the USD-denominated, high yield, fixed-rate corporate bond market. The US High Yield VLI uses the same eligibility criteria as the US Corp High Yield Index, but includes only bonds that have a minimum amount outstanding of USD500mn and less than five years from issue date.
10-Year Treasury Yield is the interest rate on U.S. Treasury bonds that will mature 10 years from the date of purchase.
Asset Backed finance involves loans secured by assets, where the loan value is based on the value of the collateral offered. Asset backed lending carries risks such as collateral depreciation, borrower default, and potential liquidity constraints during market downturns.
Basis point: One basis point (bp) equals 1/100 of a percentage point, 1bp = 0.01%.
Credit default swap (CDS): A form of derivative contract between two parties used to manage the credit risk of a bond. The buyer makes regular payments to the seller, while the seller agrees to pay off the underlying debt if there is a default on the bond. A CDS is considered a hedge against non-payment and is also a tradable security. This allows a fund manager to take positions on a particular issuer or index without owning the underlying security or securities. A CDS may expose investors to counterparty risk, liquidity risk, valuation risk, and the potential for losses that exceed the initial investment. Market disruptions or a counterparty’s failure to perform may impact the effectiveness of a CDS strategy or result in unexpected losses. There can be no assurance that the use of CDS will achieve its intended objective.
Credit spread: The difference in yield between securities with similar maturity but different credit quality. Widening spreads generally indicate deteriorating creditworthiness of corporate borrowers, and narrowing indicate improving.
Direct lending is a private debt strategy where non-bank lenders (like asset managers and private equity funds) provide loans directly to companies without traditional banking intermediaries.
Duration measures a bond price’s sensitivity to changes in interest rates. The longer a bond’s duration, the higher its sensitivity to changes in interest rates and vice versa.
High yield bond: Also known as a sub-investment grade bond, or ‘junk’ bond. These bonds usually carry a higher risk of the issuer defaulting on their payments, so they are typically issued with a higher interest rate (coupon) to compensate for the additional risk.
Inflation: The rate at which the prices of goods and services are rising in an economy. The Consumer Price Index (CPI) and Retail Price Index (RPI) are two common measures.
Investment grade bond: A bond typically issued by governments or companies perceived to have a relatively low risk of defaulting on their payments, reflected in the higher rating given to them by credit ratings agencies.
Yield: The level of income on a security over a set period, typically expressed as a percentage rate. For equities, a common measure is the dividend yield, which divides recent dividend payments for each share by the share price. For a bond, this is calculated as the coupon payment divided by the current bond price.