
Jim Cielinski, Global Head of Fixed Income, answers some of the common questions we have received about liquidity within fixed income markets and how we have approached trading and portfolio positioning.
Principaux points à retenir
- There is a difference between a liquidity event and a liquidity crisis. A crisis occurs when many deserving borrowers are unable to obtain access to capital.
- A full-blown crisis was averted in March through the swift action by central banks and governments, but attention must now turn to the damage caused to economic and credit fundamentals.
- While unsettling, periods of illiquidity can present opportunities for liquidity providers.
- The current environment is different from 2008. A globally coordinated policy response was needed. The policy response so far has been very pro-active but success in stopping the spread of COVID-19 coronavirus will determine future market movements.
What is liquidity?
Liquidity is difficult to define. It became a prominent topic in March as markets fixated on a possible ‘liquidity crisis’ or companies lacking ‘liquidity’. Typically, liquidity means one of the following:
- Market liquidity: the ease with which an asset can be bought or sold.
- Corporate liquidity: the ease with which a company can access capital markets or is able to readily convert its assets into cash to meet its obligations.
Many conflated these two definitions, but they are not the same thing. Market liquidity grabbed a lot of headlines in March, but it is in fact the least of the issues investors should be concerned about in the wake of COVID-19.
Asset prices collapsed in March, but this was not a reflection of illiquidity. It was a statement that risky assets were suddenly worth less – much less. The markets went from pricing in a sanguine economic backdrop to expecting a staggering recession in 2020. This adjustment was done in less than 20 trading days, and thus no one should be surprised by the fact that markets were disorderly. This failure of bond markets to function properly when investors all wanted to own cash was indeed a liquidity event. But for most investors, this is also a side-show. Liquidity events arising from exogenous shocks are typically short-lived.
An indebted company that cannot access capital markets, however, is an entirely different matter. This is a liquidity event to be feared, as any reduction in earnings can quickly lead to an inability to service obligations. Equally, a company that owns illiquid assets may also struggle, as their inability to convert assets to cash may lead to the same issue.
We must not confuse a severe market adjustment or market correction with a liquidity crisis. Illiquidity is a symptom of stress, but it should not shoulder the blame when a buyer or seller does not get the price they want. A surplus of sellers relative to buyers can, unless it is arrested, eventually lead to a liquidity crisis. Fortunately, central banks and governments responded to the COVID-19 crisis quickly and in massive size. This is likely enough to preclude a classic market liquidity crisis.
Although enlightening, both of the above definitions of liquidity miss the most fundamental point: in a recession, the only relevant question is one of solvency. If companies struggle to tap capital markets, are simply over-leveraged, cannot sell assets, or have assets worth less than their liabilities, they are in trouble. If a company is insolvent, the root cause cannot be readily addressed through fiscal and monetary policy.
Markets in the coming weeks are going to focus on reversing the order of the above issues. Solvency concerns will come first, corporate liquidity second, and market liquidity issues a distant third. A wider bid/offer spread (the price difference between what you can can buy or sell a security at) is immaterial if there is a concern about the ability for companies to pay their bills. Whether companies can meet their obligations is what will drive markets higher or lower. Bankruptcies are coming, irrespective of the path of COVID-19, but a solvency crisis can probably be avoided if the global shutdown is brief and the policy floodgates are opened.
There will be some outstanding opportunities emerging within credit markets, but this needs to be weighed up against the severity and duration of the economic downturn. Given that the macro backdrop is a broad topic in its own right, we will preserve a fuller discussion of credit fundamentals and valuations for a separate feature.
Market conditions
What was unusual about market moves in March 2020?
Four factors stand out:
- Most importantly it was the speed of the decline. Bid/offer spreads, a primary indicator of liquidity strains, ballooned to three to four times their normal levels, and the depth of the market shrunk dramatically. Equally unusual was that this move was witnessed across the board and infiltrated even the safest of assets, such as US government bonds.
- Forced selling was intense, but seemingly brief. This corroborated the view that there is much less systemic leverage in the system today relative to the 2008 Global Financial Crisis (GFC). Following a wave of asset deleveraging in mid-March, the selling from these groups has tapered off, hinting that this crisis is different.
- Policymakers stepped in with unprecedented size and speed. Central bankers have many tools to combat liquidity strains, and they implemented most of them in March.
- This was the first real test of exchange traded funds (ETFs) as a source of liquidity in fast-moving, highly volatile markets. Under the circumstances, they did relatively well, accompanying derivatives as the areas of the bond market able to absorb huge volumes. ETFs overshot in the short-term as sellers flooded the market, and there was a focus on how much of a discount some ETFs traded at relative to underlying assets. But much of this discrepancy was ephemeral. With the only liquidity in the market available in ETFs, quoted prices of many individual cash bonds simply failed to keep up with reality, giving the appearance of a large divergence that simply was not tradeable.
One test of illiquidity is shown in the chart below, illustrating the difference between liquid credit derivatives (synthetics) and cash bonds – a relationship known as the basis. In periods of market stress, synthetics can be traded readily and thus move quickly to reflect true market levels, widening the basis relative to less liquid cash bonds (Figure 1). The option adjusted spread (OAS) for investment grade (Cash Bond – CDX) began the year at 25 basis points (bps) and rose as high as 259 bps. Likewise, the OAS spread for high yield (Cash Bond – CDX) increased from 59 bps to 389 bps. This was a sign of stress that has since been corrected.
Figure 1: The difference in spread between cash bonds and synthetics.Synthetics are typically more liquid and this reached extreme levels in mid to late March.
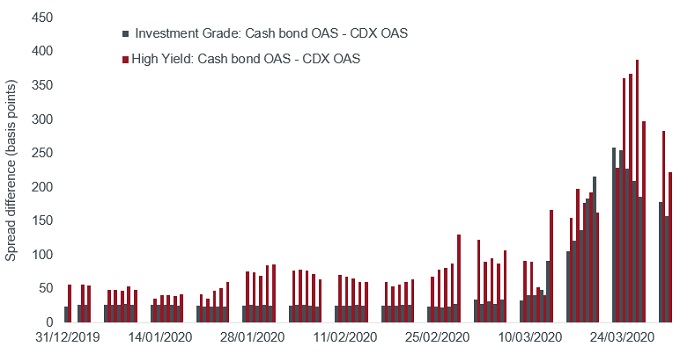
Option-Adjusted Spread (OAS) measures the spread between a fixed-income security rate and the risk-free rate of return, which is adjusted to take into account an embedded option. The Credit Default Swap Index (CDX) is a benchmark index that tracks a basket of US single-issuer credit default swaps. Basis point (bp) equals 1/100 of a percentage point. 1 bp = 0.01%, 100 bps = 1%.
Source: Bloomberg, Barclays Live, Investment grade: Bloomberg Barclays US Intermediate Corporate Index (Cash Bonds) minus the spread on Markit CDX IG CDSI GEN 5Y Corp (Synthetics), High yield: Bloomberg Barclays US High Yield Index (Cash Bonds) minus the spread on Markit CDX HY CDSI GEN 5Y SPRD Corp (Synthetics), 31 December 2019 to 31 March 2020. The Bloomberg Barclays US Intermediate Corporate Bond Index measures the investment grade, fixed-rate, taxable corporate bond market whose maturity ranges between 1 to 9.9999 years. The Bloomberg Barclays US Corporate High-Yield Bond Index measures the USD-denominated, high yield, fixed-rate corporate bond market.
Which areas of fixed income have been facing the greatest stress?
The riskiest areas of the market – high yield and bank loans – have been among the hardest hit. Bid/offer spreads remain wide, and market depth poor. The most levered parts of fixed income are, of course, at highest risk of default and have been left with little policymaker support, leading us to believe that this relatively poor liquidity may persist.
Mortgages initially suffered, and some areas of the mortgage market remain very depressed. Again, poor liquidity is accompanying rapidly worsening fundamentals in this space. Many commercial mortgages will be hampered by a disruption to mortgage payments from a wide range of borrowers.
How has the decline in market makers post the 2008 Global Financial Crisis (GFC) affected liquidity?
The common refrain from the market is that illiquidity has suffered from regulation, but this does not entirely hold up to scrutiny. Regulations introduced following the GFC constrained brokers’ ability to warehouse significant levels of risk. In normal trading periods, the depth of markets has been hampered by these restrictions. Yet there is little evidence that, in times of stress, this higher risk-taking ability has ever fostered better liquidity. The size of broker/dealer (B/D) balance sheets was historically highly cyclical. For example, the size of B/D balance sheets reached an all-time peak in 2007, just before the GFC. This ensured that market-makers also needed to liquidate risk just as the market turned. Unregulated markets made an acute situation even worse. It is likely that if capital constraints had been looser something similar would have occurred in 2020.
How is Janus Henderson managing fixed income liquidity challenges?
How are we altering our trading?
In periods of challenged liquidity, we seek to be liquidity providers. It is better to be a buyer when everyone else is a seller. This allows us to be more opportunistic in periods of heightened volatility. Moreover, we seek to be much more active in new issue markets in low liquidity environments, as these new issues are pricing at levels consistent with extreme dislocation. Finally, we are making use of liquid derivatives where possible to minimise transaction costs.
What are we doing about cash levels?
Where possible, we are generally keeping cash levels higher than we would on average. Liquidity is one of the reasons. When transaction costs and uncertainty are both high, one does not want to be a forced seller at the wrong time. In fixed income, it is relatively easy to replace risk with derivative exposure or higher beta exposures to compensate for these higher cash levels.
Cash levels are also kept higher to take advantage of the many opportunities that might present themselves in volatile markets.
How do we measure liquidity?
Liquidity, like investment risk, is not something that can be explained in a single number. It is highly unstable and time-varying. We use a range of inputs to assess liquidity both in the markets and in our portfolios. In markets, we look at various tools to assess liquidity. Bid/offer spreads and daily volumes are one metric. We also utilise third-party tools that assign liquidity scores to our holdings, which can in turn be used to form portfolio scores. There are many more anecdotal pieces of evidence we look at, such as levels of new issuance. At the portfolio level, we also compile a wide range of data, such as the percentage of the portfolio in cash and liquid investments, the number of days to liquidate a portfolio, and bucketing that will allow us to identify the portion of a portfolio that is illiquid. We use all of these to assess risks in our portfolios.
Comparisons with other crises
How does 2020 compare with the 2008 GFC?
Every crisis is different, and we do not yet know how this one will play out. Thus far, it is not close to the severity of the GFC. A key difference is the expected shape of the decline in economic activity. Whereas the GFC was drawn out for two years, with the cumulative decline in output similar to what we expect today, the longer-term nature made it more painful. If the markets are correct that the 2020 crisis will be a shorter, albeit sharper, correction it will allow markets to regain their footing more quickly.
Other key differences are the size and the speed of the recent policy response. Policy response has been much bigger in magnitude, with unlimited quantitative easing (QE), liquidity backstops, corporate bond buying and fiscal programmes. Policy responses normally lag market crises; however, this time they’ve occurred before the recession and credit events unfolded. This will be an experiment to test the limits of policy.
How were credit investors positioned just before the 2008 GFC compared to the period before the sell-off in March 2020?
Investors are more defensively positioned this time around. Importantly, the degree of systemic leverage is much lower across the financial system today. In the GFC, financial institutions were highly levered, leading to a liquidity crisis as funding was cut off, forcing a massive disposal of assets held within these levered structures. Today, we have less systemic leverage, but more investors are positioned in less liquid structures and non-financial corporations carry more debt in aggregate.
What are the key policy responses that are different from those in 2008?
Most of the tools are the same ones utilised in the GFC, albeit with some cosmetic differences. Several, however, are new and noteworthy. The US Federal Reserve (Fed) has now joined the European Central Bank (ECB) and the Bank of England in purchasing investment grade (IG) corporate bonds, which is helping the US IG corporate bond market to find a floor. We have seen a meaningful rally in IG credit spreads from the March wides. There has been substantial new issuance from companies recently. In fact, according to Bloomberg, US IG bond issuance was US$259 billion in March – a monthly record – and European supply reached €135 billion – the highest figure since 2016 – which hardly squares with claims of a liquidity crisis. It suggests the measures taken by authorities to lubricate the system are having some success.
The Fed is implementing two programmes:
- The Primary Market Corporate Credit Facility (PMCCF) to buy IG corporate bonds below four years maturity in the primary market. The Fed also may buy US listed ETFs whose investment objective is to provide broad exposure to the US IG bond market.
- The Secondary Market Corporate Credit Facility (SMCCF) to buy IG corporate bonds below five years maturity in the secondary market.
In Europe, the ECB has abandoned its rules limiting purchases to no more than a third of each member country’s eligible bonds. This is a big step, reflecting the need to do more to protect the more perilous countries, such as Italy.
Which areas of credit markets benefit from fresh asset purchase schemes?
Higher quality assets are the biggest beneficiaries. Investment grade bonds, government bonds, and high-quality mortgages are directly included in the various support packages. High yield securities will at some point offer value, but these companies will need to stand on their own feet and are therefore more exposed to the tail risk of a longer shutdown.
Les opinions exprimées sont celles de l'auteur au moment de la publication et peuvent différer de celles d'autres personnes/équipes de Janus Henderson Investors. Les références faites à des titres individuels ne constituent pas une recommandation d'achat, de vente ou de détention d'un titre, d'une stratégie d'investissement ou d'un secteur de marché, et ne doivent pas être considérées comme rentables. Janus Henderson Investors, son conseiller affilié ou ses employés peuvent avoir une position dans les titres mentionnés.
Les performances passées ne préjugent pas des résultats futurs. Toutes les données de performance tiennent compte du revenu, des gains et des pertes en capital mais n'incluent pas les frais récurrents ou les autres dépenses du fonds.
Les informations contenues dans cet article ne constituent pas une recommandation d'investissement.
Il n'y a aucune garantie que les tendances passées se poursuivront ou que les prévisions se réaliseront.
Communication Publicitaire.