
Key takeaways:
- After strong performance in the second half of 2025, the Iran conflict and narrow, AI-driven market leadership have overshadowed the healthcare sector’s underlying fundamentals this year.
- Healthcare’s defensive characteristics and relatively low correlation to technology stocks have been on full display, underscoring the sector’s potential value as a source of diversification and differentiated returns.
- Continued innovation across biopharma, improving visibility in managed care, and more compelling valuations in medtech and life science tools support a constructive outlook for the second half of the year, in our view.
In a year that has so far been marked by two dominant forces – the Iran war and the reemergence of investor enthusiasm for the AI theme – healthcare’s underlying fundamentals have been somewhat overshadowed. Yet beneath the surface, we see encouraging signs across the healthcare landscape that we believe may be creating an attractive opportunity for patient investors.
For perspective, it’s helpful to consider how we got here. Healthcare staged a robust recovery in the second half of 2025 as policy headwinds began to fade, and entered 2026 on stronger footing. The sector further demonstrated its resilience in the face of a volatile macro backdrop at the start of the year, including the onset of the Middle East conflict. But a period of narrow market leadership since the end of March, led by a surge in semiconductors and AI-related technology companies, has left healthcare and other more defensive-oriented sectors lagging behind.
Exhibit 1: Narrow, AI-driven market leadership has left healthcare and other sectors behind
Total return % change, indexed to 30 June 2025
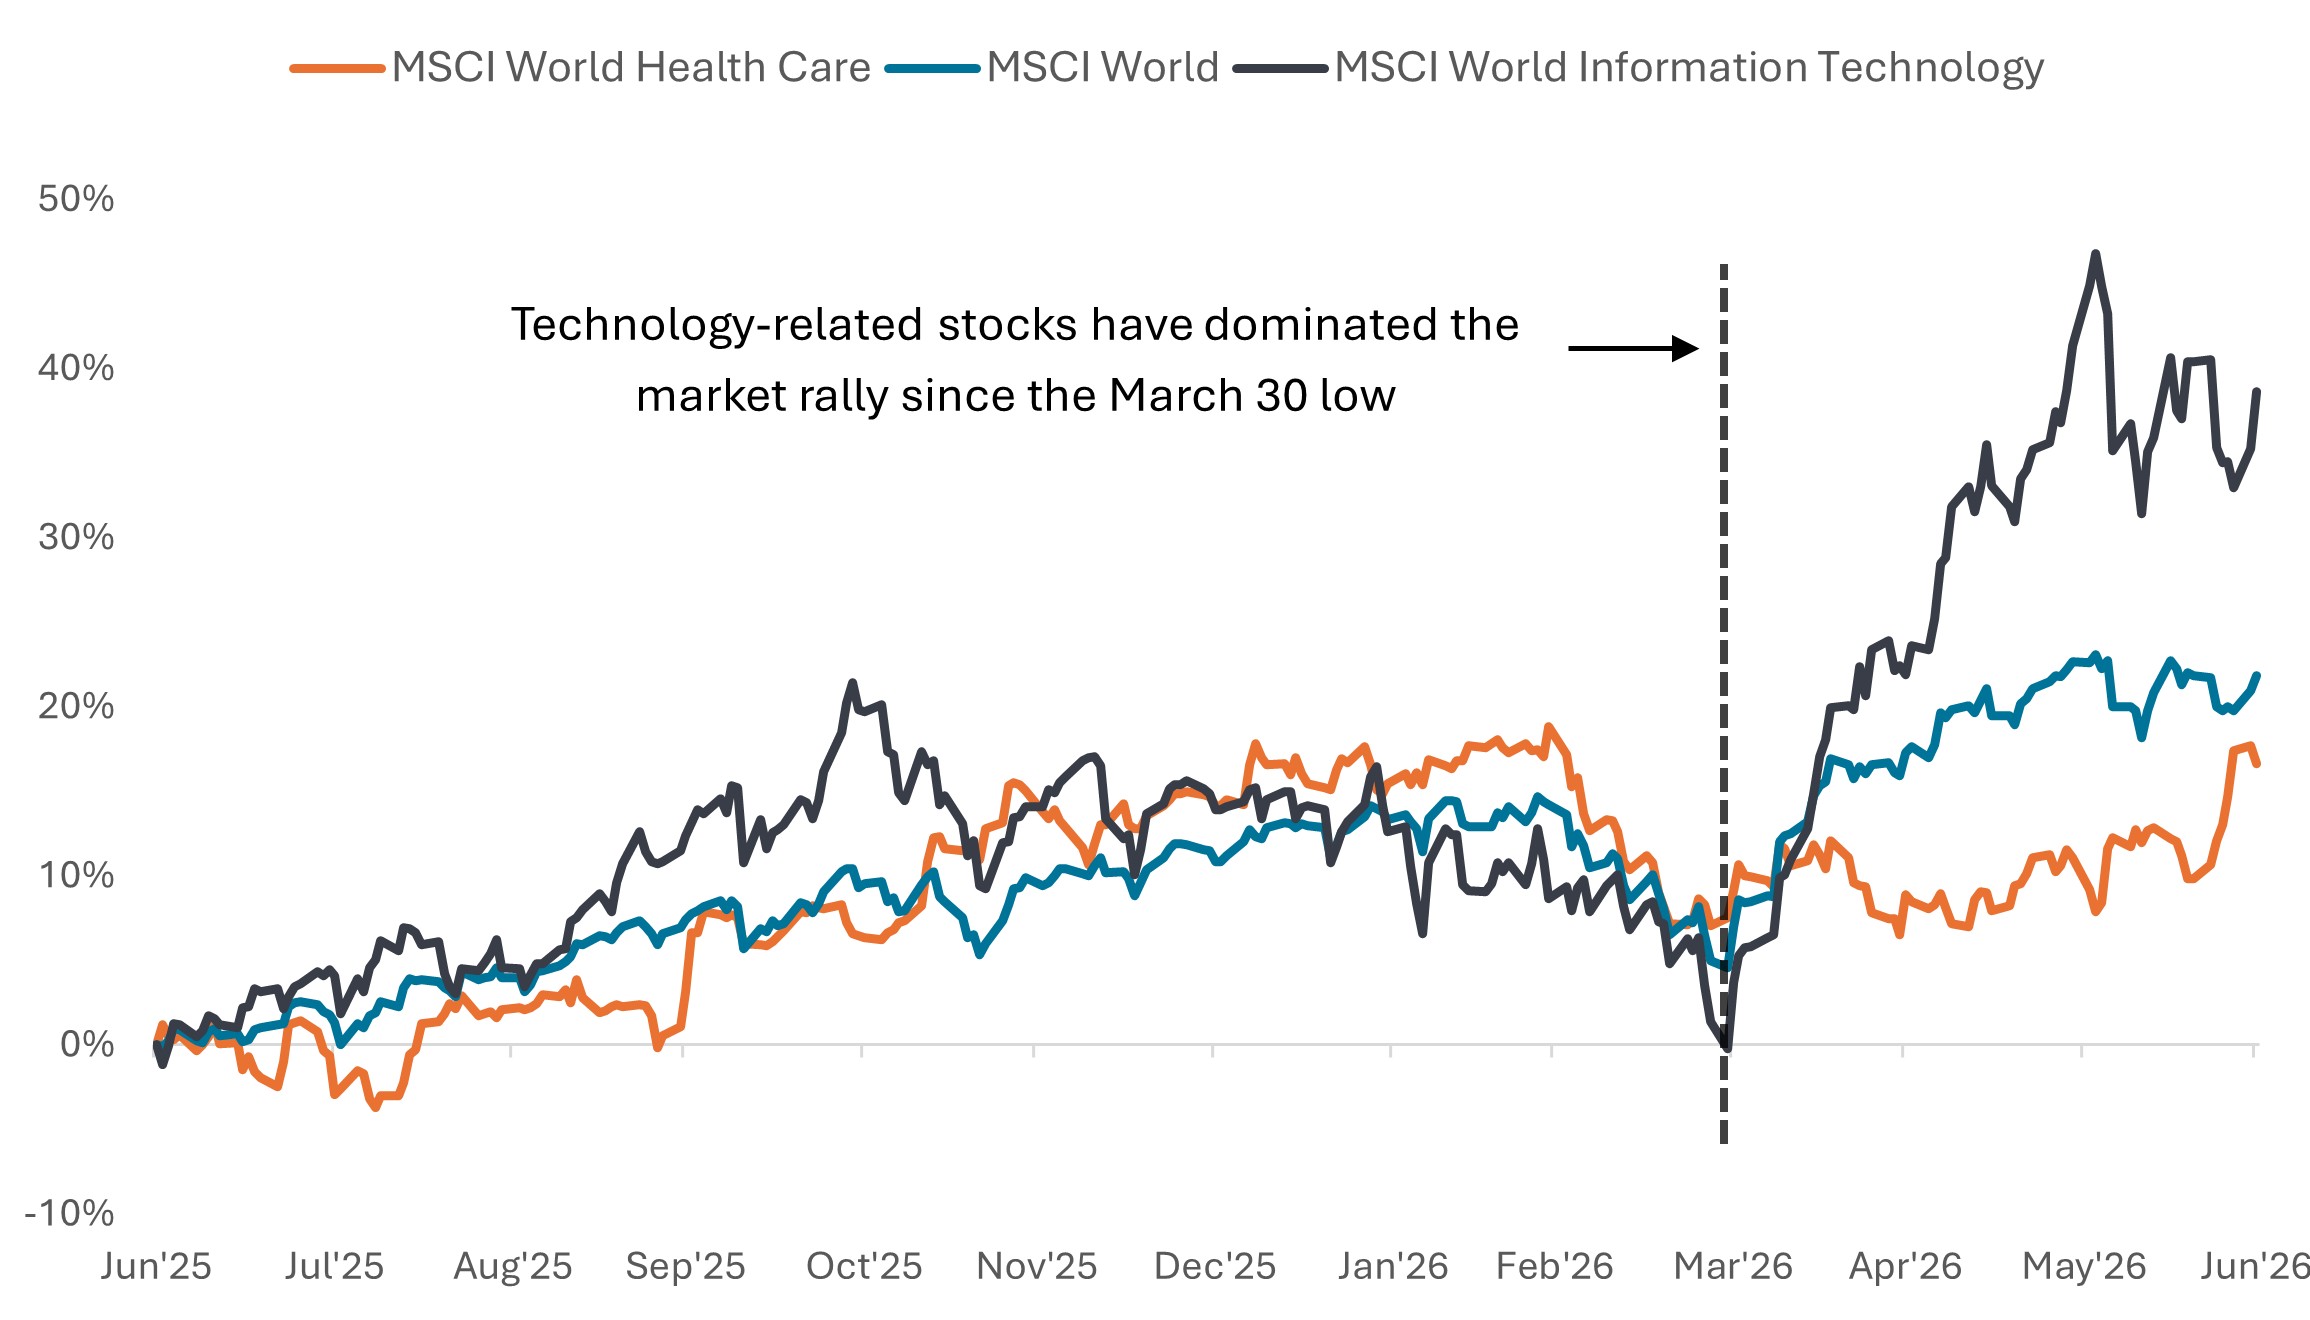
Source: Bloomberg, data as of 30 June 2025 to 30 June 2026. Past performance does not predict future results.
We would argue that healthcare’s relative underperformance is more indicative of swings in sentiment than a deterioration in fundamentals. Innovation has continued to drive growth across areas like pharma and biotech, while a reset in expectations has improved the setup for more challenged subsectors, in our view.
Healthcare as a source of differentiated returns
Moreover, while the tech-led rally has amplified market concentration concerns, bouts of volatility have revealed healthcare’s value as a potential source of diversification and differentiated returns. With its relatively low correlation to tech and other sectors, healthcare has tended to hold up better on days when technology stocks have experienced sharp declines. Indeed, of the 13 days in 2026 when the MSCI World Information Technology Index has dropped by 2% or more, the MSCI World Health Care Index has outperformed tech by an average of 2.6% and even delivered outright gains on four of those days (Exhibit 2).
With a blend of defensive characteristics and exposure to powerful themes such as medical innovation and aging demographics, we see scope for healthcare stocks to gain appeal should market leadership begin to broaden – as was beginning to occur prior to the Iran conflict and again in late June.
Exhibit 2: Healthcare’s low correlation with Tech on full display in 2026
Price % change on days when Information Technology declined by at least 2.0%
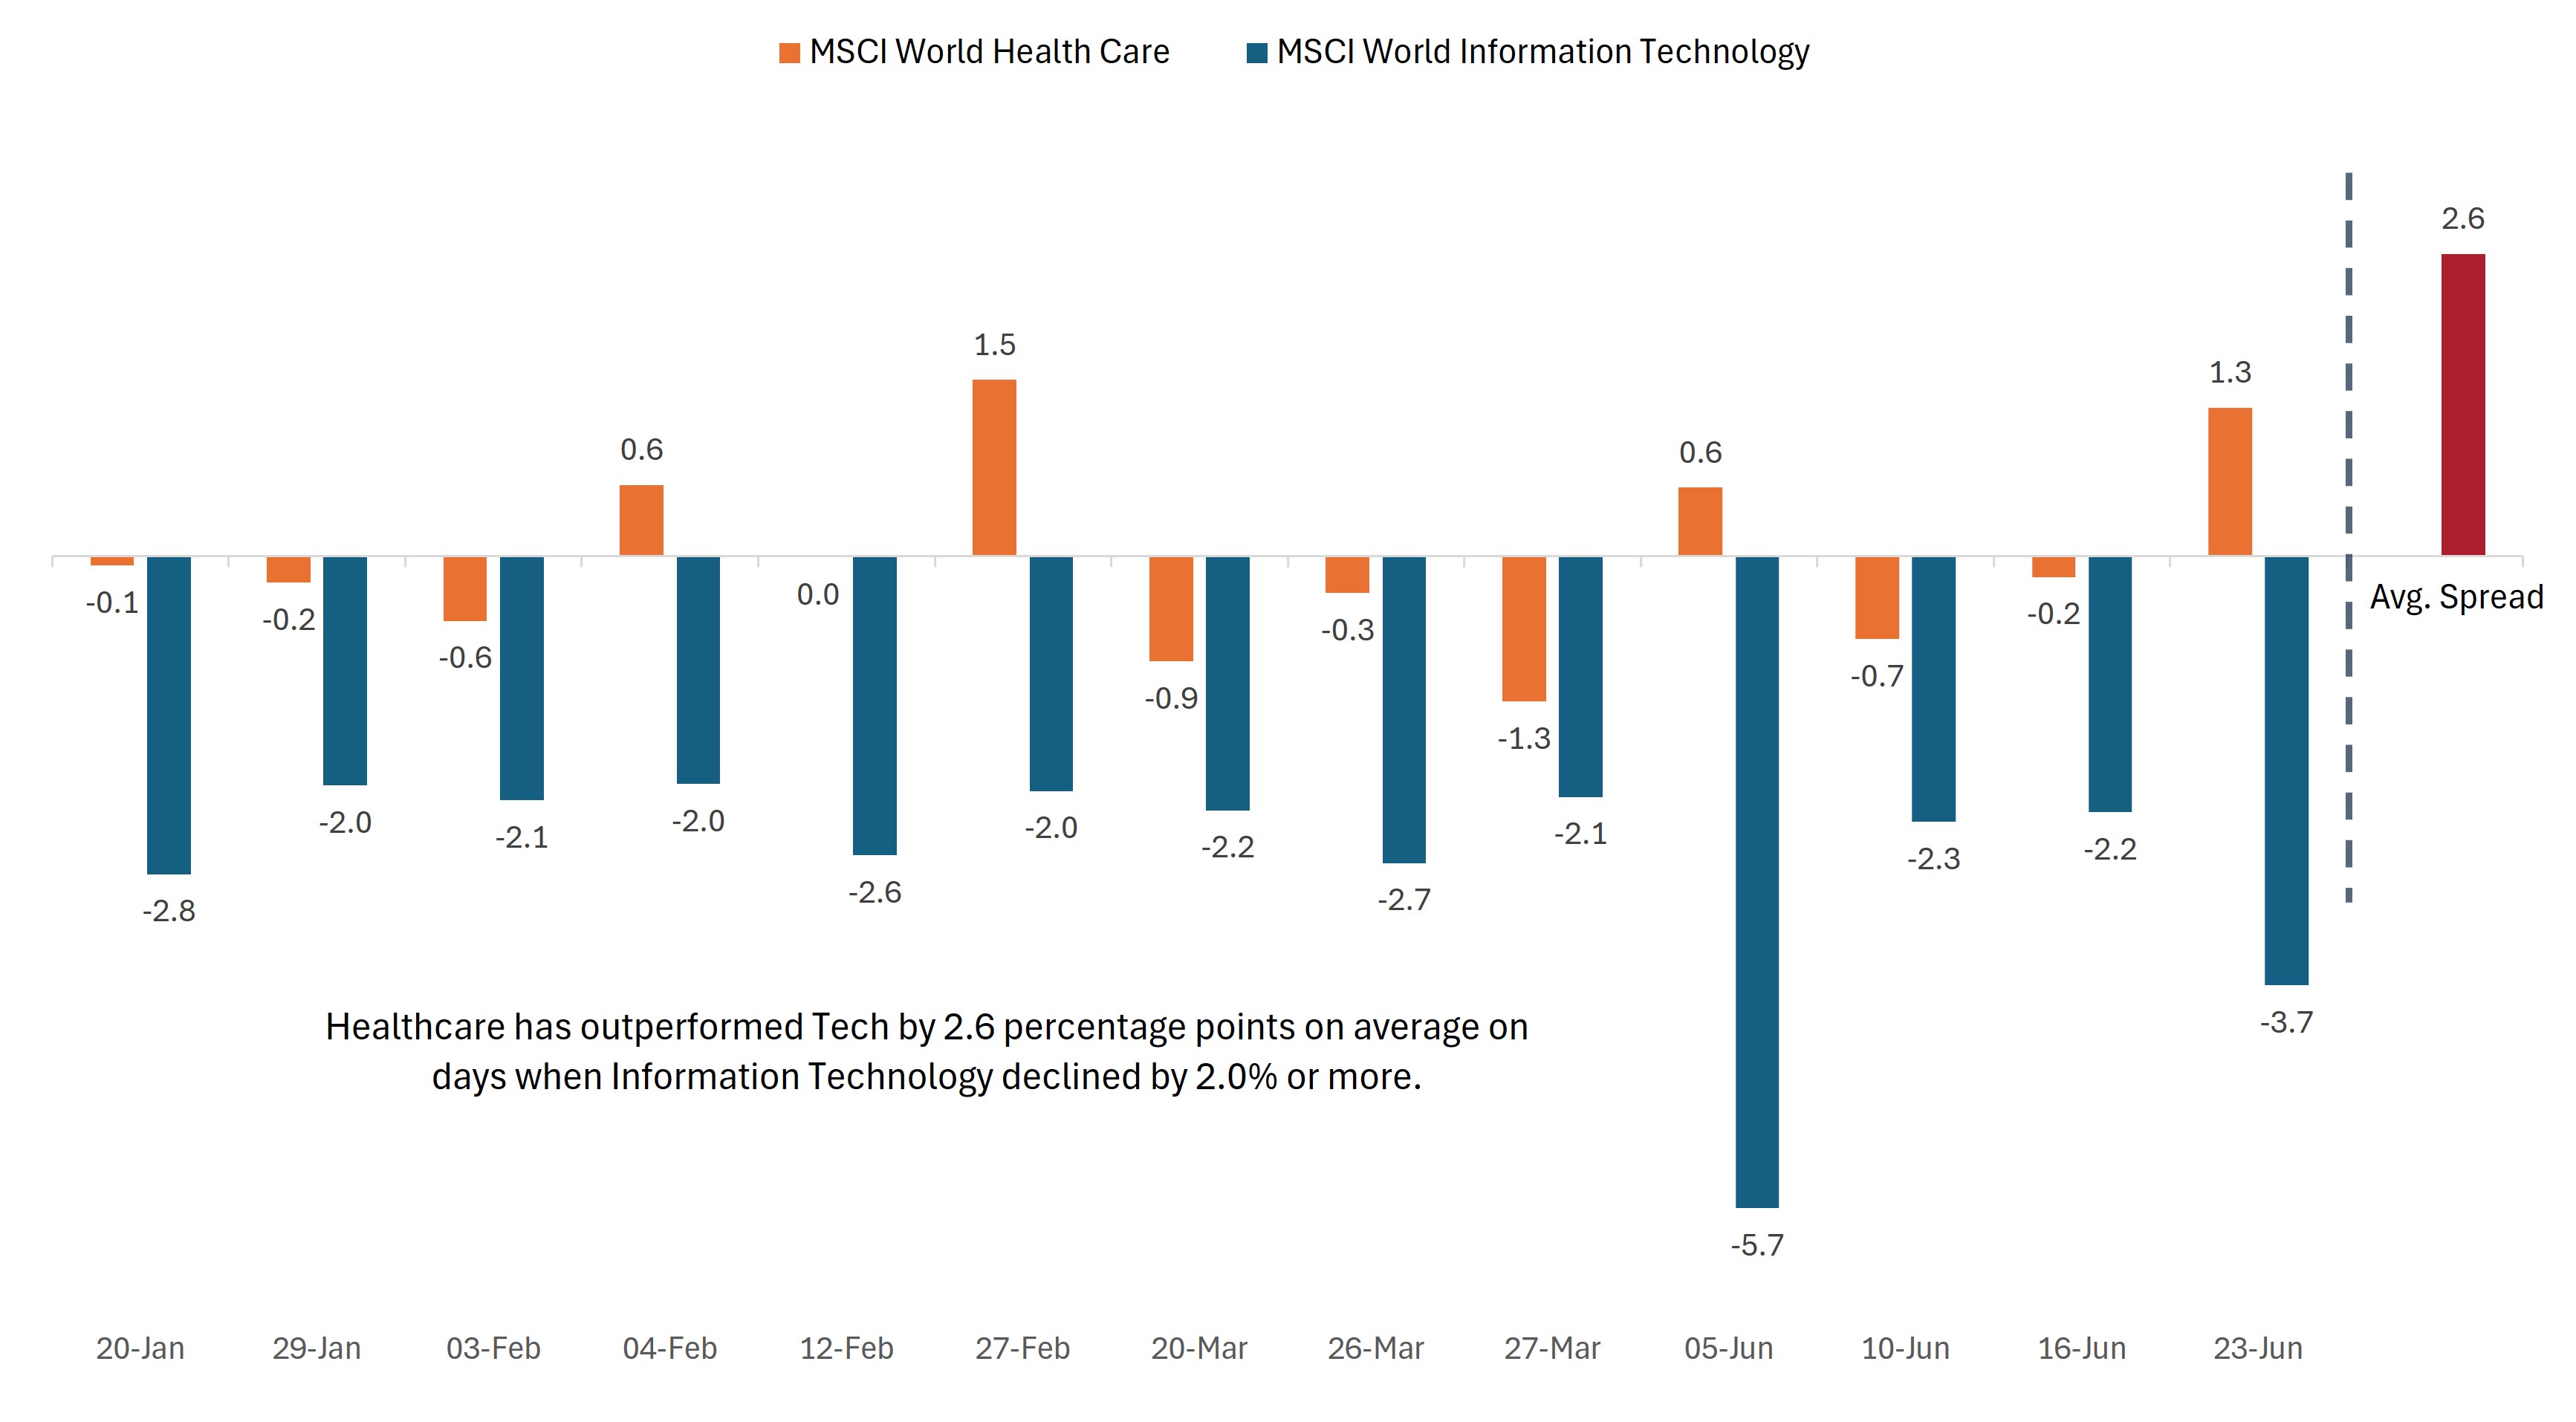
Source: Bloomberg. Data from 1 January 2026 to 30 June 2026. Past performance does not predict future results.
Beyond near-term market dynamics, longer-term secular trends continue to shape opportunities across the healthcare landscape. In this mid-year checkup, we highlight several areas we find particularly compelling.
Biotech: Ongoing innovation and M&A momentum
After rallying in the second half of 2025 for an annual gain of roughly 36%, the S&P® Biotechnology Select Industry Index has continued that strong performance in 2026, up roughly 30% on the year as of this writing.1 This comes despite a higher interest rate environment than most expected at the start of the year (higher rates typically being a headwind for longer-duration assets such as development-stage biotech firms).
Clinical progress and sustained deal activity have underpinned the sector’s resilience. Small- and mid-cap biotech companies continue to play a central role in advancing new therapies across the biopharmaceutical industry. A steady cadence of high-profile clinical data readouts and pipeline advancements has reinforced this view, with progress in historically hard-to-treat conditions such as pancreatic cancer underscoring the sector’s ability to deliver medical breakthroughs that could potentially change the practice of medicine.
Meanwhile, biotech merger and acquisition (M&A) activity has picked up meaningfully, building on the strong momentum seen at the end of last year. To this point, there have been at least seven deals valued at $5 billion or more in 2026, already matching last year’s total.2 But what stands out more is the breadth of activity, with over 30 transactions worth more than $1 billion announced so far in 2026 across the global biopharma landscape – more than observed over all of last year.3
With big pharma flush with cash and under pressure to replace hundreds of billions of dollars in drug revenues that will lose patent protection in the coming years, we believe the strong pace of M&A could continue.
Diversified pharmaceuticals: Fundamentals back in focus
Large pharmaceutical companies enter the second half of 2026 in a much better environment than the one they faced at this time last year. Key overhangs from tariff uncertainty and U.S. drug pricing policy risks have largely receded, allowing investors to refocus on fundamentals. And despite ongoing leadership turnover at the Food and Drug Administration (FDA), drug approvals have continued at a healthy pace with early signs of greater regulatory flexibility.
Against this backdrop, attention has increasingly shifted toward pipeline execution and the durability of future growth drivers. The GLP-1 market is also entering its next phase of growth, likely to be defined by broader access, new formulations, and expanding use cases beyond diabetes and obesity. Policy initiatives such as the upcoming Medicare Bridge Program, set to begin in July, could further expand access by improving affordability and coverage for eligible patients.
Beyond GLP-1s, large pharmaceutical firms are continuing to diversify their growth profiles across therapeutic areas such as oncology, immunology, and rare disease. Eli Lilly, for example, has pursued a series of transactions across oncology, vaccines, and cell therapy, while peers including Gilead, GSK, and AbbVie have similarly pursued bolt-on acquisitions to bolster growth opportunities across next-generation modalities and targeted therapeutics.
At the same time, companies are advancing a broad slate of late-stage assets, with execution on these pipelines likely to play a key role in shaping the next phase of growth.
Managed care: Insurers regaining their footing
After a challenging stretch in which managed care stocks meaningfully underperformed the broader healthcare sector in 2025 and through the first quarter of this year, health insurers have staged an impressive recovery of late. The group, as represented by the S&P 1500 Managed Health Care sub-industry, has risen more than 50% since the end of March.4
In mid-April, we discussed what we believed to be an improved setup for managed care following the Centers for Medicare & Medicaid Services’ (CMS) final rate decision for Medicare Advantage, which marked an important clearing event for the subsector. Greater visibility around federal reimbursement, combined with actions taken by insurers to reprice plans and adjust benefit offerings for 2026, has helped stabilize expectations for earnings and margins.
The sharp rebound highlights how quickly sentiment can shift once signs of stabilization emerge, particularly when valuations have become historically depressed.
Medtech and life science tools: Innovation at a discount
Medical device makers and life science tools companies have been among the weaker performers within healthcare in 2026, with both groups facing a combination of cyclical and policy-driven headwinds. Concerns around healthcare utilization have weighed on sentiment, particularly given the impact of coverage losses tied to Medicaid enrollment declines and reduced participation in Affordable Care Act (ACA) exchanges.
Medtech has also been pressured by disappointing earnings and guidance from sector bellwethers, amplifying concerns around near-term procedure volumes and contributing to a broader reset in valuations. Notably, these stocks have historically traded at a premium to the broader market – in part due to their attractive growth profile and relatively durable, recurring revenues tied to R&D activity and installed device bases – but have recently traded at a discount for the first time in over a decade.
Exhibit 3: Medtech trading at lowest relative valuation in over 15 years
Relative price to earnings (P/E) ratio of medtech stocks to the MSCI World Index
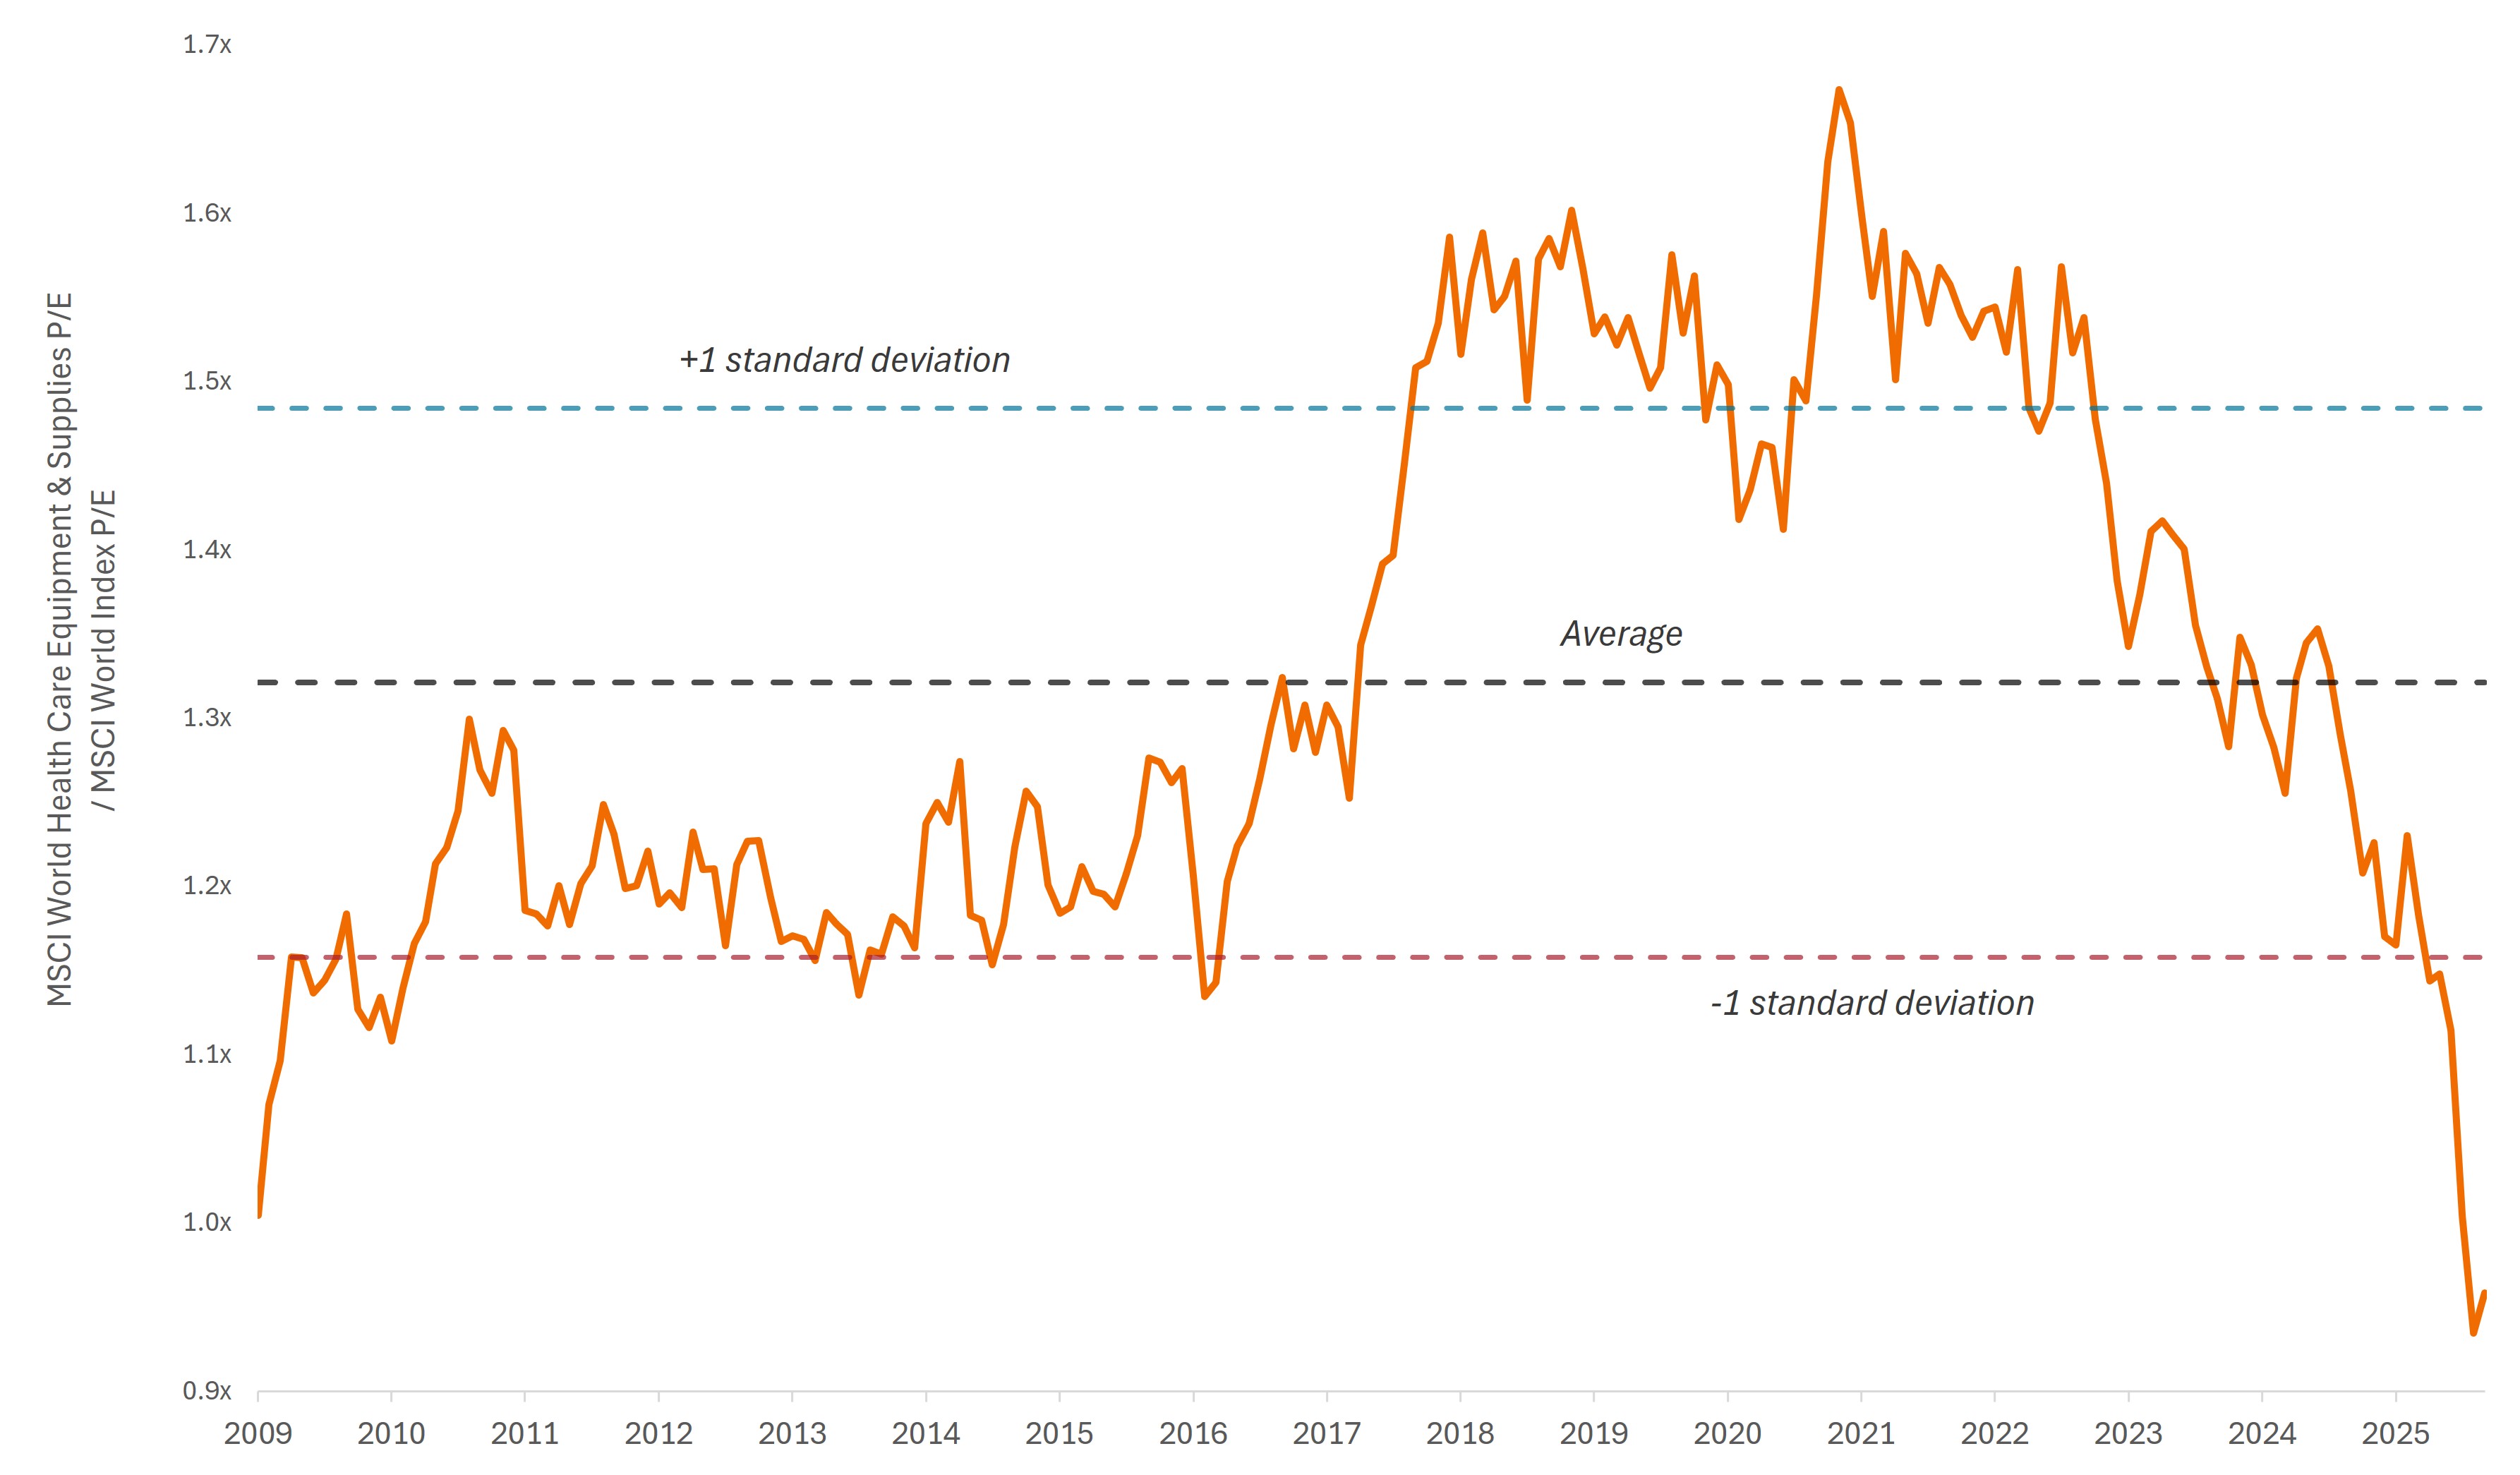
Source: Bloomberg. Data from 31 October 2009 to 30 June 2026. Represents the MSCI World Health Care Equipment & Supplies Industry P/E relative to the MSCI World Index P/E. Past performance does not predict future results.
Moreover, we believe recent coverage-related headwinds appear concentrated in 2026 and may represent a front-loaded adjustment rather than a structural shift in long-term utilization trends. Longer term, aging demographics and ongoing innovation in areas such as cardiovascular disease, robotics, and diagnostics continue to support demand, with sustained investment in pharma and biotech pipelines providing an additional tailwind for life science tools.
While the precise timing of a turnaround is impossible to pinpoint, we believe the sharp pullback across these subsectors has created a more compelling valuation backdrop for patient investors. As seen with managed care, periods of uncertainty can lead to valuation dislocations, which have historically provided buying opportunities with the potential to reverse quickly as underlying trends stabilize.
Taken together, we believe this mid-year checkup points to a healthcare sector in better shape than year-to-date performance alone might suggest. Continued innovation across biopharma, improving visibility in managed care, and more compelling valuations in medtech all support a constructive outlook for the second half of the year.
1 Source, Bloomberg, as of 30 June 2026.
2 Source: Bloomberg, as of 30 June 2026.
3 Source: STAT, “Pharma goes on a spending spree, snapping up biotechs in a hurry”, 22 June 2026.
4 Source: Bloomberg, data from 31 March 2026 to 30 June 2026.
Correlation measures the degree to which two variables move in relation to each other. A value of 1.0 implies movement in parallel, -1.0 implies movement in opposite directions, and 0.0 implies no relationship.
Duration measures a bond price’s sensitivity to changes in interest rates. The longer a bond’s duration, the higher its sensitivity to changes in interest rates and vice versa.
MSCI World Index℠ reflects the equity market performance of global developed markets.
MSCI World Health Care Index℠ reflects the performance of health care stocks from global developed markets.
MSCI World Information Technology Index℠ reflects the performance of information technology stocks from global developed markets.
MSCI World Health Care Equipment & Supplies Industry comprises stocks included in the MSCI World Health Care Index classified in the Equipment & Supplies Industry (within the Health Care sector) as per the Global Industry Classification Standard (GICS®).
Price-to-Earnings (P/E) Ratio measures share price compared to earnings per share for a stock or stocks in a portfolio.
S&P 500® Index reflects U.S. large-cap equity performance and represents broad U.S. equity market performance.
S&P 1500® Index combines three indices, the S&P 500®, the S&P MidCap 400®, and the S&P SmallCap 600®, to cover approximately 90% of U.S. market capitalization.
S&P® Biotechnology Select Industry Index represents the biotechnology sub-industry portion of the S&P Total Markets Index. The S&P TMI tracks all the U.S. common stocks listed on the NYSE, AMEX, NASDAQ National Market and NASDAQ Small Cap exchanges. The Biotech Index is an equal weighted market cap index.
S&P® 1500 Managed Health Care sub-industry comprises stocks included in the S&P 1500 Index classified in the Managed Health Care sub-industry as per the Global Industry Classification Standard (GICS).
Volatility measures risk using the dispersion of returns for a given investment.
IMPORTANT INFORMATION
Diversification neither assures a profit nor eliminates the risk of experiencing investment losses.
Equity securities are subject to risks including market risk. Returns will fluctuate in response to issuer, political and economic developments.
Health care industries are subject to government regulation and reimbursement rates, as well as government approval of products and services, which could have a significant effect on price and availability, and can be significantly affected by rapid obsolescence and patent expirations.
Technology industries can be significantly affected by obsolescence of existing technology, short product cycles, falling prices and profits, competition from new market entrants, and general economic conditions. A concentrated investment in a single industry could be more volatile than the performance of less concentrated investments and the market as a whole.
Queste sono le opinioni dell'autore al momento della pubblicazione e possono differire da quelle di altri individui/team di Janus Henderson Investors. I riferimenti a singoli titoli non costituiscono una raccomandazione all'acquisto, alla vendita o alla detenzione di un titolo, di una strategia d'investimento o di un settore di mercato e non devono essere considerati redditizi. Janus Henderson Investors, le sue affiliate o i suoi dipendenti possono avere un’esposizione nei titoli citati.
Le performance passate non sono indicative dei rendimenti futuri. Tutti i dati dei rendimenti includono sia il reddito che le plusvalenze o le eventuali perdite ma sono al lordo dei costi delle commissioni dovuti al momento dell'emissione.
Le informazioni contenute in questo articolo non devono essere intese come una guida all'investimento.
Non vi è alcuna garanzia che le tendenze passate continuino o che le previsioni si realizzino.
Comunicazione di Marketing.
Important information
Please read the following important information regarding funds related to this article.
- Le Azioni possono perdere valore rapidamente e normalmente implicano rischi più elevati rispetto alle obbligazioni o agli strumenti del mercato monetario. Di conseguenza il valore del proprio investimento potrebbe diminuire.
- Le azioni di società a piccola e media capitalizzazione possono presentare una maggiore volatilità rispetto a quelle di società più ampie e talvolta può essere difficile valutare o vendere tali azioni al momento e al prezzo desiderati, il che aumenta il rischio di perdite.
- Un’esposizione elevata a un determinato paese o a una specifica regione geografica comporta un livello di rischio più elevato rispetto a un Fondo più ampiamente diversificato.
- Il Fondo si concentra su determinati settori o temi d’investimento e potrebbe risentire pesantemente di fattori quali eventuali variazioni ai regolamenti governativi, una maggiore competizione nei prezzi, progressi tecnologici ed altri eventi negativi.
- Qualora il Fondo detenga attività in valute diverse da quella di base del Fondo, o l’investitore detenga azioni/quote di una valuta diversa da quella del Fondo (a meno che non sia coperta, ovvero cerchi di mitigare i movimenti del tasso di cambio tra la valuta della classe di azioni/quote e la valuta di base del Fondo), il valore dell’investimento potrebbe subire le oscillazioni del tasso di cambio.
- I derivati possono essere utilizzati per aiutare a raggiungere l’obiettivo di investimento. Ciò potrebbe determinare una “leva” (livelli più elevati di debito), che potrebbe amplificare i risultati dell’investimento Le perdite o i guadagni potrebbero superare il costo del derivato. I derivati comportano rischi aggiuntivi, in particolare il rischio che la controparte del derivato non adempia ai suoi obblighi contrattuali.
- Se il Fondo, o una sua classe di azioni con copertura, intende attenuare le fluttuazioni del tasso di cambio tra una valuta e la valuta di base, la stessa strategia di copertura potrebbe generare un effetto positivo o negativo sul valore del Fondo, a causa delle differenze di tasso d’interesse a breve termine tra le due valute.
- I titoli potrebbero diventare difficili da valutare o da vendere nel momento e al prezzo desiderati, specialmente in condizioni di mercato estreme caratterizzate da una discesa dei prezzi delle attività, con conseguente incremento del rischio di perdite sull’investimento.
- Potrebbero verificarsi perdite qualora una controparte non intendesse più o non fosse più in grado di adempiere ai propri obblighi, o a causa di un errore o di un ritardo nei processi operativi o di una negligenza di un fornitore terzo.
Specific risks
- Le Azioni possono perdere valore rapidamente e normalmente implicano rischi più elevati rispetto alle obbligazioni o agli strumenti del mercato monetario. Di conseguenza il valore del proprio investimento potrebbe diminuire.
- Le azioni di società a piccola e media capitalizzazione possono presentare una maggiore volatilità rispetto a quelle di società più ampie e talvolta può essere difficile valutare o vendere tali azioni al momento e al prezzo desiderati, il che aumenta il rischio di perdite.
- Un’esposizione elevata a un determinato paese o a una specifica regione geografica comporta un livello di rischio più elevato rispetto a un Fondo più ampiamente diversificato.
- Il Fondo si concentra su determinati settori o temi d’investimento e potrebbe risentire pesantemente di fattori quali eventuali variazioni ai regolamenti governativi, una maggiore competizione nei prezzi, progressi tecnologici ed altri eventi negativi.
- Qualora il Fondo detenga attività in valute diverse da quella di base del Fondo, o l’investitore detenga azioni/quote di una valuta diversa da quella del Fondo (a meno che non sia coperta, ovvero cerchi di mitigare i movimenti del tasso di cambio tra la valuta della classe di azioni/quote e la valuta di base del Fondo), il valore dell’investimento potrebbe subire le oscillazioni del tasso di cambio.
- I derivati possono essere utilizzati per aiutare a raggiungere l’obiettivo di investimento. Ciò potrebbe determinare una “leva” (livelli più elevati di debito), che potrebbe amplificare i risultati dell’investimento Le perdite o i guadagni potrebbero superare il costo del derivato. I derivati comportano rischi aggiuntivi, in particolare il rischio che la controparte del derivato non adempia ai suoi obblighi contrattuali.
- Se il Fondo, o una sua classe di azioni con copertura, intende attenuare le fluttuazioni del tasso di cambio tra una valuta e la valuta di base, la stessa strategia di copertura potrebbe generare un effetto positivo o negativo sul valore del Fondo, a causa delle differenze di tasso d’interesse a breve termine tra le due valute.
- I titoli potrebbero diventare difficili da valutare o da vendere nel momento e al prezzo desiderati, specialmente in condizioni di mercato estreme caratterizzate da una discesa dei prezzi delle attività, con conseguente incremento del rischio di perdite sull’investimento.
- Il Fondo può sostenere un livello di costi di operazione più elevato per effetto dell’investimento su mercati caratterizzati da una minore attività di contrattazione o meno sviluppati rispetto a un fondo che investa su mercati più attivi/sviluppati.
- Potrebbero verificarsi perdite qualora una controparte non intendesse più o non fosse più in grado di adempiere ai propri obblighi, o a causa di un errore o di un ritardo nei processi operativi o di una negligenza di un fornitore terzo.