
Key takeaways:
- All major fixed income sectors recorded strong gains in 2025, driven by a rally in Treasury yields and credit spreads on the back of continued economic growth, the resumption of the Fed’s rate-cutting cycle, and attractive starting yields at the beginning of 2025.
- We believe it is important to maximize income per unit of risk and limit drawdown risks in the present environment. In our view, investors will be rewarded by picking individual bonds with positively skewed risk-return expectations, as opposed to making macro bets.
- The currently resilient economy, AI-driven investment, the positive impact of the recent rate cuts, and the possibility of more cuts in the future create a favorable backdrop for fixed income in 2026, in our view, and active, diversified strategies focused on carry and risk-adjusted returns remain essential.
2025 in review
Amid a year of chaos surrounding the incoming Trump administration’s approach to trade policy, monetary policy, immigration, and its stance toward the Federal Reserve (Fed), 2025 turned out to be an exceptional year for fixed income.
As shown in Exhibit 1, all major fixed income sectors recorded strong total returns, driven by a rally in yields and credit spreads on the back of continued economic growth, the resumption of the Fed’s rate-cutting cycle, and attractive starting yields at the beginning of 2025.
All U.S. fixed income spread sectors outperformed comparable maturity Treasuries, benefiting from their extra carry, or income. Meaningful spread compression further helped in sectors such as agency mortgage-backed securities (MBS) and sub-investment grade corporate bonds.
Relatively tight corporate spreads by historical standards were not a barrier to outperformance, as these sectors were supported by strong fundamentals and favorable demand technicals. U.S. dollar-denominated emerging markets (EM) debt benefited from attractive starting valuations, relatively robust economic performance, and strong supply/demand dynamics.
Exhibit 1: U.S. fixed income sector returns (2025)
Bonds across the board provided strong total returns.
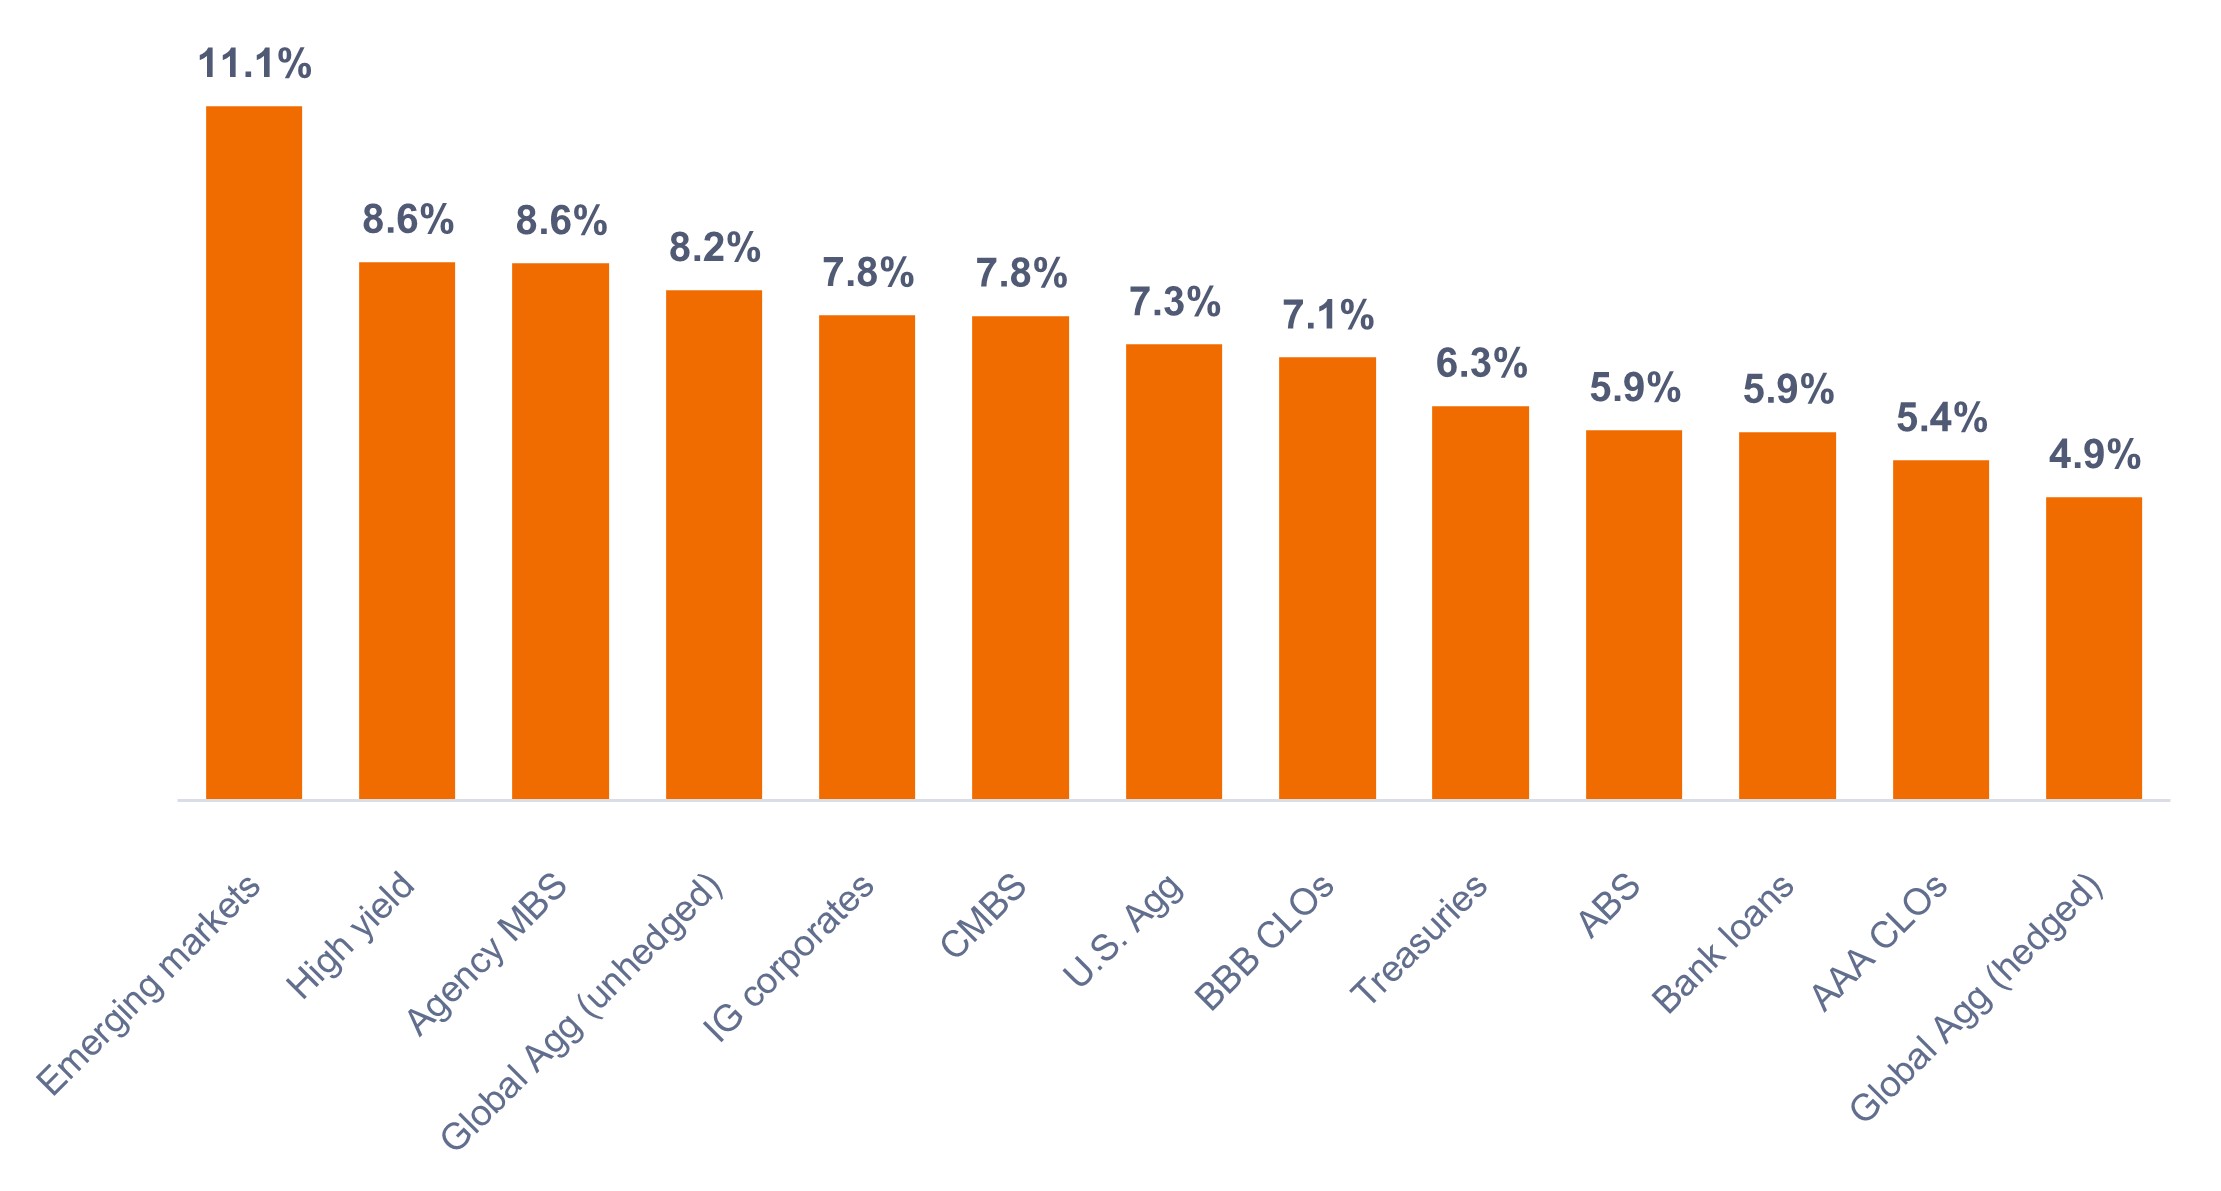
Source: Bloomberg, as of 31 December 2025. Indices used to represent asset classes as per footnote.1 Past performance does not predict future returns.
Looking ahead to 2026
We are constructive on the outlook for 2026, albeit with a focus on earning carry rather than pursuing significant spread compression, given starting spread levels.
In our view, active managers may add value in the present environment by way of enhanced sector-level diversification, as well as striking the right balance of yield and duration. Additionally, we believe it is important to tilt toward sectors that have historically generated stronger risk-adjusted excess returns over time, such as BB-rated corporates, securitized credit, emerging markets, and front-end corporates.
Furthermore, we believe investors will be rewarded by clipping attractive coupons and picking individual bonds with positively skewed risk-return expectations, as opposed to making macro bets.
U.S. economic growth is expected to remain positive, with real GDP projected at over 2.0% in 2026. While some sectors exhibit late-cycle characteristics, resilient consumer spending – supported by tax cuts under the One Big Beautiful Bill Act (OBBBA) – and corporate profitability bolstered by artificial intelligence (AI) adoption should sustain economic momentum. Significant AI-driven investments in chips and data centers are anticipated to further fuel growth. AI-driven productivity gains could help reduce inflation, though it also could result in reduced labor demand.
We think the inflationary impact of tariffs on the year-over-year inflation statistics is generally expected to dissipate over the second half of 2026. While the disinflationary progress in energy and housing will continue, overall inflation is likely to remain above the Fed’s 2% target through the end of 2026.
Given our positive view on economic growth, we are modestly bearish on interest rate risk, as policy rates and rates farther out on the curve might stay higher than expected. That said, we prefer the front end of the yield curve versus longer maturities because we consider the front end to be a better hedge if the economy falters, as the Fed has ample room to cut rates. There is also the possibility that the new Fed leadership may try to push rates lower despite a strong economy. If this were to happen, we would expect term premiums to rise, resulting in further curve steepening.
Key themes we are focused on in 2026 include our bullishness on credit-spread carry amid robust credit fundamentals and expected continued economic growth. In addition, the Fed’s decision to start growing its balance sheet again should help provide more liquidity, which supports our positive view on credit-spread sectors. Furthermore, real yields remain above 1% and offer inflation-adjusted return potential.
Finally, attractive valuations and strong credit quality within securitized assets relative to corporates support our constructive approach to securitized sectors. Securitized credit sectors look attractive to us both structurally, because they increase diversification and have generally provided good excess carry per unit of excess return volatility, and tactically, because their spreads are attractive on a relative basis.
We believe the currently resilient economy, AI-driven investment, the positive impact of recent rate cuts, and the possibility of more cuts in the future create a favorable backdrop for fixed income in 2026. Active, diversified strategies focused on carry and risk-adjusted returns remain essential, in our view.
1 Emerging markets = Bloomberg Emerging Markets USD Aggregate Index, High yield = Bloomberg Corporate High Yield Bond Index, Agency MBS = Bloomberg U.S. Mortgage Backed Securities Index, Global Agg = Bloomberg Global Aggregate Bond Index, IG corporates = Bloomberg U.S. Corporate Bond Index, CMBS = Bloomberg Commercial Mortgage Backed Securities Investment Grade Index, U.S. Agg = U.S. Aggregate Bond Index, BBB CLOs = JP Morgan BBB CLO Index, Treasuries = Bloomberg U.S. Treasuries Index, ABS = Bloomberg Aggregate Asset Backed Securities Index, AAA CLOs = JP Morgan AAA CLO Index, Bank loans = Morningstar LSTA Leveraged Loan Index.
Carry is the excess income earned from holding a higher yielding security relative to another.
Credit Spread is the difference in yield between securities with similar maturity but different credit quality. Widening spreads generally indicate deteriorating creditworthiness of corporate borrowers, and narrowing indicate improving.
Duration measures a bond price’s sensitivity to changes in interest rates. The longer a bond’s duration, the higher its sensitivity to changes in interest rates and vice versa.
Monetary Policy refers to the policies of a central bank, aimed at influencing the level of inflation and growth in an economy. It includes controlling interest rates and the supply of money.
Quantitative easing (QE) is the introduction of new money into the money supply by a central bank purchasing public or private securities using funds created on its balance sheet for this purpose.
Quantitative tightening (QT) is a contractionary monetary policy tool applied by central banks to decrease the amount of liquidity or money supply in the economy.
Real yields are the return on an investment after accounting for the loss of purchasing power due to inflation.
Risk assets: Financial securities that may be subject to significant price movements (ie. carrying a greater degree of risk). Examples include equities, commodities, property lower-quality bonds or some currencies.
U.S. Treasury securities are direct debt obligations issued by the U.S. Government. With government bonds, the investor is a creditor of the government. Treasury Bills and U.S. Government Bonds are guaranteed by the full faith and credit of the United States government, are generally considered to be free of credit risk and typically carry lower yields than other securities.
Volatility measures risk using the dispersion of returns for a given investment.
The yield curve is a graph that plots the yields of U.S. government bonds with different maturities at a single point in time. It is used to visualize the relationship between the interest rates (yields) and the time until the bonds mature, providing insights into economic expectations.
IMPORTANT INFORMATION
Actively managed investment portfolios are subject to the risk that the investment strategies and research process employed may fail to produce the intended results. Accordingly, a portfolio may underperform its benchmark index or other investment products with similar investment objectives.
Derivatives can be more volatile and sensitive to economic or market changes than other investments, which could result in losses exceeding the original investment and magnified by leverage.
Diversification neither assures a profit nor eliminates the risk of experiencing investment losses.
Fixed income securities are subject to interest rate, inflation, credit and default risk. The bond market is volatile. As interest rates rise, bond prices usually fall, and vice versa. The return of principal is not guaranteed, and prices may decline if an issuer fails to make timely payments or its credit strength weakens.
Securitized products, such as mortgage- and asset-backed securities, are more sensitive to interest rate changes, have extension and prepayment risk, and are subject to more credit, valuation and liquidity risk than other fixed-income securities.
Queste sono le opinioni dell'autore al momento della pubblicazione e possono differire da quelle di altri individui/team di Janus Henderson Investors. I riferimenti a singoli titoli non costituiscono una raccomandazione all'acquisto, alla vendita o alla detenzione di un titolo, di una strategia d'investimento o di un settore di mercato e non devono essere considerati redditizi. Janus Henderson Investors, le sue affiliate o i suoi dipendenti possono avere un’esposizione nei titoli citati.
Le performance passate non sono indicative dei rendimenti futuri. Tutti i dati dei rendimenti includono sia il reddito che le plusvalenze o le eventuali perdite ma sono al lordo dei costi delle commissioni dovuti al momento dell'emissione.
Le informazioni contenute in questo articolo non devono essere intese come una guida all'investimento.
Non vi è alcuna garanzia che le tendenze passate continuino o che le previsioni si realizzino.
Comunicazione di Marketing.
Important information
Please read the following important information regarding funds related to this article.
- Le Azioni/Quote possono perdere valore rapidamente e di norma implicano rischi più elevati rispetto alle obbligazioni o agli strumenti del mercato monetario. Di conseguenza il valore del proprio investimento potrebbe diminuire.
- Gli emittenti di obbligazioni (o di strumenti del mercato monetario) potrebbero non essere più in grado di pagare gli interessi o rimborsare il capitale, ovvero potrebbero non intendere più farlo. In tal caso, o qualora il mercato ritenga che ciò sia possibile, il valore dell'obbligazione scenderebbe.
- L’aumento (o la diminuzione) dei tassi d’interesse può influire in modo diverso su titoli diversi. Nello specifico, i valori delle obbligazioni si riducono di norma con l'aumentare dei tassi d'interesse. Questo rischio risulta di norma più significativo quando la scadenza di un investimento obbligazionario è a più lungo termine.
- Il Fondo investe in obbligazioni ad alto rendimento (non investment grade) che, sebbene offrano di norma un interesse superiore a quelle investment grade, sono più speculative e più sensibili a variazioni sfavorevoli delle condizioni di mercato.
- Un Fondo che presenta un’esposizione elevata a un determinato paese o regione geografica comporta un livello maggiore di rischio rispetto a un Fondo più diversificato.
- Il Fondo potrebbe usare derivati al fine di conseguire il suo obiettivo d'investimento. Ciò potrebbe determinare una "leva", che potrebbe amplificare i risultati dell'investimento, e le perdite o i guadagni per il Fondo potrebbero superare il costo del derivato. I derivati comportano rischi aggiuntivi, in particolare il rischio che la controparte del derivato non adempia ai suoi obblighi contrattuali.
- Se il Fondo, o una sua classe di azioni con copertura, intende attenuare le fluttuazioni del tasso di cambio tra una valuta e la valuta di base, la stessa strategia di copertura potrebbe generare un effetto positivo o negativo sul valore del Fondo, a causa delle differenze di tasso d’interesse a breve termine tra le due valute.
- I titoli del Fondo potrebbero diventare difficili da valutare o da vendere al prezzo e con le tempistiche desiderati, specie in condizioni di mercato estreme con il prezzo delle attività in calo, aumentando il rischio di perdite sull'investimento.
- Le spese correnti possono essere prelevate, in tutto o in parte, dal capitale, il che potrebbe erodere il capitale o ridurne il potenziale di crescita.
- Il Fondo potrebbe perdere denaro se una controparte con la quale il Fondo effettua scambi non fosse più intenzionata ad adempiere ai propri obblighi, o a causa di un errore o di un ritardo nei processi operativi o di una negligenza di un fornitore terzo.
- Oltre al reddito, questa classe di azioni può distribuire plusvalenze di capitale realizzate e non realizzate e il capitale inizialmente investito. Sono dedotti dal capitale anche commissioni, oneri e spese. Entrambi i fattori possono comportare l’erosione del capitale e un potenziale ridotto di crescita del medesimo. Si richiama l’attenzione degli investitori anche sul fatto che le distribuzioni di tale natura possono essere trattate (e quindi imponibili) come reddito, secondo la legislazione fiscale locale.