

Key takeaways:
- Global equities delivered mixed results in July, as strength in the UK, Australia, and parts of Europe offset weakness in tech-heavy U.S. and Asian benchmarks.
- Global sovereign bonds declined as yields rose across most major markets amid ongoing government borrowing needs and persistent fiscal concerns. Corporate bonds also moved lower, with investment grade underperforming high yield as heavy issuance, including from AI-focused hyperscalers, weighed on returns.
- Markets navigated a month marked by volatility in the AI trade and a sharp pullback in many of the year’s biggest winners, alongside renewed U.S.-Iran hostilities that drove a rebound in oil prices and contributed to higher bond yields. Meanwhile, earnings growth remained robust, though strong results did not always translate into positive stock reactions amid lofty investor expectations.
Market overview
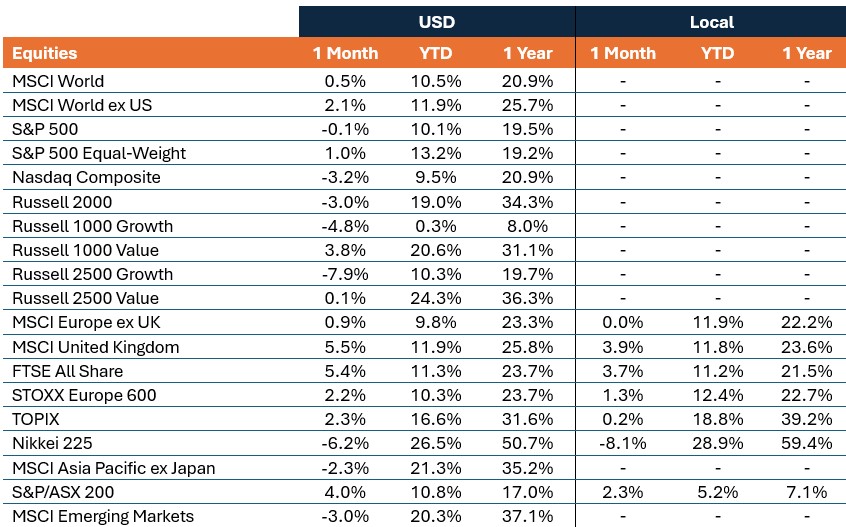
Global equities delivered mixed performance in July, with a modest gain for the MSCI World Index masking broad dispersion beneath the surface. The MSCI World Index rose 0.5% in U.S. dollar terms, while the MSCI World ex US Index advanced 2.1%, as strength in the UK, Australia, and parts of Europe offset weakness in technology-heavy U.S. and Asian benchmarks. Global government bonds declined as sovereign yields rose across major developed markets, while global corporate bonds also fell as modest spread widening weighed on returns.
Oil prices rebounded sharply as renewed U.S.-Iran hostilities revived concerns about energy supply disruptions and shipping through key Middle East corridors. WTI and Brent crude both rose more than 20%, reversing much of June’s decline. The U.S. Dollar Index fell 1.3% versus a basket of global currencies, while gold rose 1.0% after dropping more than 10% during the prior month.
UK and Australia led global equities as cyclical sectors outperformed
Weakness in AI-related chipmakers weighed on tech-heavy benchmarks.
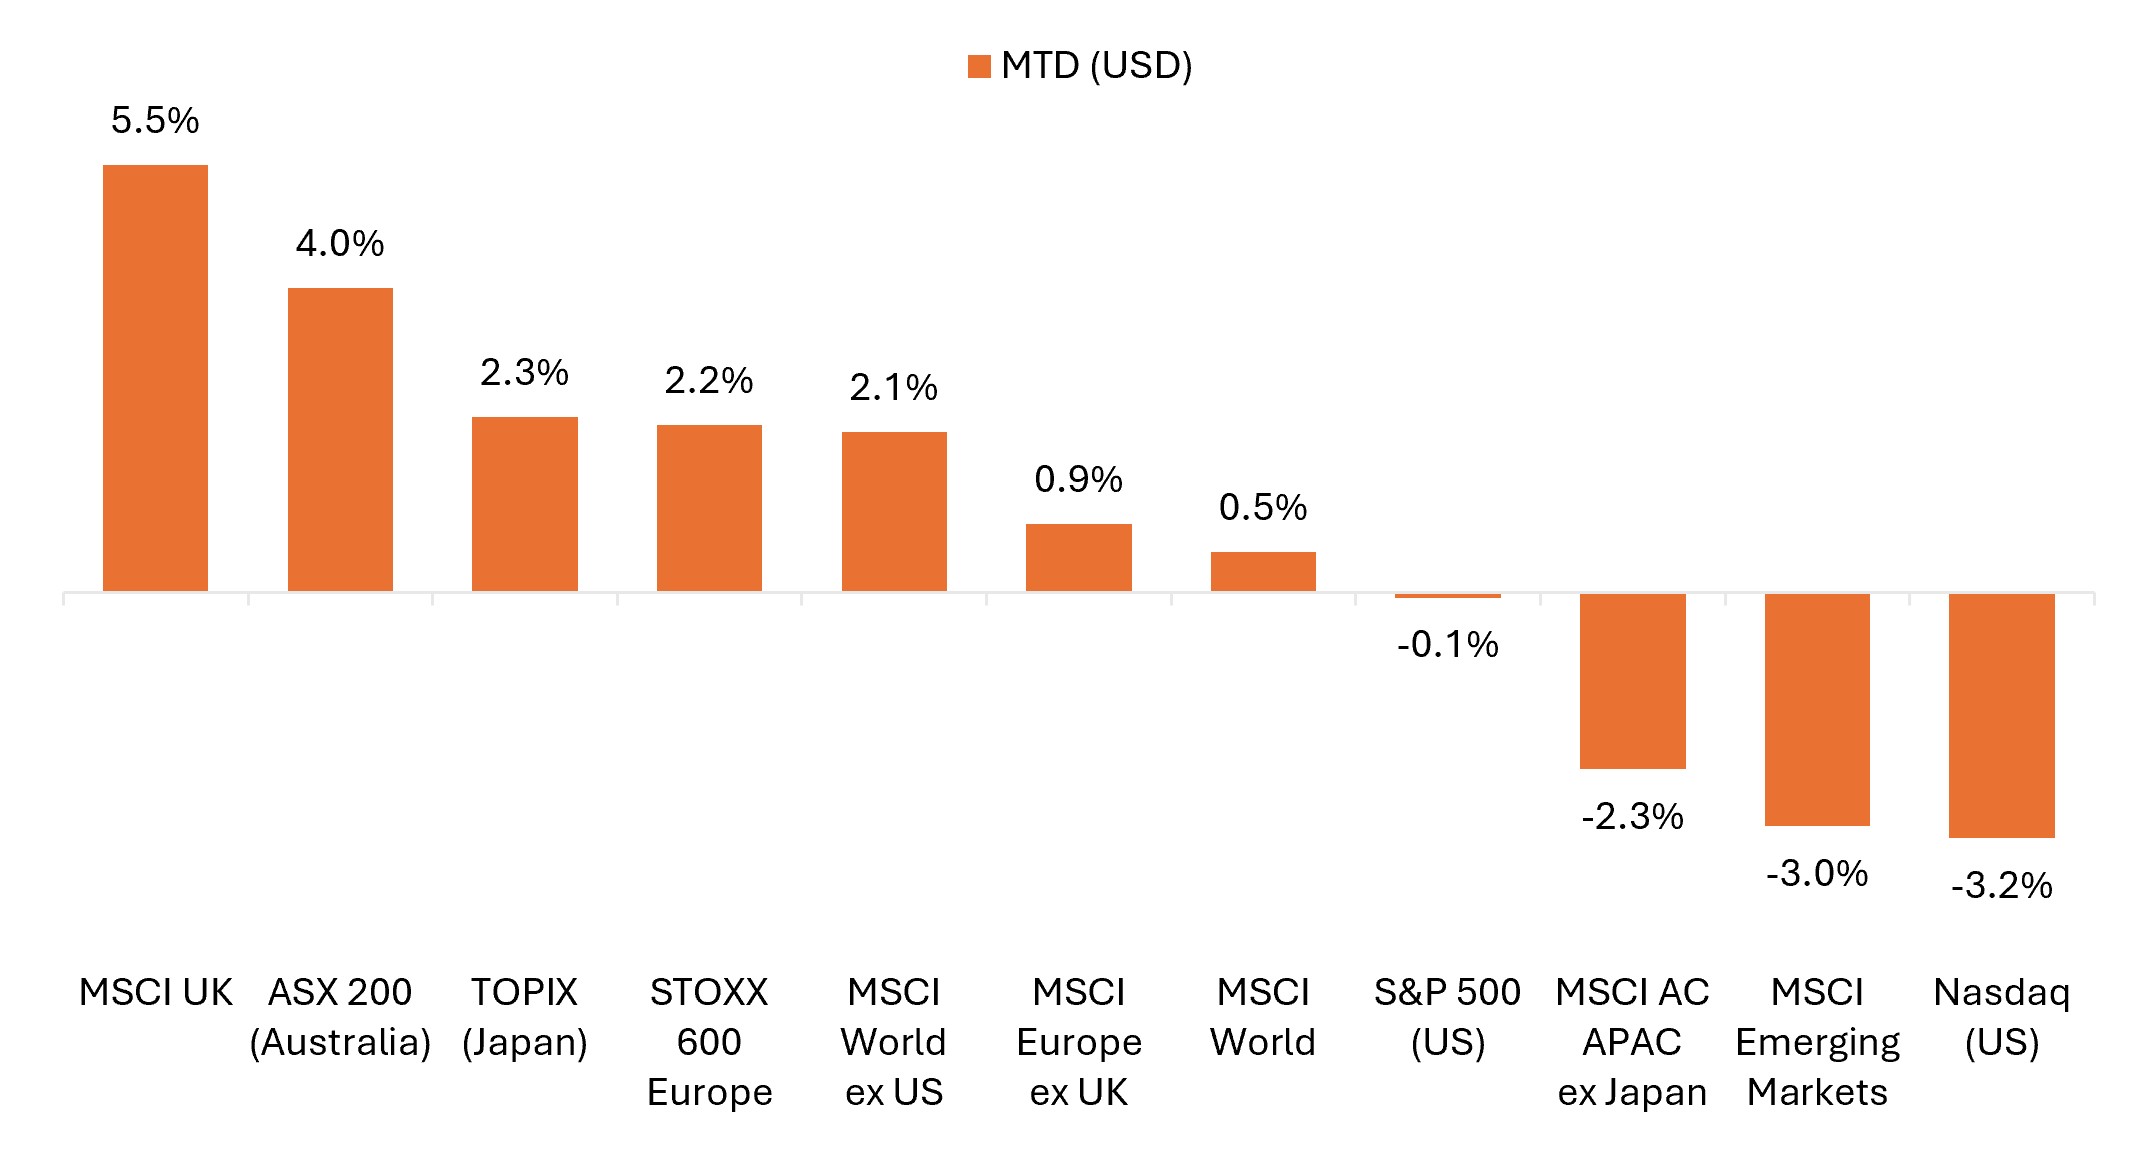
Source: Bloomberg, data from 30 June 2026 to 31 July 2026. Represents index total returns in U.S. dollar terms. Past performance is no guarantee of future results.
Key themes that mattered for markets
- Momentum unwind (and snapback), with rotation beneath the surface: July trading was marked by volatility, with chipmakers and AI-linked industrials selling off sharply before recovering some ground late in the month. The move was widely seen as a case of “flows dominating fundamentals”, with declines exacerbated by crowded positioning, deleveraging, and other technical factors. Importantly, the broader equity market proved resilient, supported by rotation into cyclical and defensive sectors as equal-weight benchmarks outperformed their market-cap weighted counterparts.
- Oil whipsawed amid a resumption of U.S.-Iran hostilities: After June’s sharp decline, crude prices surged in July as the U.S. and Iran resumed military strikes. Brent crude peaked near $100 per barrel before retreating amid hopes for a near-term de-escalation. Yet while energy stocks rallied and bond yields rose as renewed upward pressure on energy prices added to inflation concerns, equity markets shook off the geopolitical flare-up, suggesting investors viewed a return to full-scale war as relatively unlikely.
Brent crude futures (USD)
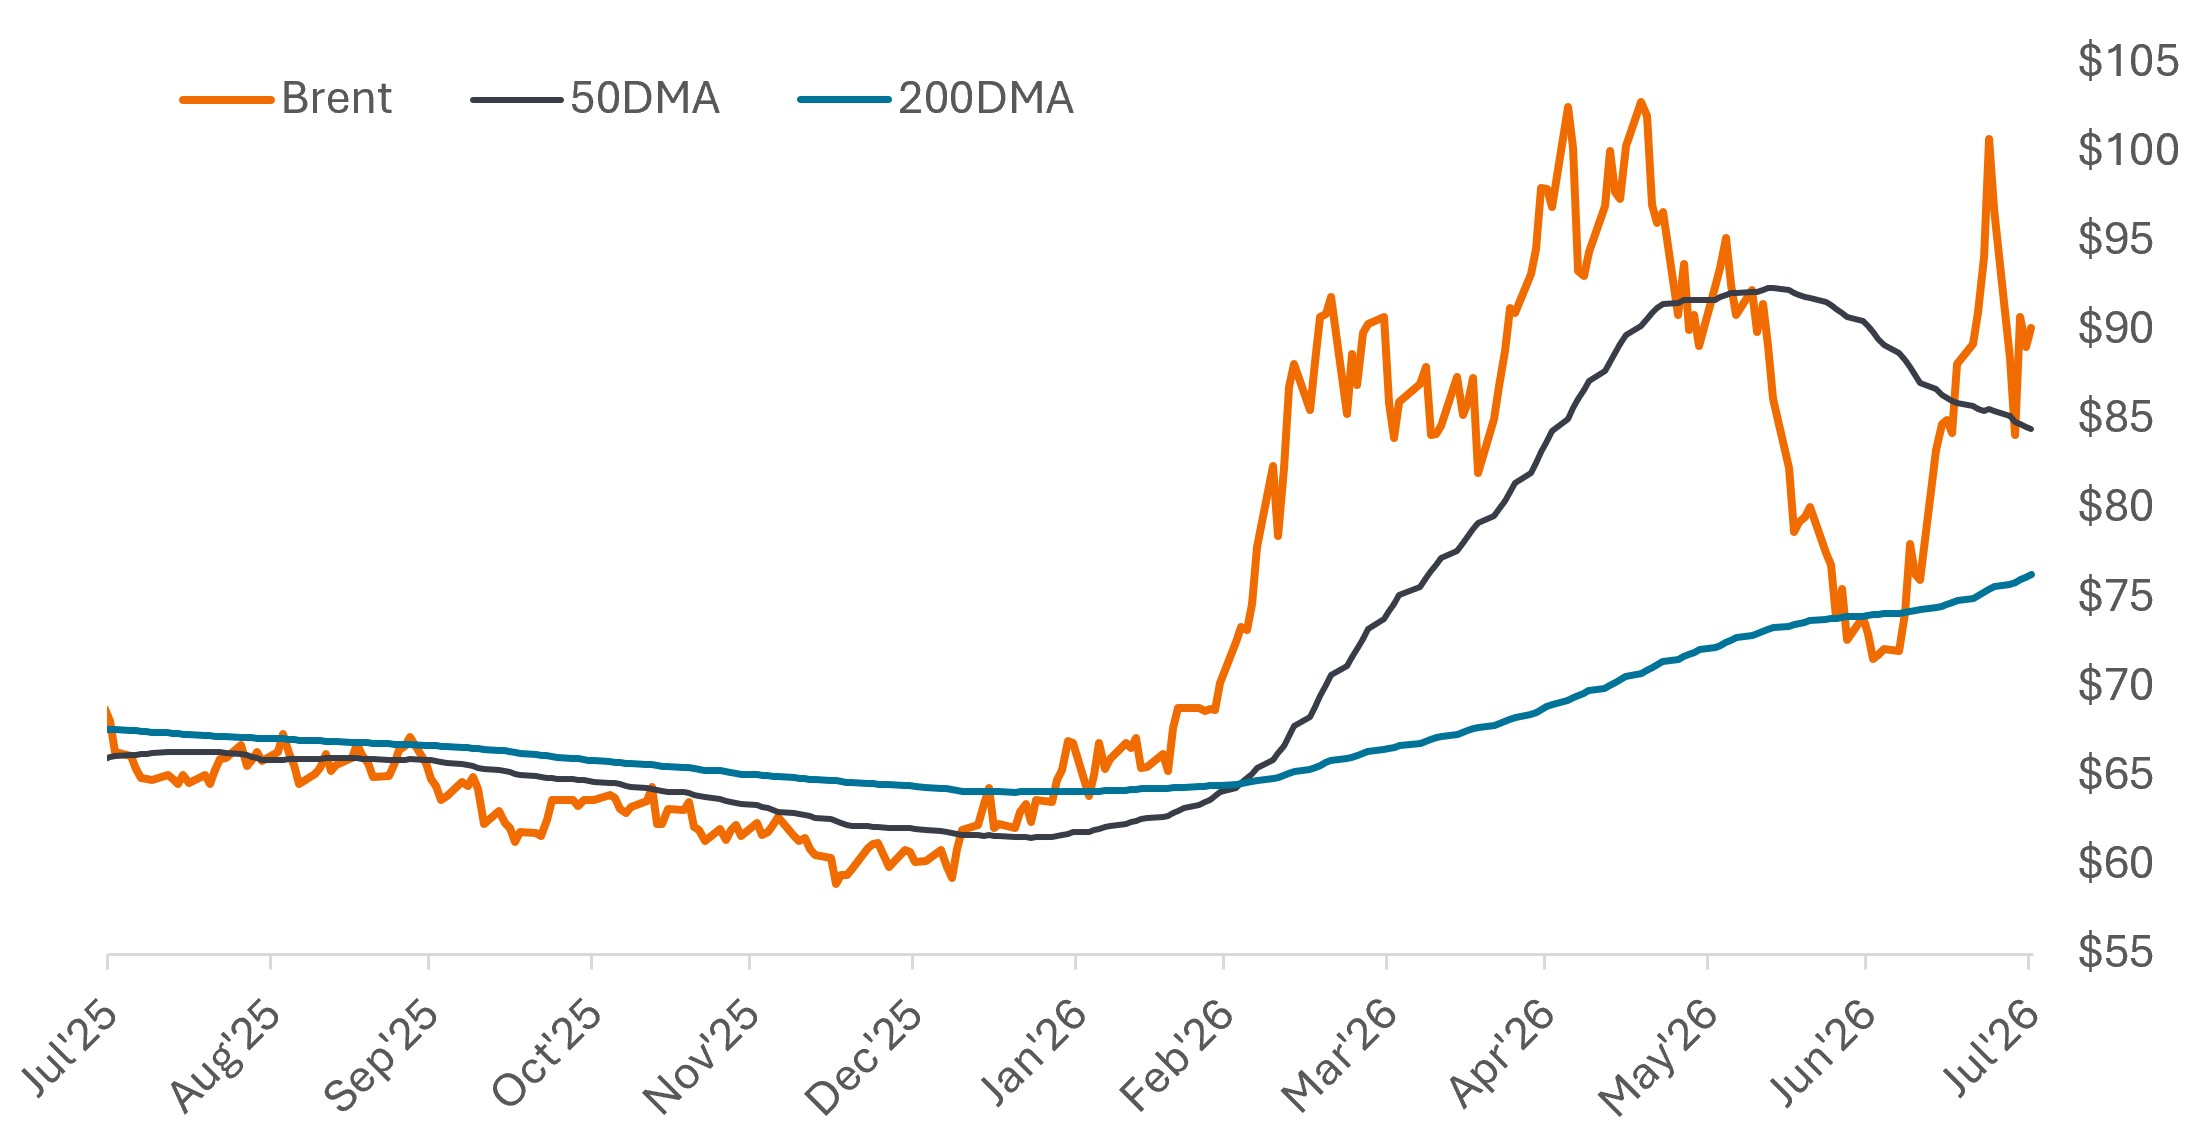
Source: Bloomberg, data as of 31 July 2025 to 31 July 2026. Brent = Brent crude futures. 50DMA = 50-day simple moving average. 200DMA = 200-day simple moving average. Past performance is no guarantee of future results.
- Global bond yields rose amid mounting funding needs: The combined weight of AI-driven corporate issuance, ongoing sovereign supply, and persistent fiscal concerns pushed yields higher across major markets. The U.S. 30-year Treasury yield reached its highest level since 2007, even as the Federal Reserve (Fed) held rates unchanged. Meanwhile, AI-related corporate borrowing, already more than double last year’s issuance, increasingly competed with sovereign bonds for buyers. UK gilts and European yields moved higher amid energy-driven inflation concerns, with Germany’s 10-year yield reaching its highest level since 2011.
- Earnings season – strong growth, but a high bar: The fundamental backdrop for stocks remained supportive, with Q2 earnings delivering solid year-over-year growth across most sectors and regions. Consumer spending proved resilient, while strong results from leading chipmakers and hyperscalers reinforced the case for continued AI infrastructure investment. Yet even these solid numbers were not always enough, as lofty expectations led to mixed post-earnings stock reactions. Economic data was also broadly supportive, with Purchasing Managers’ Index (PMI) readings improving across much of the developed world.
United States
U.S. equities delivered mixed results in July as sector rotation continued amid a pullback in semiconductors and other AI-related companies. The PHLX Semiconductor Index (SOX) fell more than 20%, its biggest monthly decline since 2008, though the index remained up roughly 60% for the year. The S&P 500® Index was little changed, declining 0.1%, while the tech-heavy Nasdaq Composite fell 3.2%. Equal-weight benchmarks notably outperformed their cap-weighted counterparts, and value outperformed growth, reflecting the dispersion and market broadening that was evident through much of the month.
- The S&P 500 declined 0.1% in July but remained up 10.1% for the year.
- The S&P 500 Equal Weight Index advanced 1.0%, extending its year-to-date gain to 13.2%.
- The Nasdaq Composite fell 3.2%, down for a second straight month on the heels of strong gains in April and May.
- The small-cap Russell 2000 Index declined 3.0%, though the benchmark remained up 19.0% year to date.
- Value outperformed growth by a wide margin, with the Russell 1000 Value Index rising 3.8% while the Russell 1000 Growth Index fell 4.8%. The Russell 2500 Value Index, representative of small- and mid-cap companies, rose a modest 0.1% while its growth counterpart fell 7.9% on the month.
S&P 500 sector performance (July and year to date)
Energy and financials posted strong gains, while tech, industrials, and utilities lagged.
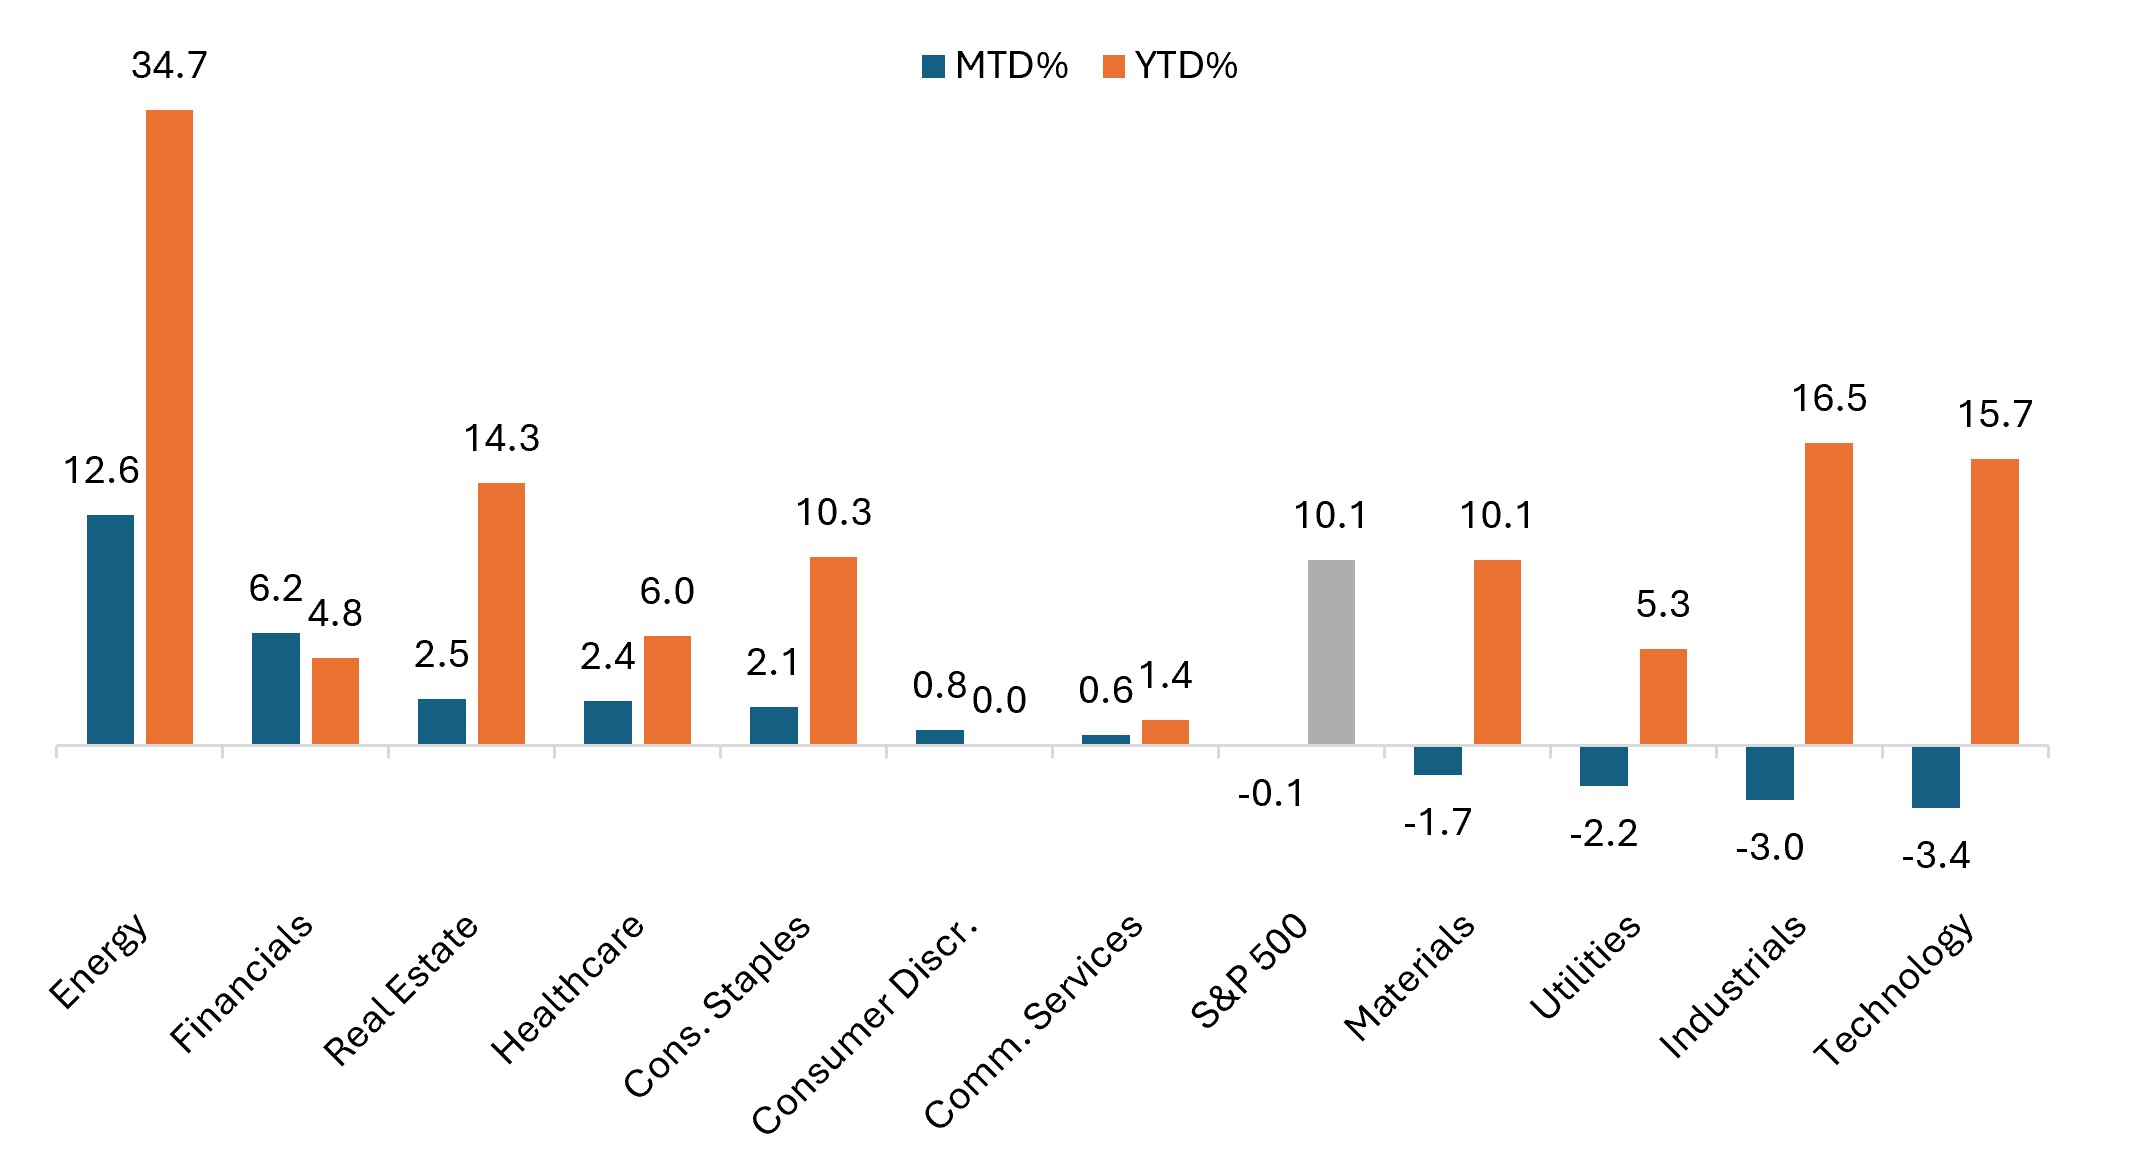
Source: Bloomberg, as of 31 July 2026. Past performance is no guarantee of future results.
U.S. economic data offered a mixed picture, with cooler inflation and softer labor-market data offset by solid business activity:
- The Fed held its benchmark rate steady in the 3.5% to 3.75% range, as expected, though the split 9-3 vote saw three members vote in favor of a 25 basis-point (bp) rate increase. The accompanying statement noted that economic activity continued to expand at a solid pace, while inflation remained above the Fed’s 2% target, partly reflecting supply shocks tied to geopolitical and trade factors.
- Labor market data softened, but without signaling a sharp deterioration. Nonfarm payrolls rose by 57,000 in June, well below expectations of roughly 110,000, while job gains for April and May were revised lower by a combined 74,000. However, the unemployment rate edged down to 4.2% from 4.3%, and weekly jobless claims data remained subdued, suggesting a broadly stable labor market despite slowing hiring momentum.
- Inflation readings cooled more than expected. The Consumer Price Index (CPI) declined 0.4% month over month in June and slowed to 3.5% year over year (after jumping to 4.2% in May), while core CPI was unchanged on the month and eased to 2.6% year over year (from 2.9%). The Producer Price Index (PPI) also surprised to the downside, falling 0.3% month over month after jumping 1.1% in May. The Fed’s preferred inflation gauge, core PCE, also cooled in June, increasing 0.1% month over month after rising 0.3% in May.
- Activity data pointed to a strong start to the third quarter, led by services, though price pressures remained elevated. The S&P Global flash U.S. composite Purchasing Managers’ Index (PMI) rose to 53.6 in July (from 51.9 in June), its highest level in eight months. The services PMI also rose to 53.6 from 51.2, while manufacturing remained in expansion but lost some momentum, edging down to 53.8 from 53.9.
- The advance estimate of U.S. Gross Domestic Product (GDP) for the second quarter pointed to 1.5% growth, below consensus estimates and down from 2.1% in the prior quarter, though economists highlighted strong consumer spending and private investment trends as bright spots.
Europe
Eurozone equities advanced in July, supported by improving activity data, strong corporate earnings, and rotation toward value-oriented and cyclical sectors. The STOXX Europe 600 Index gained 1.3% in euro terms and 2.2% in U.S. dollar terms. The MSCI Europe ex United Kingdom Index was essentially flat in local currency terms but rose 0.9% in U.S. dollar terms. Germany’s DAX and France’s CAC returned 2.5% and 1.3% in local currency terms, respectively.
- The European Central Bank (ECB) left its deposit rate unchanged at 2.25%, as expected, after delivering a 25 bp rate increase in June. While policymakers unanimously opted to pause, the ECB noted that inflation risks remained elevated, and markets continued to price in a strong likelihood of another rate hike in September.
- Eurozone inflation continued to moderate. Headline CPI cooled to 2.8% year over year (from 3.2%) in June and core inflation to 2.4% (from 2.6%). However, the preliminary estimate for July – released at the end of the month – showed CPI ticking up to 2.9%, largely due to higher energy prices amid the resumption of U.S.-Iran hostilities.
- Eurozone PMI data showed business activity returning to growth in July. The flash composite PMI rose to 51.9 from 50.0 in June, exceeding expectations and marking the first expansion in four months. The improvement was driven by stronger services activity, while manufacturing data also pointed to improving momentum across the region.
- The advance estimate of Eurozone GDP pointed to a pickup in economic activity during the second quarter, with growth of 0.4% exceeding expectations and improving from flat growth in the prior quarter.
UK equities outperformed in July, helped in part by the market’s higher weightings to energy and financials and lower exposure to tech. The MSCI United Kingdom Index rose 3.9% in sterling and 5.5% in U.S. dollar terms, while the FTSE All-Share Index hit a new all-time high, gaining 3.7% in sterling and 5.4% in U.S. dollars. Energy and financials benefited from higher oil prices and rising rate expectations, while political developments kept longer-dated gilt yields in focus.
- The Bank of England (BoE) left its benchmark rate at 3.75%, as expected, albeit with the vote split 6-3 as three Monetary Policy Committee (MPC) members favored a rate increase. Officials noted inflation risks remain skewed to the upside, while markets continued to price in a 25 bp rate increase by year end and another in early 2027.
- UK inflation eased a bit more than expected, with headline CPI coming in at 2.6% year over year in June, down from 2.8% in May.
- Labor market data showed signs of stabilization. Payrolls declined by 4,000 in June, less than expected, while the unemployment rate held steady at 4.9%.
- Economic growth indicators improved modestly. The UK economy grew by 0.1% in May, recovering from April’s 0.1% decline. Retail sales also unexpectedly rose 1.0% in June (compared with estimates for a modest decline), helped by seasonal factors including hot weather and World Cup-related spending.
- PMI data pointed to a return to growth in private sector activity. The flash July composite PMI rose to 52.1 (from 49.3 in June), well ahead of expectations, as UK firms reported their first growth in three months and some easing in cost pressures.
- Andy Burnham officially became prime minister, replacing Keir Starmer, on July 20. Early policy moves focused on cost-of-living relief, including plans to remove VAT from domestic electricity bills, while Burnham and newly appointed Chancellor John Healey emphasized fiscal discipline. However, questions remained over how the new measures would be funded.
European equities advanced in July, led by the UK
A weaker dollar amplified returns in U.S. dollar terms.
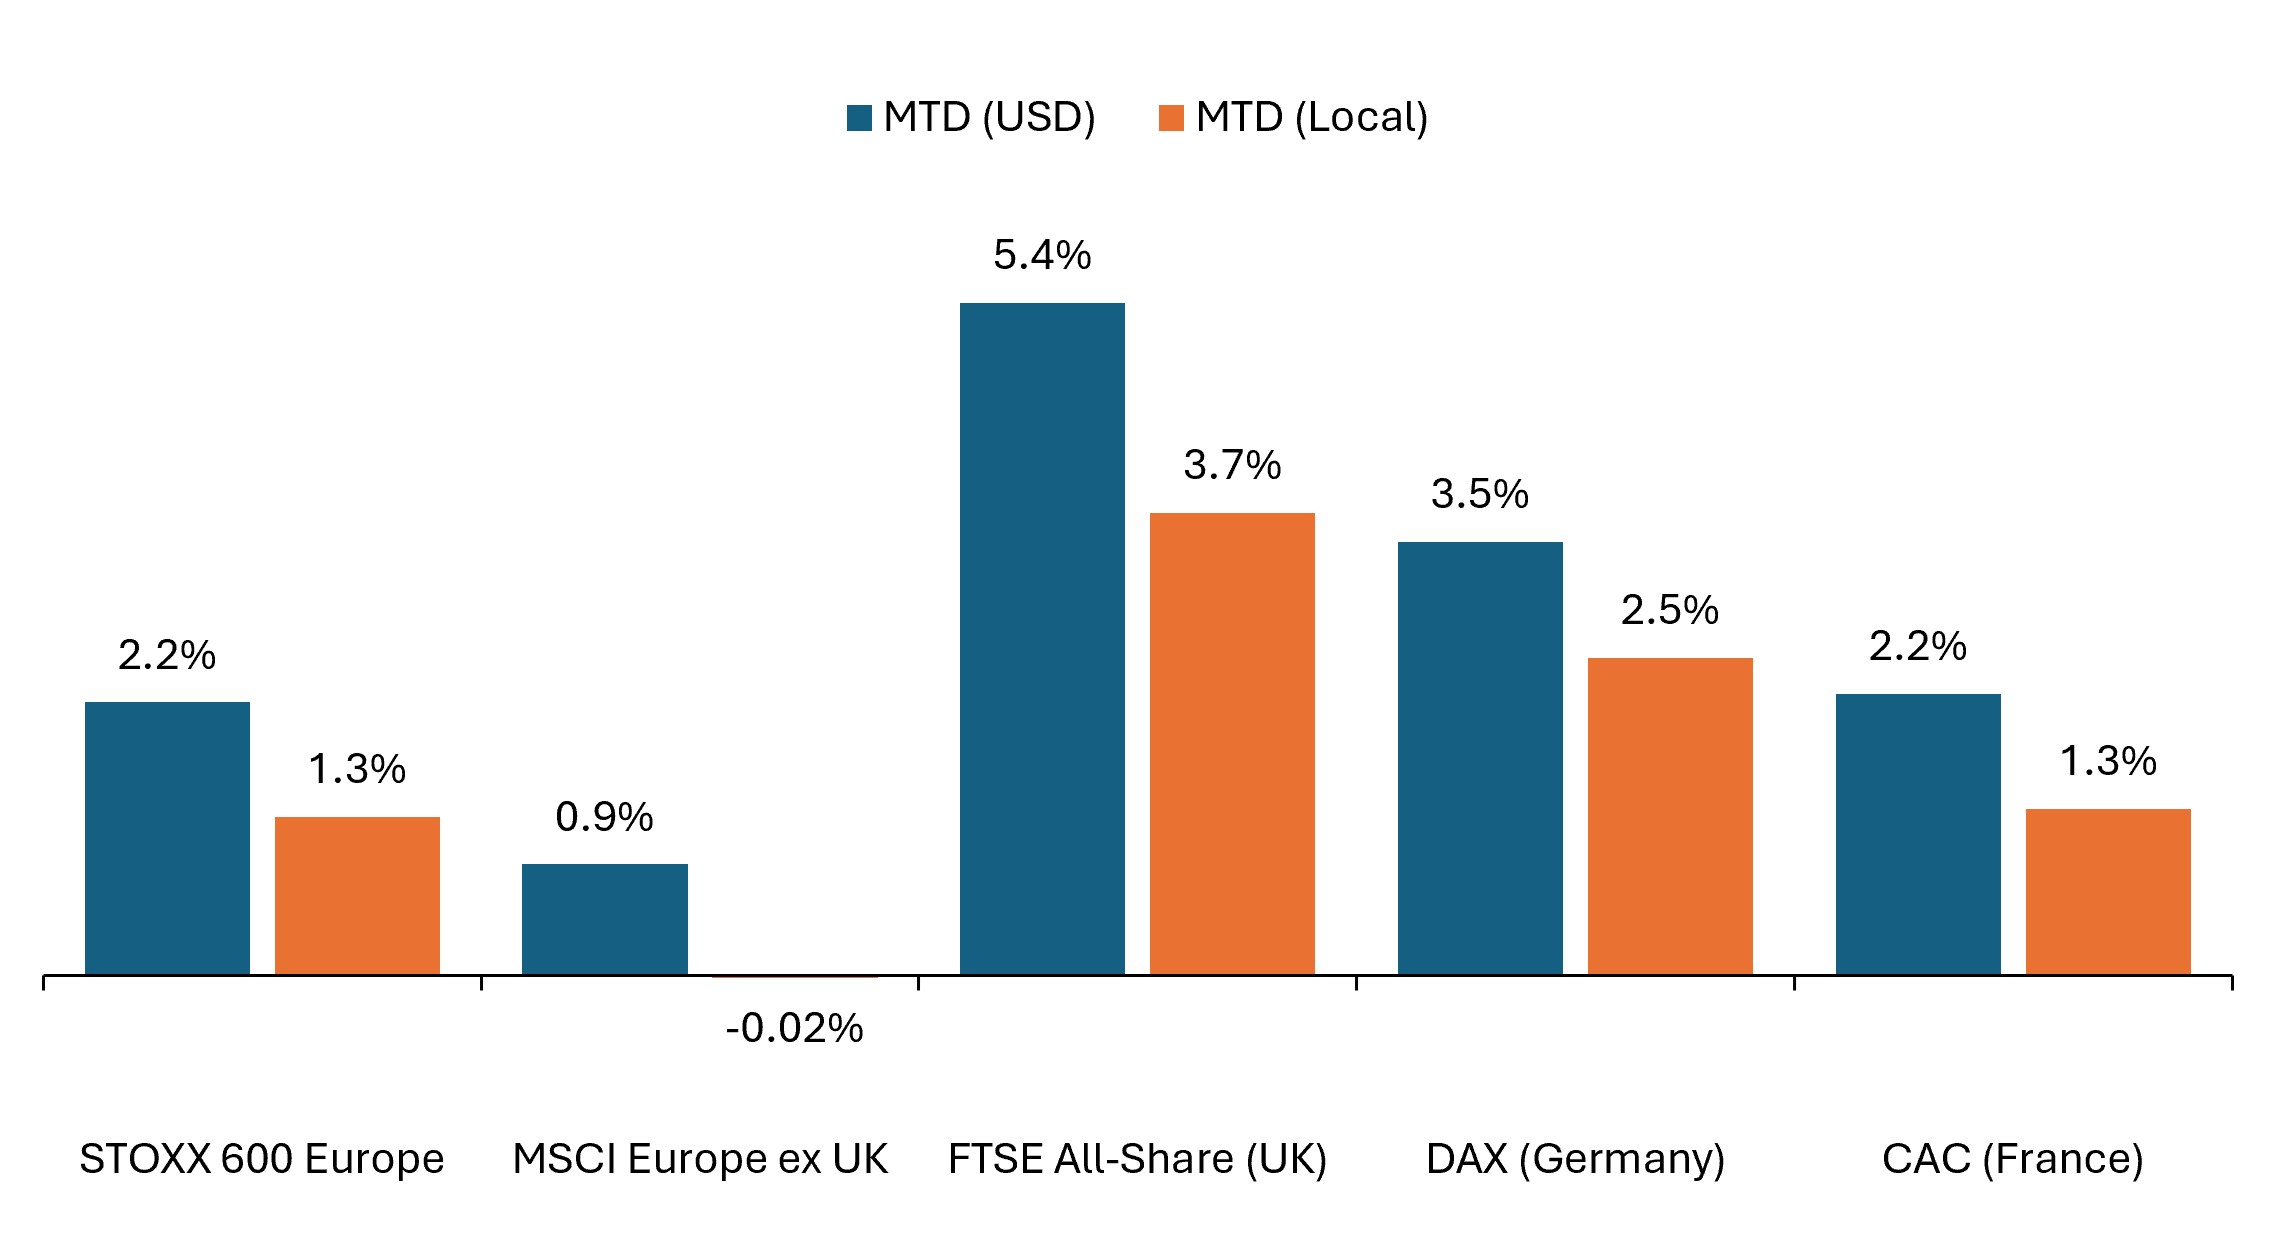
Source: Bloomberg, data from 30 June 2026 to 31 July 2026. Past performance is no guarantee of future results.
Within the STOXX 600 Index – comprising companies from 17 countries across developed Europe including the UK – sector performance was mixed.
- Energy (+9.3% in euro terms) was the strongest-performing sector, as crude prices rebounded sharply. Banks (+6.4%) and Financial Services (+5.2%) also outperformed, supported by higher bond yields and resilient earnings, while Insurance (+4.8%) delivered solid gains as well.
- Autos & Parts (+4.6%) rebounded after prior weakness, bolstered by solid earnings performance, while Retail (+3.2%), Real Estate (+3.2%), Basic Resources (+2.7%), and Chemicals (+2.6%) also advanced. Industrials (+1.7%) posted a more modest gain.
- Defensive and other consumer-oriented sectors were more mixed. Personal Care, Drug & Grocery (+5.2%) was a notable outperformer, while Media (+2.4%) and Food, Beverage & Tobacco (+1.0%) gained. Consumer (-0.2%) was little changed, while Health Care (-1.5%) and Utilities (-1.4%) declined.
- Among the month’s laggards, Telecommunications (-2.4%) and Construction & Materials (-1.9%) declined, while Travel & Leisure (-4.9%) came under pressure as higher oil prices raised concerns about fuel costs. Technology (-7.2%) was the weakest-performing sector, reflecting the broader July unwind in AI- and semiconductor-linked momentum trades.
Asia Pacific
Japanese equity performance was split in July, with the broader TOPIX advancing while the Nikkei 225 declined sharply amid weakness in technology-oriented stocks. The TOPIX rose 0.2% in yen terms and 2.3% in U.S. dollars, while the Nikkei 225 fell 8.1% in yen terms and 6.2% in U.S. dollars. Currency volatility remained a major focus, with the yen weakening toward multi-decade lows before rebounding late in the month amid intervention reports and shifting expectations for Bank of Japan policy.
- The Bank of Japan (BoJ) left its benchmark rate unchanged at 1.0%, as expected, following June’s 25 bp increase. Policymakers continued to signal a gradual normalization of monetary policy, while market expectations remained tilted toward an additional rate increase later this year.
- The Japanese yen remained a key focus for markets. After weakening to a 40-year low in July, the currency rebounded sharply at the end of the month (a day before the BoJ’s policy decision), sparking speculation that Japanese officials had intervened in currency markets. Officials have since confirmed coordinated U.S.-Japan yen-buying to support the currency, the first such joint action between the two countries since 1998.
- Inflation pressure remained elevated at the wholesale level. Producer prices rose 7.1% year over year in June, accelerating from 6.3% in May and marking the fastest pace since 2023. Consumer inflation was more moderate, with core CPI increasing 1.6% year over year, up from 1.4% in the prior month.
- Business activity showed solid momentum. Japan’s flash July composite PMI rose to 53.1 from 52.8, reaching its highest level since February, while manufacturing activity accelerated to its strongest pace in more than a decade.
Equities across Asia Pacific ex Japan declined in July as weakness in South Korea and Taiwan outweighed strength in China and Australia. The MSCI AC Asia Pacific ex Japan Index fell 2.3% in U.S. dollar terms. Technology-heavy markets were pressured by the sharp pullback in AI-related semiconductors and memory names, while China and Australia offered pockets of relative strength. The MSCI China Index rose 9.0% in U.S. dollar terms despite sharp weakness across portions of China’s technology sector, with policy support measures and strength in other parts of the market helping offset those declines. Australia’s ASX 200 gained 2.3% in local currency terms and 4.0% in U.S. dollar terms, supported by stronger-than-expected employment data, improving business activity, and leadership from energy and financial stocks.
Emerging Markets
Emerging market equities declined in July as sharp weakness in tech-heavy markets outweighed gains across China, Latin America, and parts of Southeast Asia. The MSCI Emerging Markets Index fell 3.0% in U.S. dollar terms, though it remained up 20.3% year to date. July saw heightened dispersion across regions, with volatility in the AI trade, higher oil prices, currency moves, and country-specific policy developments driving returns. Performance figures below reference MSCI country indices reported in U.S. dollar terms.
- South Korea fell 17.9% in U.S. dollar terms as AI-linked chipmakers sold off sharply before rebounding late in the month; the index remained up nearly 80% year to date. Taiwan saw a similar dynamic, posting a monthly decline of 5.3%. Conversely, Indonesia rose 11.2% as the country’s central bank unexpectedly held rates steady, and the Philippines advanced 6.1%. India gained 1.6% as strong foreign inflows during the month were offset by the surge in oil prices.
- Latin America was a pocket of strength, with Brazil (+6.4%), Argentina (+5.6%), and Mexico (+2.0%) posting solid monthly gains. Colombia surged 20.1%, with energy producers boosted by higher oil prices, while the peso appreciated to a multi-year high, amplifying gains in U.S. dollar terms.
- In EMEA, performance was mixed. Turkey fell 2.9%, while South Africa (-0.3%) edged lower, and Poland (+10.5%) saw strong monthly gains, driven by energy and financials.
Fixed Income
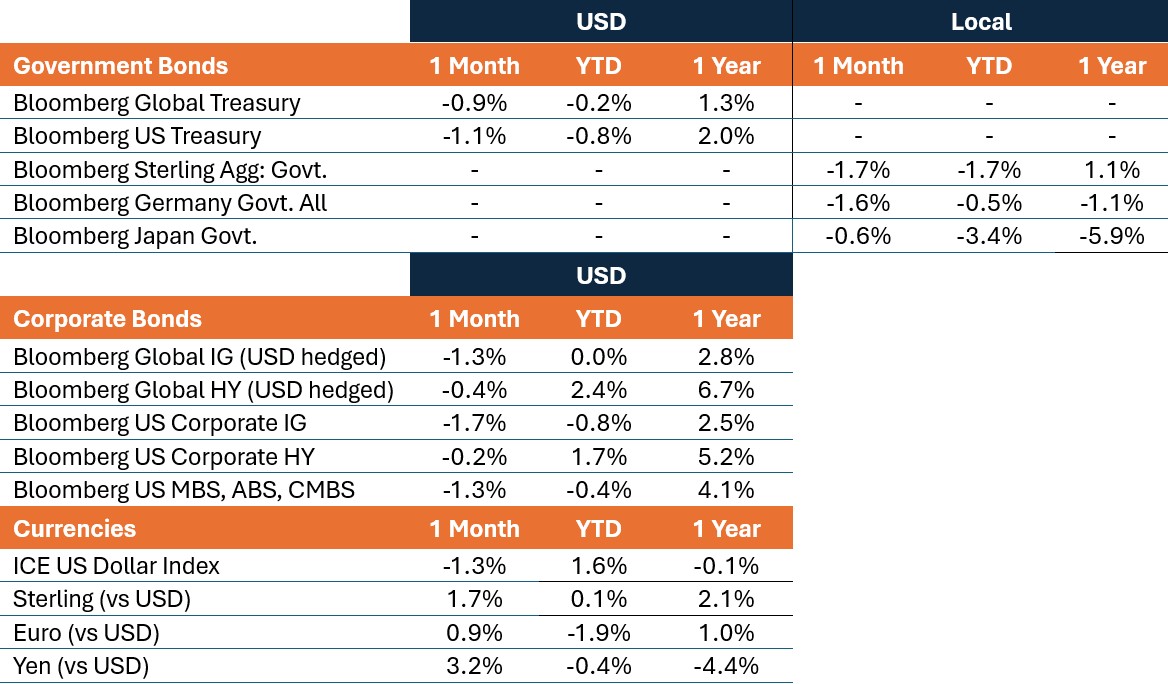
Global government bonds declined in July as yields rose across developed markets, reflecting higher oil prices, shifting central bank expectations, and ongoing fiscal concerns. Sovereign yield curves generally shifted higher, though the U.S. was also marked by notable steepening.
- The Bloomberg Global Treasury Index fell 0.9% in U.S. dollar-hedged terms.
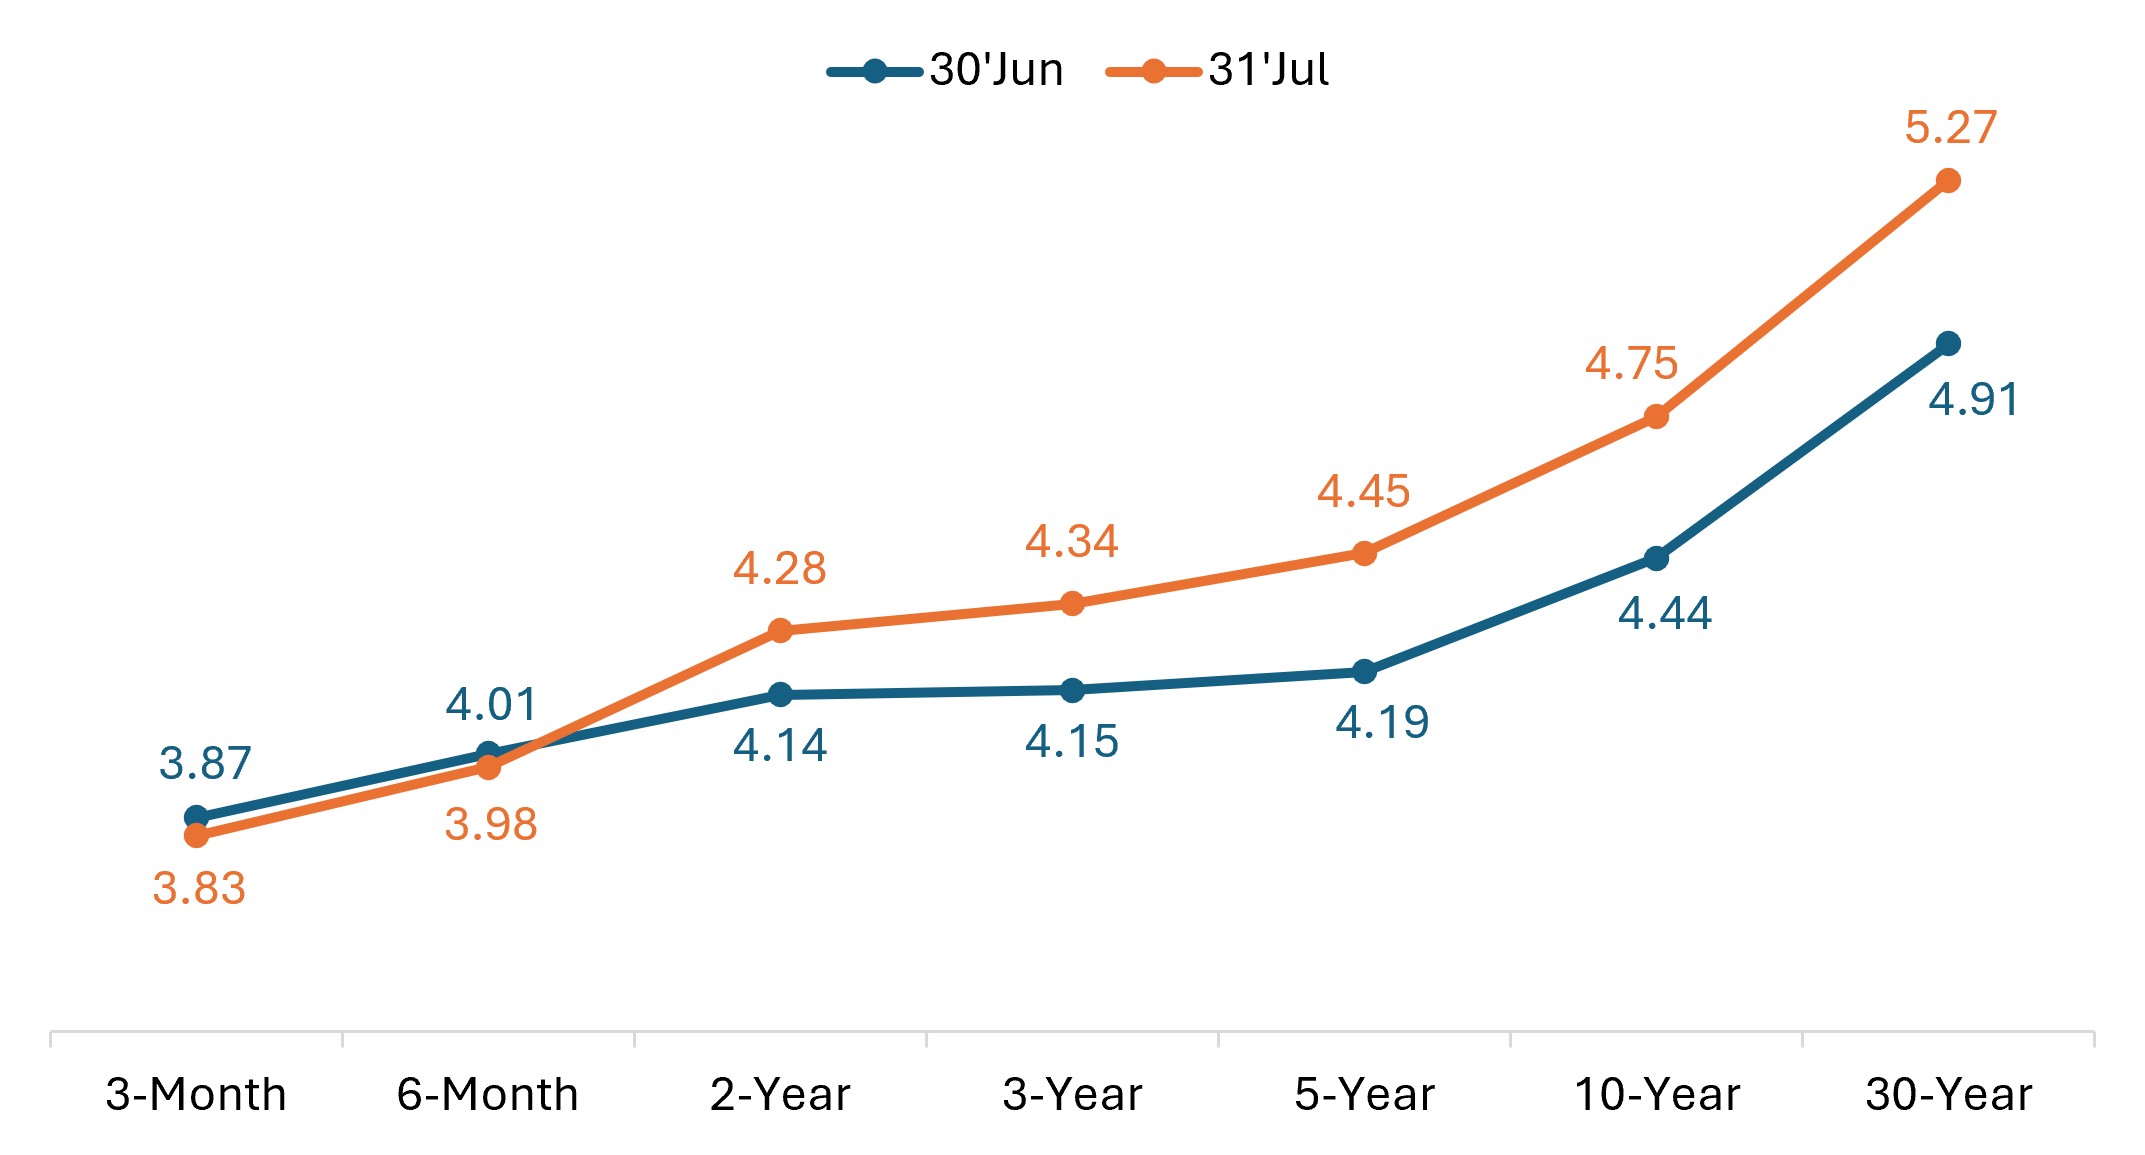
- The U.S. 10-year Treasury yield rose 31 bps to 4.75%, while the yield on the 30-year Treasury rose 36 bps to 5.28%, its highest level since 2007.
- The U.S. Treasury curve bear steepened as yields at the long end rose more than front-end yields. The spread between the 10-year and 2-year yields widened to 47 bps from 30 bps at the start of the month.
U.S. Treasury yield curve (month-on-month change)
Source: Bloomberg, as of 31 July 2026. Past performance is no guarantee of future results.
- In Europe, UK government bonds fell during the month as yields shifted higher. The 10-year gilt yield rose 29 bps to 5.05%.
- German sovereign bonds also delivered negative returns, with the 10-year bund yield rising by approximately 35 bps to 3.21%.
- Japanese government bonds (JGB) also declined, as the yield on the 10-year JGB rose 10 bps, reaching 2.8% for the first time since 1997.
Spread sectors were mixed, with global corporate bonds posting monthly declines. Investment-grade corporates trailed high yield at the index level, with AI-related issuance among the factors weighing on performance. That said, while corporate spreads saw modest widening during the month, they remained relatively tight by historical standards.
- The Bloomberg Global Aggregate Corporate Index fell 1.3% in U.S. dollar-hedged terms, while the Bloomberg Global High Yield Index declined 0.4% on a hedged basis.
- Global investment-grade spreads widened by approximately 2 bps, while high-yield spreads widened by roughly 7 bps.
- U.S. investment-grade corporates, as measured by the Bloomberg U.S. Corporate Index, fell 1.7%, compared to a 0.2% decline for high yield.
- U.S. investment-grade spreads widened by approximately 4 bps in July. U.S. high-yield spreads widened by roughly 9 bps.
- In securitized markets, spreads of asset-backed securities (ABS) and mortgage-backed securities (MBS) widened by roughly 6 bps.
Central Bank Watch
Major central banks were largely on hold in July, though policymakers maintained a cautious stance toward upside inflation risks, with renewed hostilities between the U.S. and Iran adding to concerns about a prolonged period of higher energy prices. The Federal Reserve’s second meeting under Chair Kevin Warsh drew the most attention, as the committee held rates steady while facing pointed scrutiny over its inflation-fighting framework.
- Bank of Canada (July 15): The BoC held its overnight rate at 2.25% for a sixth consecutive meeting. While policymakers acknowledged inflation pressures stemming from higher energy prices, Governor Macklem pointed to signs of economic improvement and reiterated a data-dependent approach.
- South Korea (July 16): The Bank of Korea raised its policy rate by 25 bps to 2.75%, citing persistent inflation pressures and financial stability concerns. Officials indicated that additional tightening remains possible if inflation proves more persistent than expected.
- People’s Bank of China (July 20): The PBOC left its one-year and five-year loan prime rates unchanged at 3.0% and 3.5%, respectively, for a fourteenth consecutive month.
- European Central Bank (July 23): The ECB left its deposit rate unchanged at 2.25% after raising rates in June for the first time since 2023. President Lagarde described the decision as a pause, with policymakers retaining the option to tighten further should inflation fail to ease. At the end of the month, markets were pricing in a roughly 90% chance of another rate increase at the September meeting.
- U.S. Federal Reserve (July 29): The FOMC kept rates unchanged in the 3.50%-3.75% range, though the split 9-3 vote tilted hawkish as three officials dissented in favor of an immediate rate hike. Markets focused less on the decision and more on Chair Kevin Warsh’s press conference. While investors welcomed his commitment to price stability, the lack of a plan on how that will be achieved fueled uncertainty around the path ahead, contributing to a sell-off in longer-dated Treasuries.
- Bank of England (July 30): The BoE maintained its bank rate at 3.75% in a 6-3 vote, with three MPC members favoring a rate hike. Policymakers cited easing domestic price pressures but warned that higher energy costs tied to Middle East tensions could create upside inflation risks. As of month end, markets were pricing expectations for at least one 25 bp rate hike by the December meeting.
- Bank of Japan (July 31): The BoJ held its policy rate at 1.0%, pausing after June’s rate increase. However, officials signaled that inflation remains on track to exceed target and left the door open to further normalization later this year. Markets continued to price in an additional 25 bp rate increase this year, but with greater likelihood that it could come as soon as September.
- Other central banks: Among other notable policy decisions during the month, Poland (July 8) held at 3.75% for a fourth consecutive meeting, with Governor Glapinski striking a dovish tone and signaling a possible rate cut as early as September. New Zealand (July 8) raised its cash rate by 25 bps to 2.50% – its first hike in three years – and indicated that further tightening would depend on incoming inflation data. Hungary (July 21) extended its easing cycle with a second consecutive 25 bp cut to 5.75%. Indonesia (July 22) delivered a surprise hold at 5.75%, pausing after 100 bps of cumulative tightening in May and June, and instead announcing a package of investor incentives to support the currency. The move was followed by the resignation of Governor Perry Warjiyo later in the month. South Africa (July 23) delivered a surprise hold at 7.0% in a 4-2 vote, defying expectations for a 25 bp increase.
- Looking ahead: While the Reserve Bank of Australia will meet on August 11, the month’s calendar beyond that is relatively sparse, with major G7 central banks back in September. Investor attention will turn to the Federal Reserve’s Jackson Hole Policy Symposium at month end, where Chair Kevin Warsh may have an opportunity to provide greater clarity on the Fed’s policy framework.
Key events on tap in August
- Aug. 3 – Global Manufacturing PMIs (July, final)
- Aug. 5 – Global Services and Composite PMIs (July, final)
- Aug. 7 – U.S. Nonfarm Payrolls, Unemployment Rate (July)
- Aug. 11 – Reserve Bank of Australia (RBA) Rate Decision
- Aug. 12 – U.S. Consumer Price Index (July)
- Aug. 13 – UK Gross Domestic Product (Q2, advance)
- Aug. 14 – Eurozone Gross Domestic Product (Q2, second est.)
- Aug. 17 – Japan Gross Domestic Product (Q2, advance)
- Aug. 19 – Eurozone Consumer Price Index (July, final)
- Aug. 19 – UK Consumer Price Index (July)
- Aug. 21 – Global PMIs (August, flash estimate)
- Aug. 26 – U.S. Gross Domestic Product (Q2, second est.)
- Aug. 27-29 – Jackson Hole Economic Policy Symposium (Fed Chair keynote Aug. 28)
Market Performance
Total returns (%), periods ended July 31, 2026
IMPORTANT INFORMATION
Artificial intelligence (“AI”) focused companies, including those that develop or utilize AI technologies, may face rapid product obsolescence, intense competition, and increased regulatory scrutiny. These companies often rely heavily on intellectual property, invest significantly in research and development, and depend on maintaining and growing consumer demand. Their securities may be more volatile than those of companies offering more established technologies and may be affected by risks tied to the use of AI in business operations, including legal liability or reputational harm.
Equity securities are subject to risks including market risk. Returns will fluctuate in response to issuer, political and economic developments.
Fixed income securities are subject to interest rate, inflation, credit and default risk. As interest rates rise, bond prices usually fall, and vice versa. High-yield bonds, or “junk” bonds, involve a greater risk of default and price volatility. Foreign securities, including sovereign debt, are subject to currency fluctuations, political and economic uncertainty and increased volatility and lower liquidity, all of which are magnified in emerging markets.
Foreign securities are subject to additional risks including currency fluctuations, political and economic uncertainty, increased volatility, lower liquidity and differing financial and information reporting standards, all of which are magnified in emerging markets.
Sovereign debt securities are subject to the additional risk that, under some political, diplomatic, social or economic circumstances, some developing countries that issue lower quality debt securities may be unable or unwilling to make principal or interest payments as they come due.
Bloomberg Asian-Pacific Japan Government-Related Index is a fixed-rate, investment grade, JPY-denominated benchmark that includes debt from government-related issuers.
Bloomberg Germany Government All Bonds Index measures the performance of German government bonds (Bunds) issued by the German government.
Bloomberg Global 10+ Year Total Return Index tracks investment-grade government and government-related bonds with maturities of 10 years or greater.
Bloomberg Global Aggregate – Corporate Index is a flagship measure of global investment grade, fixed-rate corporate debt. This multi-currency benchmark includes bonds from developed and emerging markets issuers.
Bloomberg Global High Yield Index is a multi-currency flagship measure of the global high yield debt market. The index represents the union of the US High Yield, the Pan-European High Yield, and Emerging Markets (EM) Hard Currency High Yield Indices.
Bloomberg Global Treasury Index tracks fixed-rate, local currency government debt of investment grade countries, including both developed and emerging markets.
Bloomberg Sterling Aggregate: Government Index measures the performance of UK government bonds (Gilts) within the broader Bloomberg Sterling Aggregate Index, which covers the investment-grade, fixed-rate, sterling-denominated bond market.
Bloomberg US Corporate Bond Index measures the investment grade, fixed-rate, taxable corporate bond market. It includes USD-denominated securities from US and non-US issuers.
Bloomberg US Corporate High Yield Bond Index measures the USD-denominated, high yield, fixed-rate corporate bond market. Bonds from issuers with an emerging markets country of risk, based on Bloomberg EM country definition, are excluded.
Bloomberg US Securitized: MBS, ABS, and CMBS Index tracks all USD-denominated, investment grade, securitized issues within the Bloomberg US Aggregate Index.
Bloomberg US Treasury Index measures U.S. dollar-denominated, fixed-rate, nominal debt issued by the U.S. Treasury.
The DAX is a blue-chip stock market index consisting of the 40 major German companies trading on the Frankfurt Stock Exchange.
The France CAC 40 Index is a market value weighted index, composed of the 40 highest levels among the 100 highest market caps on the Paris Bourse.
FTSE All-Share Index reflects the equity market performance of the United Kingdom. The index includes nearly all eligible companies on the London Stock Exchange, covering large, mid, and small-cap stocks.
ICE U.S. Dollar Index is a benchmark measuring the U.S. dollar’s value against a basket of six major world currencies (Euro, Yen, Pound Sterling, Canadian Dollar, Swedish Krona, Swiss Franc).
MSCI AC Asia Pacific ex Japan Index reflects the equity market performance of the Asia Pacific region, excluding Japan, covering both developed and emerging markets.
MSCI ACWI ex USA Index captures large- and mid-cap representation across 22 of 23 developed markets (excluding the US) and 24 emerging markets countries.
MSCI China Index captures large and mid cap representation across China A shares, H shares, B shares, Red chips, P chips and foreign listings (e.g. ADRs).
MSCI Emerging Markets Index reflects the equity market performance of emerging markets.
MSCI Emerging Markets (EM) Latin America Index captures large and mid cap representation across Emerging Markets (EM) countries in Latin America. The index covers approximately 85% of the free float-adjusted market capitalization in each country.
MSCI Europe Index reflects the equity market performance of large and mid-sized companies listed in developed markets in Europe.
MSCI Europe ex UK Index reflects the equity market performance of large and mid-sized companies listed in developed markets in Europe excluding the United Kingdom.
MSCI United Kingdom Index reflects the equity market performance of large and mid-sized companies listed in the UK market.
MSCI World Index captures large- and mid-cap representation across 22 of 23 developed markets countries, excluding the United States.
MSCI World ex USA Index reflects the equity market performance of global developed markets excluding the United States.
NASDAQ Composite Stock Index: National Association of Securities Dealers Automated Quotation System (NASDAQ) is a nationwide computerized quotation system for over 5,500 over-the-counter stocks. The index is compiled of more than 4,800 stocks that are traded via this system.
Nikkei 225 Index (also known as Nikkei Stock Average): A measure of Japanese equity market performance. The index includes 225 of the largest companies listed on the Tokyo Stock Exchange.
The PHLX Semiconductor Sector Index (SOX) is a specialized, modified market capitalization-weighted index composed of companies primarily involved in the design, distribution, manufacture, and sale of semiconductors.
Purchasing Managers’ Index (PMI) is an index of the prevailing direction of economic trends in the manufacturing and service sectors, based on a survey of private sector companies.
Russell 1000® Growth Index reflects the performance of U.S. large-cap equities with higher price-to-book ratios and higher forecasted growth values.
Russell 1000® Value Index reflects the performance of U.S. large-cap equities with lower price-to-book ratios and lower forecasted growth values.
Russell 2000® Index reflects the performance of U.S. small-cap equities.
Russell 2500™ Growth Index reflects the performance of U.S. small to mid-cap equities with higher price-to-book ratios and higher forecasted growth values.
Russell 2500™ Value Index reflects the performance of U.S. small to mid-cap equities with lower price-to-book ratios and lower forecasted growth values.
S&P 500® Index reflects U.S. large-cap equity performance and represents broad U.S. equity market performance.
S&P 500® Equal Weight Index (EWI) is the equal-weight version of the S&P 500. The index includes the same constituents as the capitalization weighted index, but each company is allocated a fixed weight – or 0.2% of the index total at each quarterly rebalance.
S&P/ASX 200 Index reflects the performance of the 200 largest, most liquid companies listed on the Australian Securities Exchange (ASX).
STOXX Europe 600 Index: An index of the 600 largest listed stocks in the European equity market, comprising 17 countries and 11 industries
TOPIX: A capitalization-weighted index of all the companies listed on the First Section of the Tokyo Stock Exchange and is widely regarded as a broad benchmark for Japanese stock prices.
10-year bond: A bond that is set to mature (repay the principal value) in 10 years.
10-Year Treasury Yield is the interest rate on U.S. Treasury bonds that will mature 10 years from the date of purchase.
Agency Mortgage-backed Securities (Agency MBS): A type of asset-backed security that is specifically secured by a collection of mortgages.
Asset-backed Securities (ABS): These are financial instruments that are backed by a pool of assets—typically those that generate a cash flow from debt, such as loans, leases, credit card balances, or receivables.
Basis point: One basis point (bp) equals 1/100 of a percentage point, 1bp = 0.01%.
Bund yield: Bund yields are viewed as benchmark yield indicators for European government bonds; those with a 10-year maturity are considered to be the German equivalent of U.S. Treasury bonds.
Commercial Mortgage-backed Securities (CMBS): A type of mortgage-backed security that is secured by the loan on commercial real estate properties rather than residential real estate.
Consumer Price Index (CPI): A measure that examines the price change of a basket of consumer goods and services over time. It is used to estimate inflation.
Credit spread: The difference in yield between securities with similar maturity but different credit quality. Widening spreads generally indicate deteriorating creditworthiness of corporate borrowers, and narrowing indicate improving.
Curve/Yield curve: A yield curve plots the yields (interest rate) of bonds with equal credit quality but differing maturity dates. Typically bonds with longer maturities have higher yields.
The Federal Open Market Committee (FOMC) is the body of the Federal Reserve System that sets national monetary policy.
Fiscal policy: Describes government policy relating to setting tax rates and spending levels. Fiscal policy is separate from monetary policy, which is typically set by a central bank.
Gilt yield: Gilt yields are viewed as benchmark yield indicators for United Kingdom government bonds; those with a 10-year maturity are considered to be the UK equivalent of U.S. Treasury bonds.
Hawkish policy aims to curb inflation and slow down growth in the economy by raising interest rates and reducing the supply of money.
High yield bond: Also known as a sub-investment grade bond, or ‘junk’ bond. These bonds usually carry a higher risk of the issuer defaulting on their payments, so they are typically issued with a higher interest rate (coupon) to compensate for the additional risk.
Inflation: The rate at which the prices of goods and services are rising in an economy. The Consumer Price Index (CPI) and Retail Price Index (RPI) are two common measures.
Investment grade bond: A bond typically issued by governments or companies perceived to have a relatively low risk of defaulting on their payments, reflected in the higher rating given to them by credit ratings agencies.
JGB yield: JGB yields are viewed as benchmark yield indicators for Japanese government bonds; those with a 10-year maturity are considered to be the Japanese equivalent of U.S. Treasury bonds.
Monetary policy: The policies of a central bank, aimed at influencing the level of inflation and growth in an economy. Monetary policy tools include setting interest rates and controlling the supply of money. Dovish policy aims to stimulate economic growth by lowering interest rates and increasing the money supply.
Producer Price Index (PPI) measures the average change over time in the selling prices received by domestic producers for their output.
Securitization: The process in which certain types of assets are pooled so that they can be repackaged into interest-bearing securities. The interest and principal payments from the assets are passed through to the purchasers of the securities.
U.S. Treasury securities are direct debt obligations issued by the U.S. Government. Treasury Bills and U.S. Government Bonds are guaranteed by the full faith and credit of the U.S. government, are generally considered to be free of credit risk.
Volatility measures risk using the dispersion of returns for a given investment.
Quantitative Easing (QE) is a government monetary policy occasionally used to increase the money supply by buying government securities or other securities from the market.
Yield: The level of income on a security over a set period, typically expressed as a percentage rate. For equities, a common measure is the dividend yield, which divides recent dividend payments for each share by the share price. For a bond, this is calculated as the coupon payment divided by the current bond price.
All opinions and estimates in this information are subject to change without notice and are the views of the author at the time of publication. Janus Henderson is not under any obligation to update this information to the extent that it is or becomes out of date or incorrect. The information herein shall not in any way constitute advice or an invitation to invest. It is solely for information purposes and subject to change without notice. This information does not purport to be a comprehensive statement or description of any markets or securities referred to within. Any references to individual securities do not constitute a securities recommendation. Past performance is not indicative of future performance. The value of an investment and the income from it can fall as well as rise and you may not get back the amount originally invested.
Whilst Janus Henderson believe that the information is correct at the date of publication, no warranty or representation is given to this effect and no responsibility can be accepted by Janus Henderson to any end users for any action taken on the basis of this information.