
Key takeaways:
- Rapid growth in margin debt relative to mortgage and credit card debt is signaling increased speculation and potential risk within financial markets.
- Deglobalization is contributing to renewed inflation pressure as core import prices rise faster than core U.S. consumer prices.
- Opportunities are broadening beyond recent market leaders, with compelling growth across global equities and non-U.S. stocks outperforming venture capital over roughly the past five years.
This summer has seen the return of blockbuster movies. We have also witnessed some “blockbuster” returns, both positive and negative, for investors.
But a Siren Song of quick, riskless, and sizable returns seems to be luring portfolios toward the rocks. Investors may need to put wax in their ears to block out the noise (note the Odyssey reference!).
Here are five no-noise charts to peruse under an umbrella on the beach before napping. Enjoy the remainder of the summer, everyone!
1) Margin debt is growing faster than mortgage or credit card debt!
Monetarist theory suggests that abnormal credit creation precedes abnormal price appreciation. We tend to think of that rule within the context of bank lending, the real economy, and price inflation. However, abnormal credit creation can also lead to abnormal financial markets. Might we have that situation today?
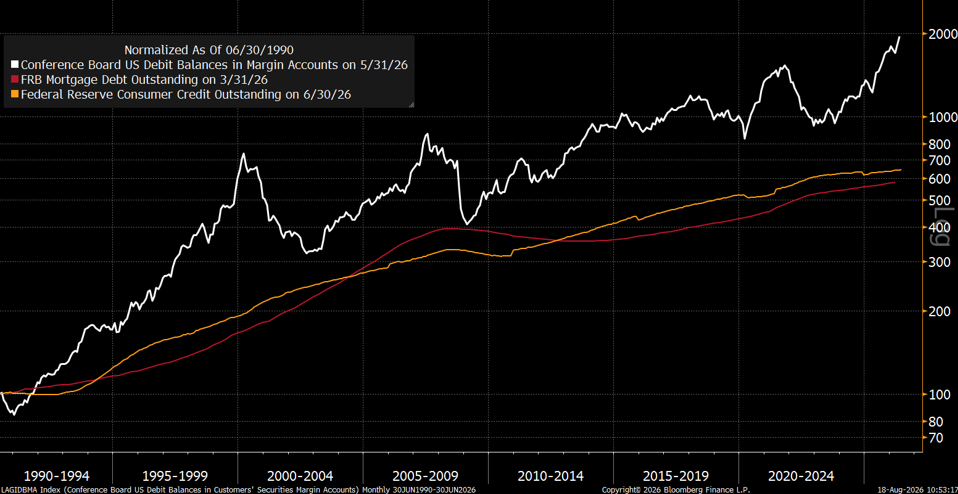
Margin debt, as it has during other speculative periods, is growing considerably faster than either credit card debt or mortgage debt.
Maybe the Federal Reserve (Fed) should consider hiking margin requirements instead of the fed funds rate?
Exhibit 1: Margin debt growth vs. mortgage and credit card debt (June 1990 – June 2026)
Source RBA/JHI, Bloomberg Finance L.P.
2) The U.S. is importing inflation!
Our long-standing deglobalization theme continues to manifest in the global economy and is now contributing to U.S. inflation.
Globalization was perhaps the primary cause of secular disinflation, because globalization opens markets and increases competition. Basic economics states that increasing competition results in lower prices, and roughly 30 years of increasing globalization accordingly led to secular disinflation.
Deglobalization now seems well underway, which means markets are being closed, competition is decreasing, and less competition is resulting in higher prices.
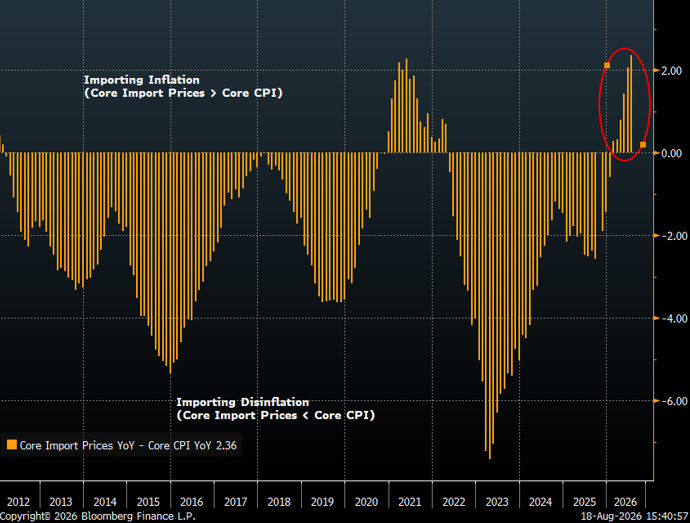
During globalization, economists suggested the U.S. was “importing disinflation” because Core Import Prices were rising more slowly than was the Core U.S. Consumer Price Index (CPI). Today, the reverse is true, and the U.S. is now importing inflation. Core import prices are rising faster than the Core CPI.
Exhibit 2: Core Import Prices YoY – Core CPI YoY (December 2011 – August 18, 2026)
Source RBA/JHI, Bloomberg Finance L.P.
3) You can only find growth in the U.S. WRONG!!!
The favorable story for non-U.S. stocks has long been that they are cheaper than U.S. stocks, but there was not a compelling growth story to accompany that undervaluation. Today, there is one.
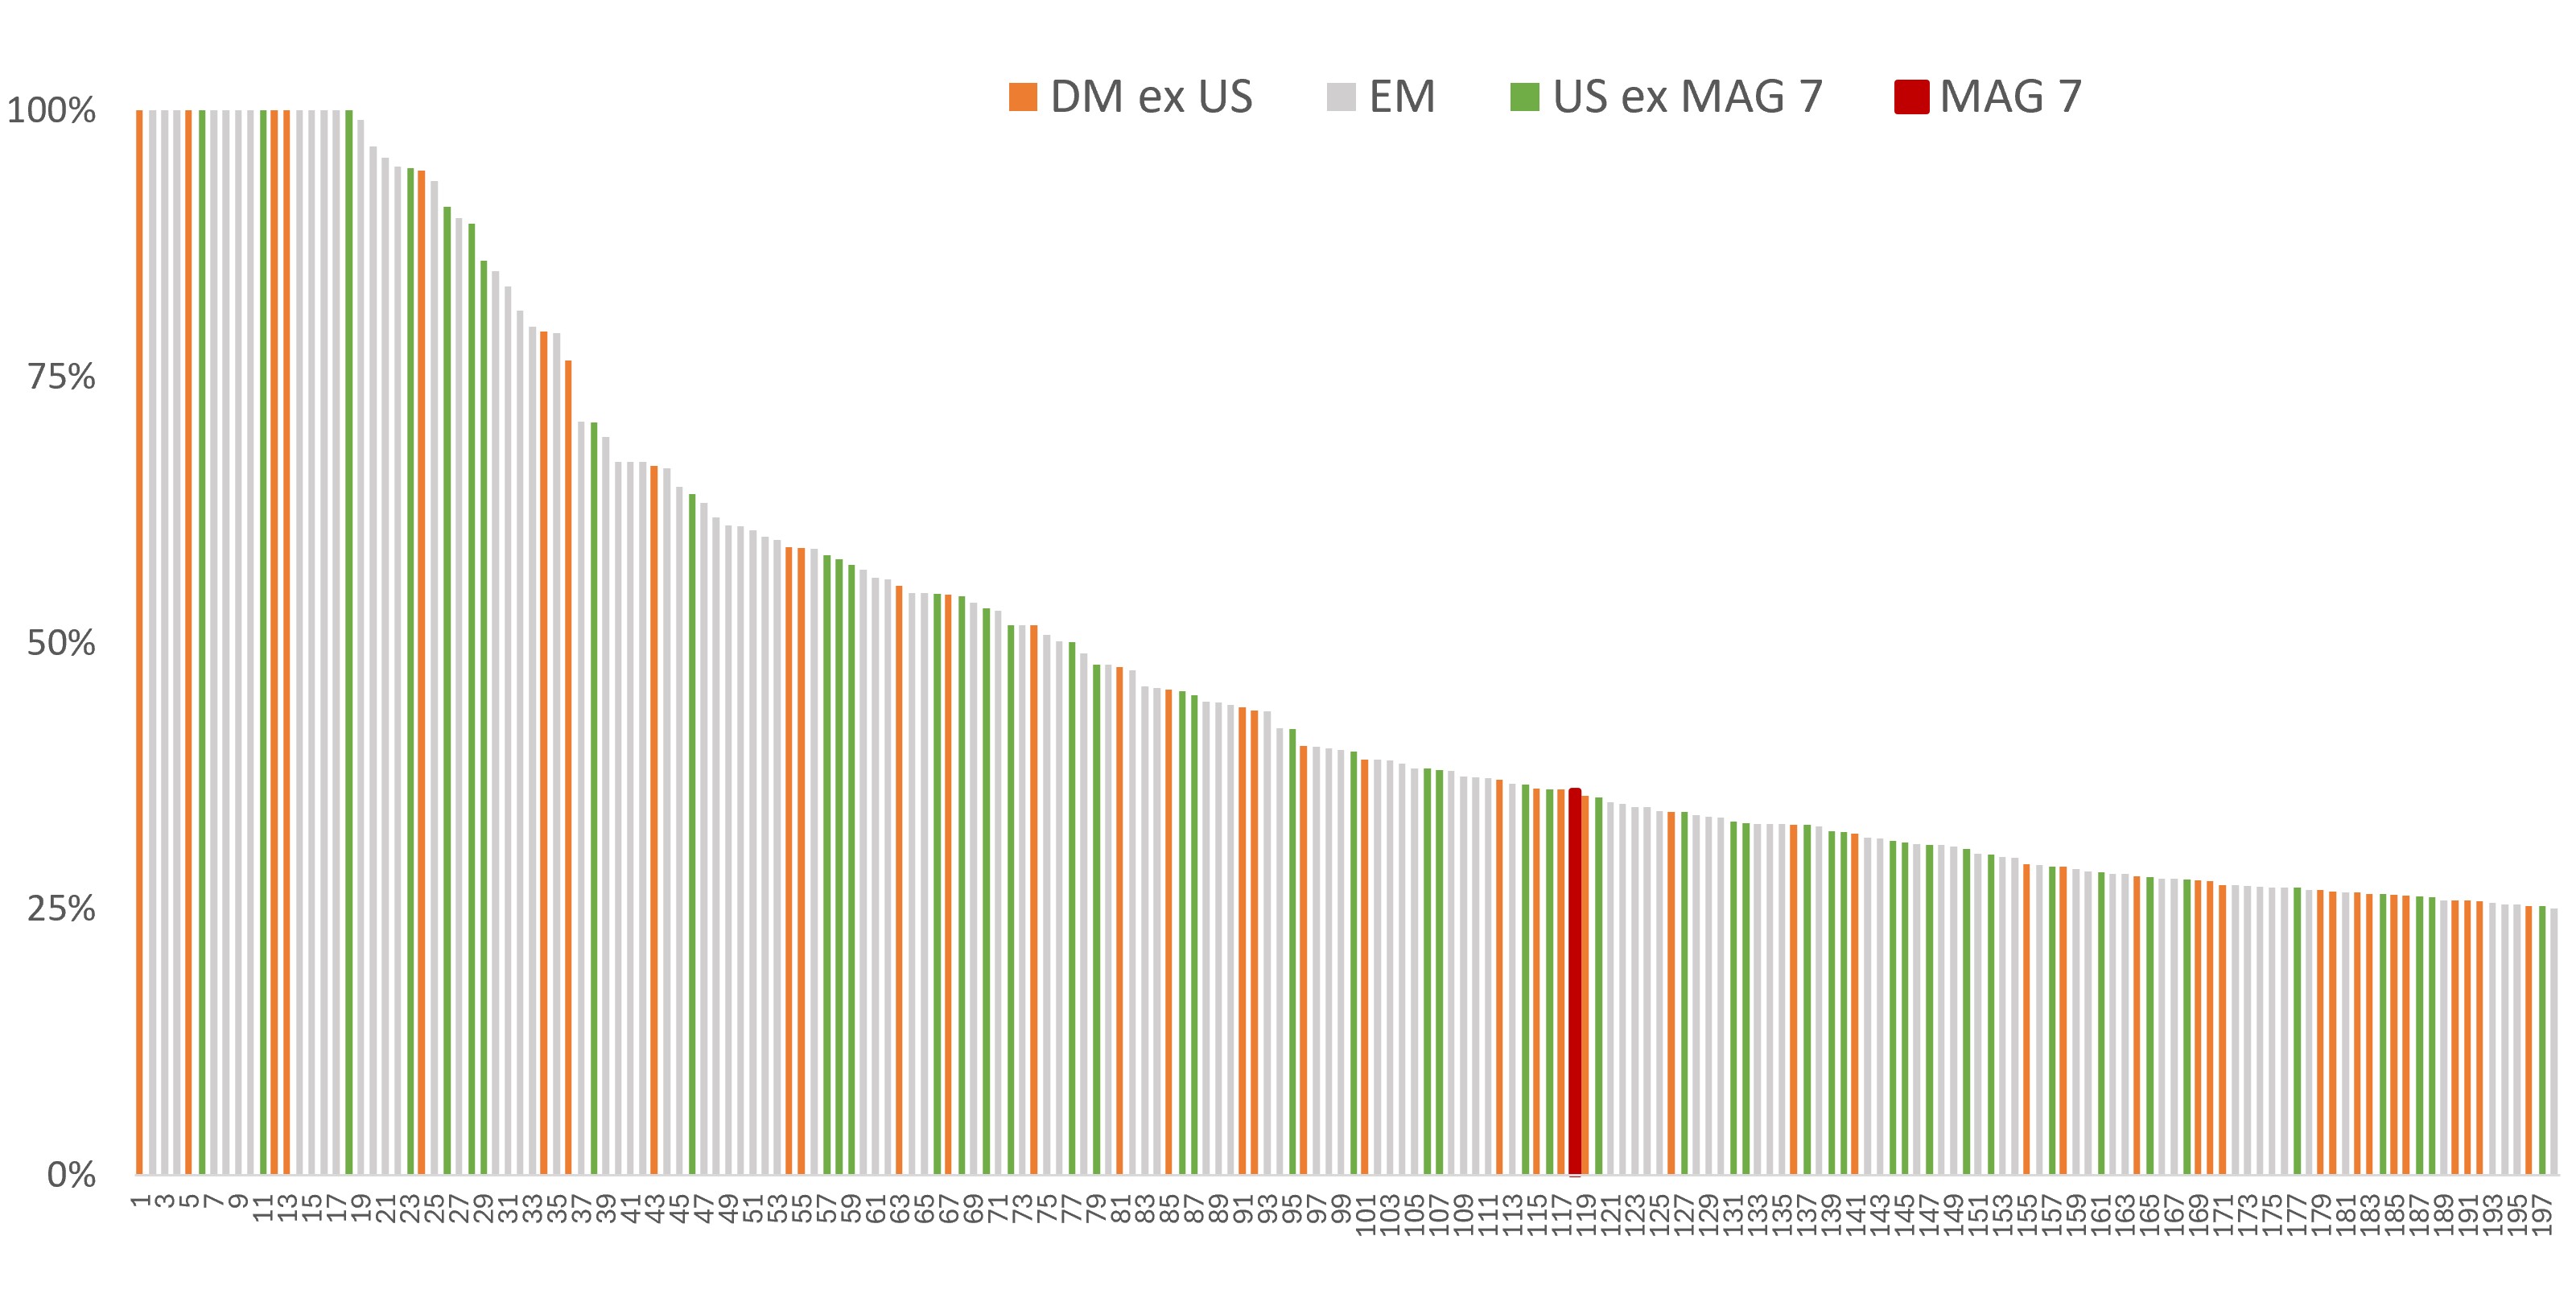
There are presently about two hundred companies around the world that have projected long-term earnings growth rates of 25% or more. Interestingly, only one of the Magnificent 7 companies passes that screen, and analysts are now forecasting strong secular profits growth for companies in the broader U.S. market, in developed markets, and in emerging markets.
Investors’ continued significant underweight to non-U.S. stocks suggests a meaningful investment opportunity.
Exhibit 3: ACWI long-term consensus EPS growth estimates >25%
Source: RBA/JHI, Factset, as of August 17, 2026. ACWI = MSCI ACWI Index (All Country World Index). EPS=earnings per share.
4) Leadership has been so narrow that stocks can diversify stocks!
A portfolio holding many stocks will often have enough diversification to mitigate stock-specific risk, but beta is the market-related risk that remains even within the context of a well-diversified portfolio. A beta greater than 1.0 implies more volatility than that related to the overall market, and a beta less than 1.0 implies less volatility.
It is exceptionally rare to have stocks with negative betas. A negative beta implies that a stock goes up when the market goes down and goes down when the market goes up.
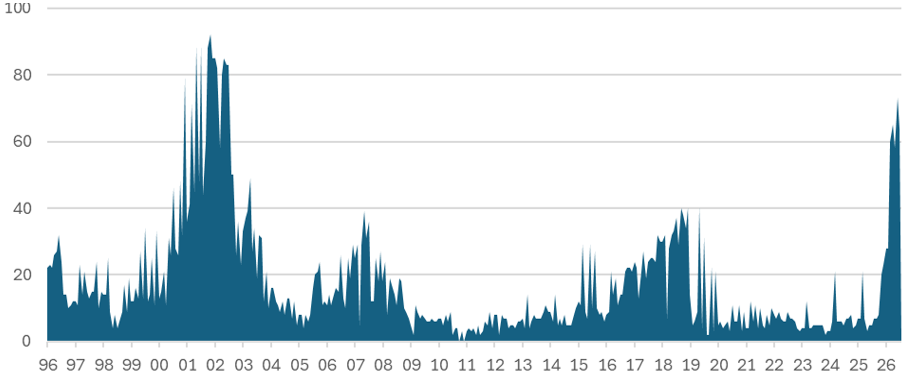
The stock market’s recent narrow leadership, however, has left a near-record number of companies with negative betas. That suggests one can construct an equity portfolio that diversifies equity risk!
That should sound very odd to everyone, but it was true during and after the Tech Bubble, and it’s true again today.
Exhibit 4: Number of stocks in S&P 500® with beta <0, trailing 36m β monthly (December 1995 – July 2026)
Source RBA/JHI, Bloomberg Finance L.P.
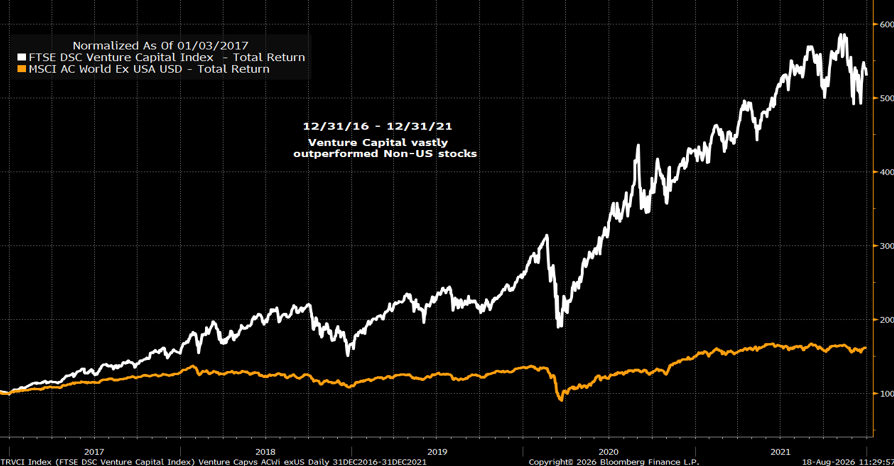
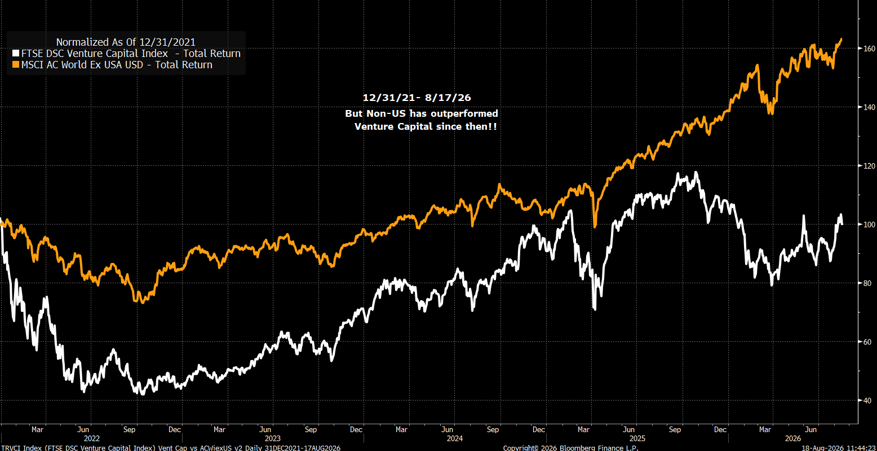
5) A chart few will believe: Non-U.S. stocks have outperformed venture capital over roughly the last 5 years!
Investors have increasingly invested in venture capital because of the asset class’s significant outperformance over the past decade. The level of excitement seemed odd to us when movie stars and professional athletes began to offer their own venture capital funds despite having no investing expertise. Our suspicions now appear to have been warranted.
From 31 December 2016 to 31 December 2021, venture capital outperformed the ACWI ex-U.S. Index by a factor of more than 7X. That massive outperformance led both institutional and individual investors (and movie stars and professional athletes) to favor the asset class.
However, over roughly the past five years, from 31 December 2021 to 13 August 2026, non-U.S. stocks have actually outperformed venture capital!!
Global asset class performance appears to be stealthily changing.
Exhibit 5: Venture capital vs. non-U.S. stocks (December 31, 2016 – December 2021)
December 31, 2021 – August 13, 2026
Source RBA/JHI, Bloomberg Finance L.P.
Beta measures the volatility of a security or portfolio relative to an index. Less than one means lower volatility than the index; more than one means greater volatility.
Consumer Price Index (CPI) is an unmanaged index representing the rate of inflation of the U.S. consumer prices as determined by the U.S. Department of Labor Statistics.
FTSE DSC Venture Capital Index: The FTSE DSC Venture Capital Index is designed to track the gross economic returns and valuation movements of the U.S. venture capital universe using a portfolio of correlated, publicly traded asset sectors.
MSCI ACWI ex USA Index: The MSCI All Country World Index (ACWI) ex USA is a free-float-adjusted, market-capitalization-weighted index designed to measure the equity-market performance of global developed and emerging markets excluding the Unites States.
IMPORTANT INFORMATION
Equity securities are subject to risks including market risk. Returns will fluctuate in response to issuer, political and economic developments.
Diversification neither assures a profit nor eliminates the risk of experiencing investment losses.
Foreign securities are subject to additional risks including currency fluctuations, political and economic uncertainty, increased volatility, lower liquidity and differing financial and information reporting standards, all of which are magnified in emerging markets.
All opinions and estimates in this information are subject to change without notice and are the views of the author at the time of publication. Janus Henderson is not under any obligation to update this information to the extent that it is or becomes out of date or incorrect. The information herein shall not in any way constitute advice or an invitation to invest. It is solely for information purposes and subject to change without notice. This information does not purport to be a comprehensive statement or description of any markets or securities referred to within. Any references to individual securities do not constitute a securities recommendation. Past performance is not indicative of future performance. The value of an investment and the income from it can fall as well as rise and you may not get back the amount originally invested.
Whilst Janus Henderson believe that the information is correct at the date of publication, no warranty or representation is given to this effect and no responsibility can be accepted by Janus Henderson to any end users for any action taken on the basis of this information.