
Key takeaways:
- Global equities fell sharply in March, with Asia and Europe leading the decline after strong gains to start the year. Energy stood out as the lone bright spot amid a surge in oil prices, while other sectors were broadly lower.
- Global sovereign bonds also declined as yields rose across major markets. Global corporate bonds and securitized assets were broadly lower as spreads widened amid heightened macro uncertainty.
- The Iran conflict dominated the market narrative. Fast-moving geopolitical developments whipsawed markets, while the sharp rise in oil prices fueled inflation concerns and triggered a hawkish repricing of central bank expectations. The combination of rising energy costs and slowing growth reignited stagflation fears, though markets found late-month support from hopes of a near-term resolution to the conflict.
Market overview
Global equities declined sharply in March, posting their worst monthly performance in several years as the Middle East conflict escalated following coordinated U.S.-Israeli strikes at the end of February, triggering a broad risk‑off move. The MSCI World Index fell 6.3% in U.S. dollar terms, its largest monthly drop since 2022, with losses steepest in Europe and Asia following strong gains to start the year. Global government bonds also sold off as surging energy prices pushed inflation expectations higher and forced investors to reassess the global interest rate outlook. Global corporate bonds declined alongside sovereign markets as credit spreads widened amid weaker risk sentiment.
Oil prices surged following the disruption to global energy supply, with Brent crude futures rising more than 60% and WTI crude topping $100 a barrel for the first time since 2022. The U.S. Dollar Index strengthened against global currencies, supported by safe-haven demand and petro-dollar dynamics. Gold reversed February’s strong gains, declining as higher rates weighed on non‑yielding assets.
Global equities fell sharply in March, particularly outside the U.S.
The MSCI World Index had its worst month since 2022, with Europe and Asia leading the declines after strong gains to start the year.
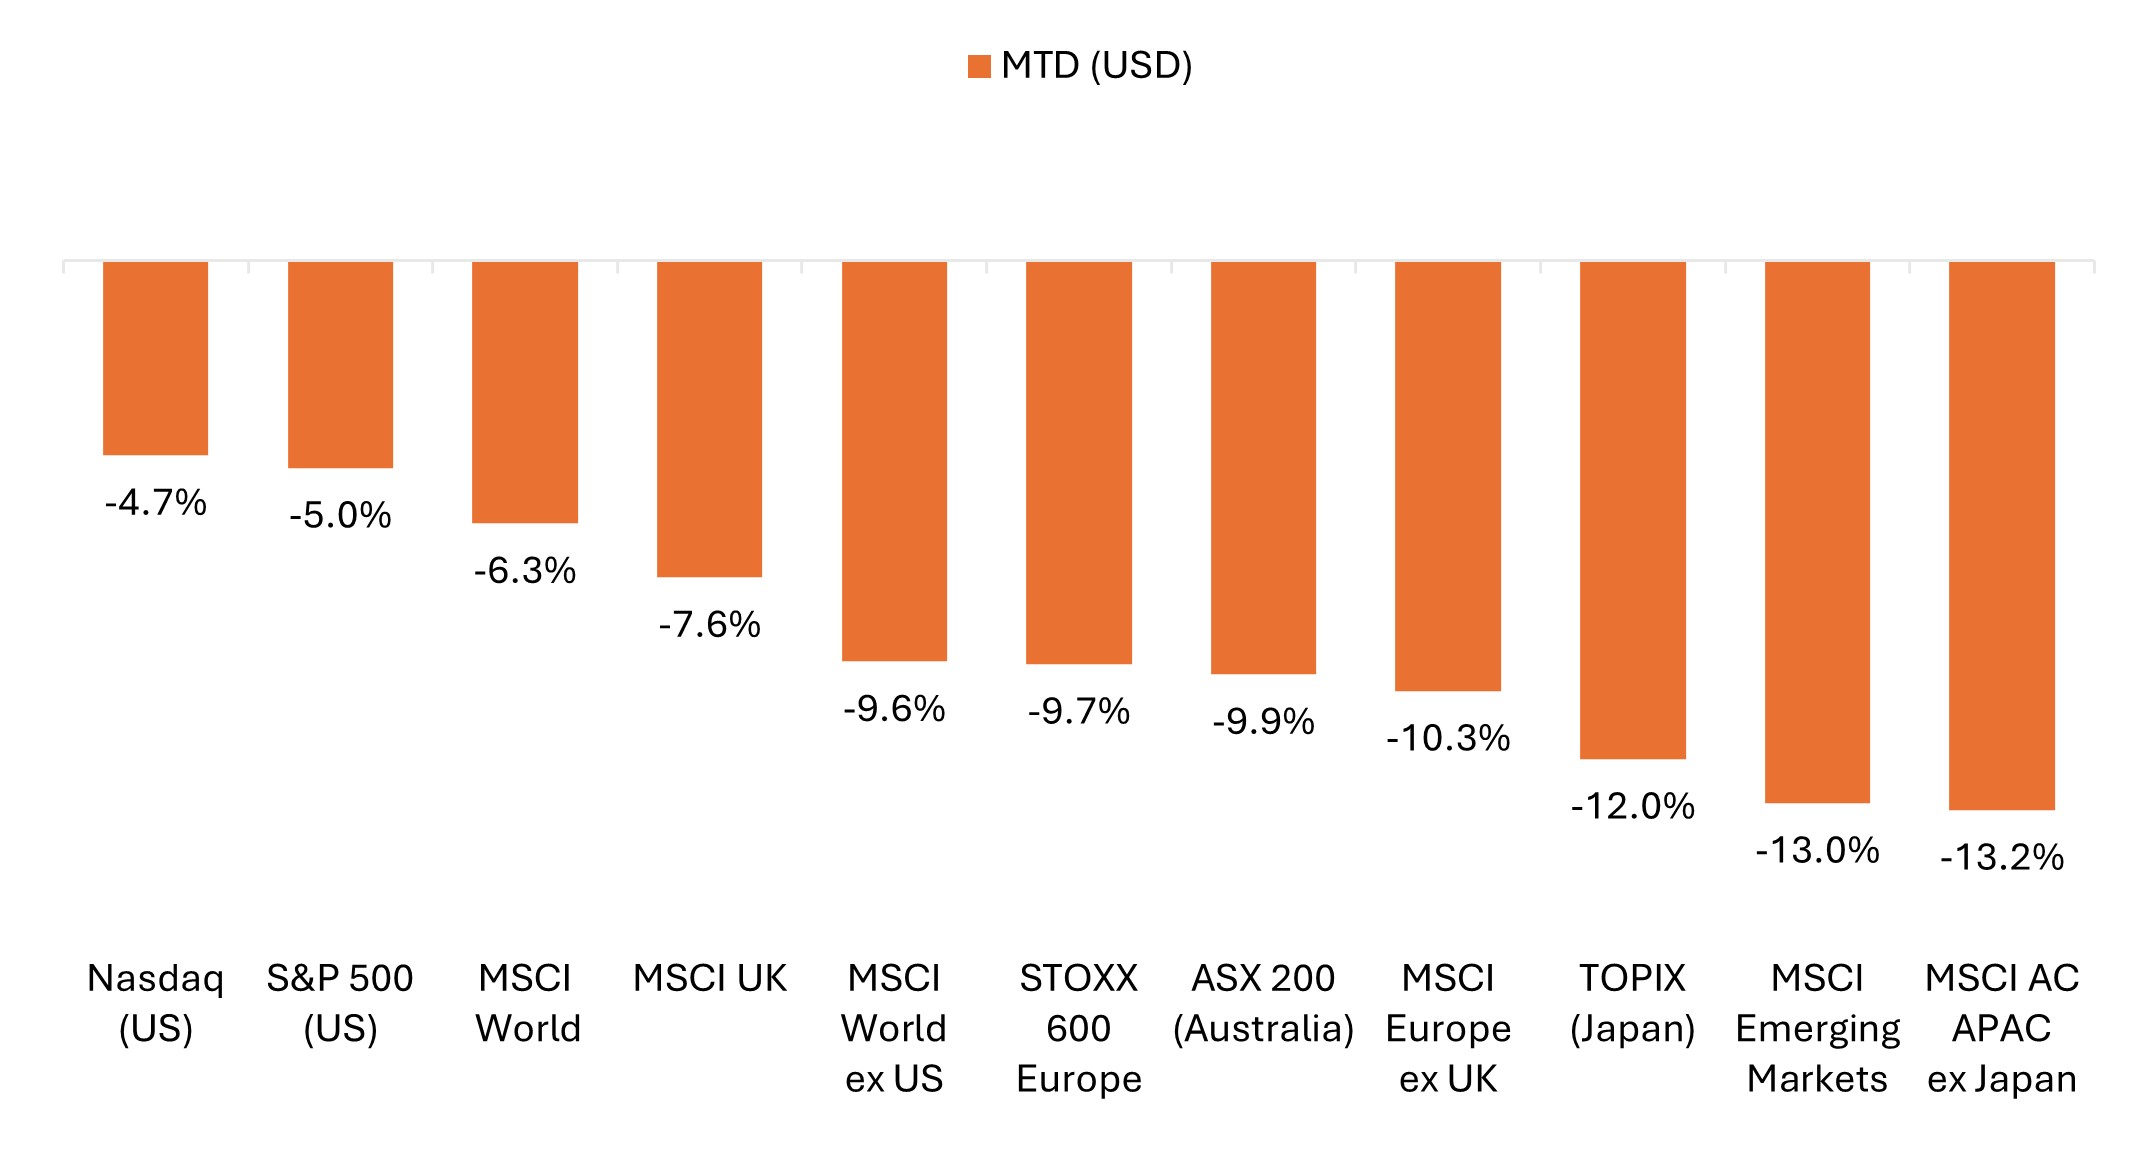
Source: Bloomberg, data from 28 February 2026 to 31 March 2026. Represents index total returns in U.S. dollar terms. Past performance is no guarantee of future results.
Key themes that mattered for markets
- Iran conflict dominated the narrative: The Middle East conflict and effective closure of the Strait of Hormuz – a vital artery for global oil supply – drove a risk‑off shift, with March trading marked by headline-driven swings. Sometimes pointing to de-escalation, other times ratcheting up threats, news flow was relentless and often contradictory. The month closed on an optimistic note as President Trump said the U.S. is willing to end the war even without a full reopening of the Strait of Hormuz, while Iranian President Pezeshkian signaled readiness to halt the war in exchange for security guarantees.
- Oil, bond yields, and U.S. dollar higher; (practically) everything else lower: March left investors with few places to hide. Energy stood out as the lone bright spot across global equities, while bonds sold off as yields jumped on expectations that higher interest rates may be needed to counter oil-driven inflation pressures. Gold posted its worst monthly performance since 2008, while the U.S. dollar rose against most major currencies, supported by safe-haven flows and petro-dollar dynamics.
- Stagflation concerns resurfaced: The surge in crude prices sparked concerns about renewed inflation pressures and knock-on effects to broader economic activity, particularly for energy-importing countries. While central bank officials, including Federal Reserve (Fed) Chair Powell, resisted direct comparisons to the 1970s, markets grew increasingly sensitive to the risks posed by a prolonged energy disruption.
- Hawkish repricing of central bank expectations: Investors aggressively unwound 2026 rate‑cut bets and, in some cases, flipped to pricing in hikes. Markets shifted to anticipating rate increases in the UK and Europe in coming months, while Fed easing was almost fully priced out by month end. For their part, central bank officials and economists largely pushed back, cautioning that markets may have gotten ahead of themselves and emphasizing more two‑sided risks to inflation and growth.
Market‑implied rate cuts/hikes by end of 2026
Change in expected policy rates, percentage points
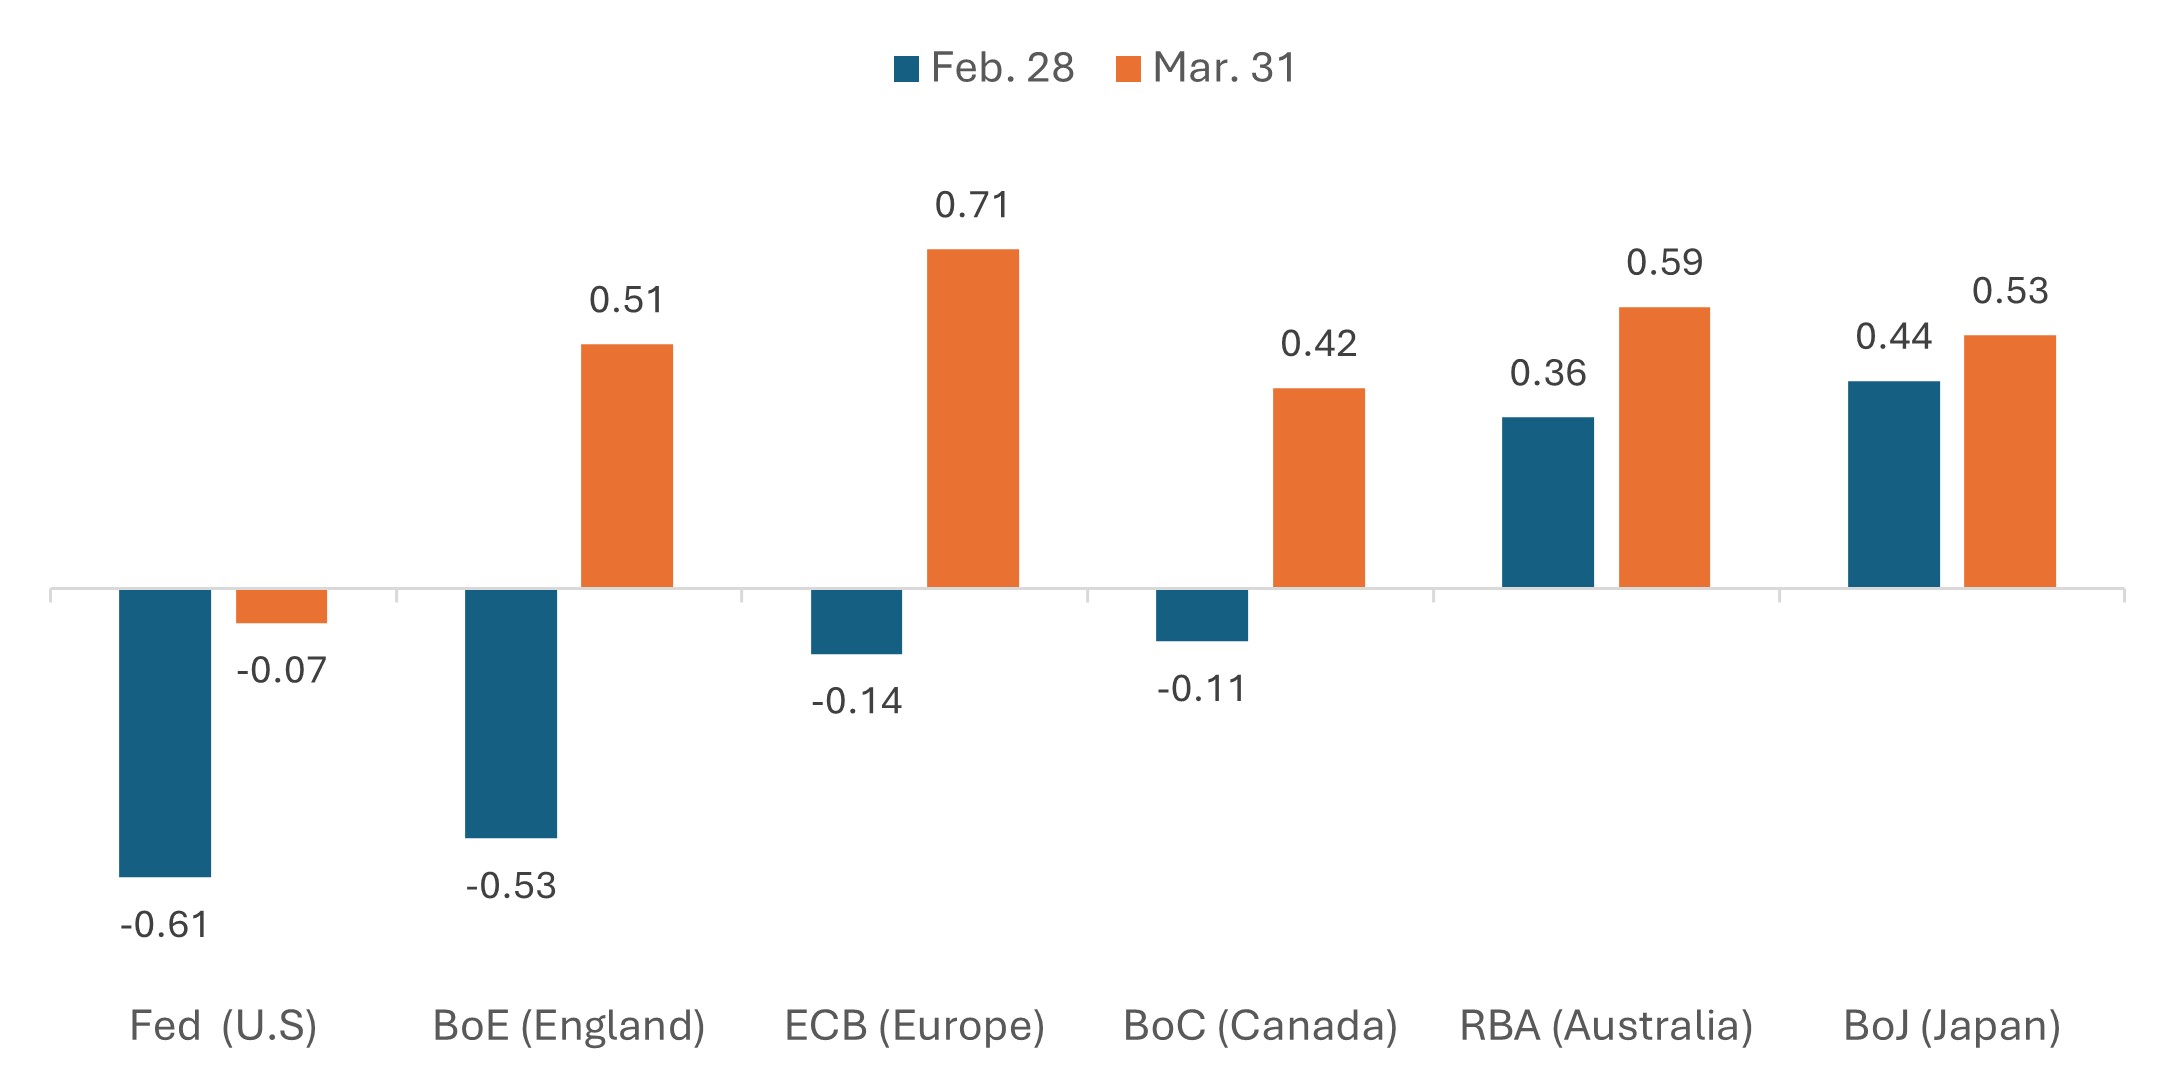
Source: Bloomberg, as of 31 March 2026. Past performance is no guarantee of future results.
- Among the positives, resilient earnings expectations and M&A momentum supported longer-term optimism: Despite heightened macro uncertainty, analysts largely maintained outlooks, with S&P 500® Index estimates still pointing to double-digit earnings growth. Deal activity also remained strong in March, with multi‑billion‑dollar transactions announced across pharmaceuticals, consumer goods, and beverages, reflecting continued confidence in longer‑term fundamentals.
United States
U.S. equities fell in March as rising bond yields, elevated energy prices, and softer economic data weighed on sentiment. Losses were broad-based across styles and market capitalizations. Energy stood out as the lone advancer (driven by the surge in oil prices), with some of the month’s worst-performing sectors those that saw strong gains to start the year. A relief rally on the final day of March trading helped widen U.S. stocks’ outperformance relative to overseas markets after late-breaking headlines spurred optimism for a near-term end to the Iran conflict.
- The S&P 500 fell 5.0%, though the decline was cushioned by a nearly 3% rally on the last day of March trading.
- The equal-weight S&P 500 declined 6.0%, trailing the official cap-weighted benchmark for the first time since October.
- The Nasdaq Composite fell 4.7%, adding to February’s losses and posting its largest monthly decline since March 2025.
- The Russell 2000 declined 5.0% but remained modestly higher on the year after small caps outperformed large caps during the prior two months.
- Growth lagged value for a fifth straight month, with the Russell 1000 Growth Index falling 5.2% versus a 4.8% decline for its value counterpart. Year to date, the large-cap value benchmark remained up more than 2% through March, while the growth benchmark had fallen nearly 10% over that timeframe.
Energy extended its big year-to-date rally, while other sectors fell
S&P 500 sector performance (March & year to date)
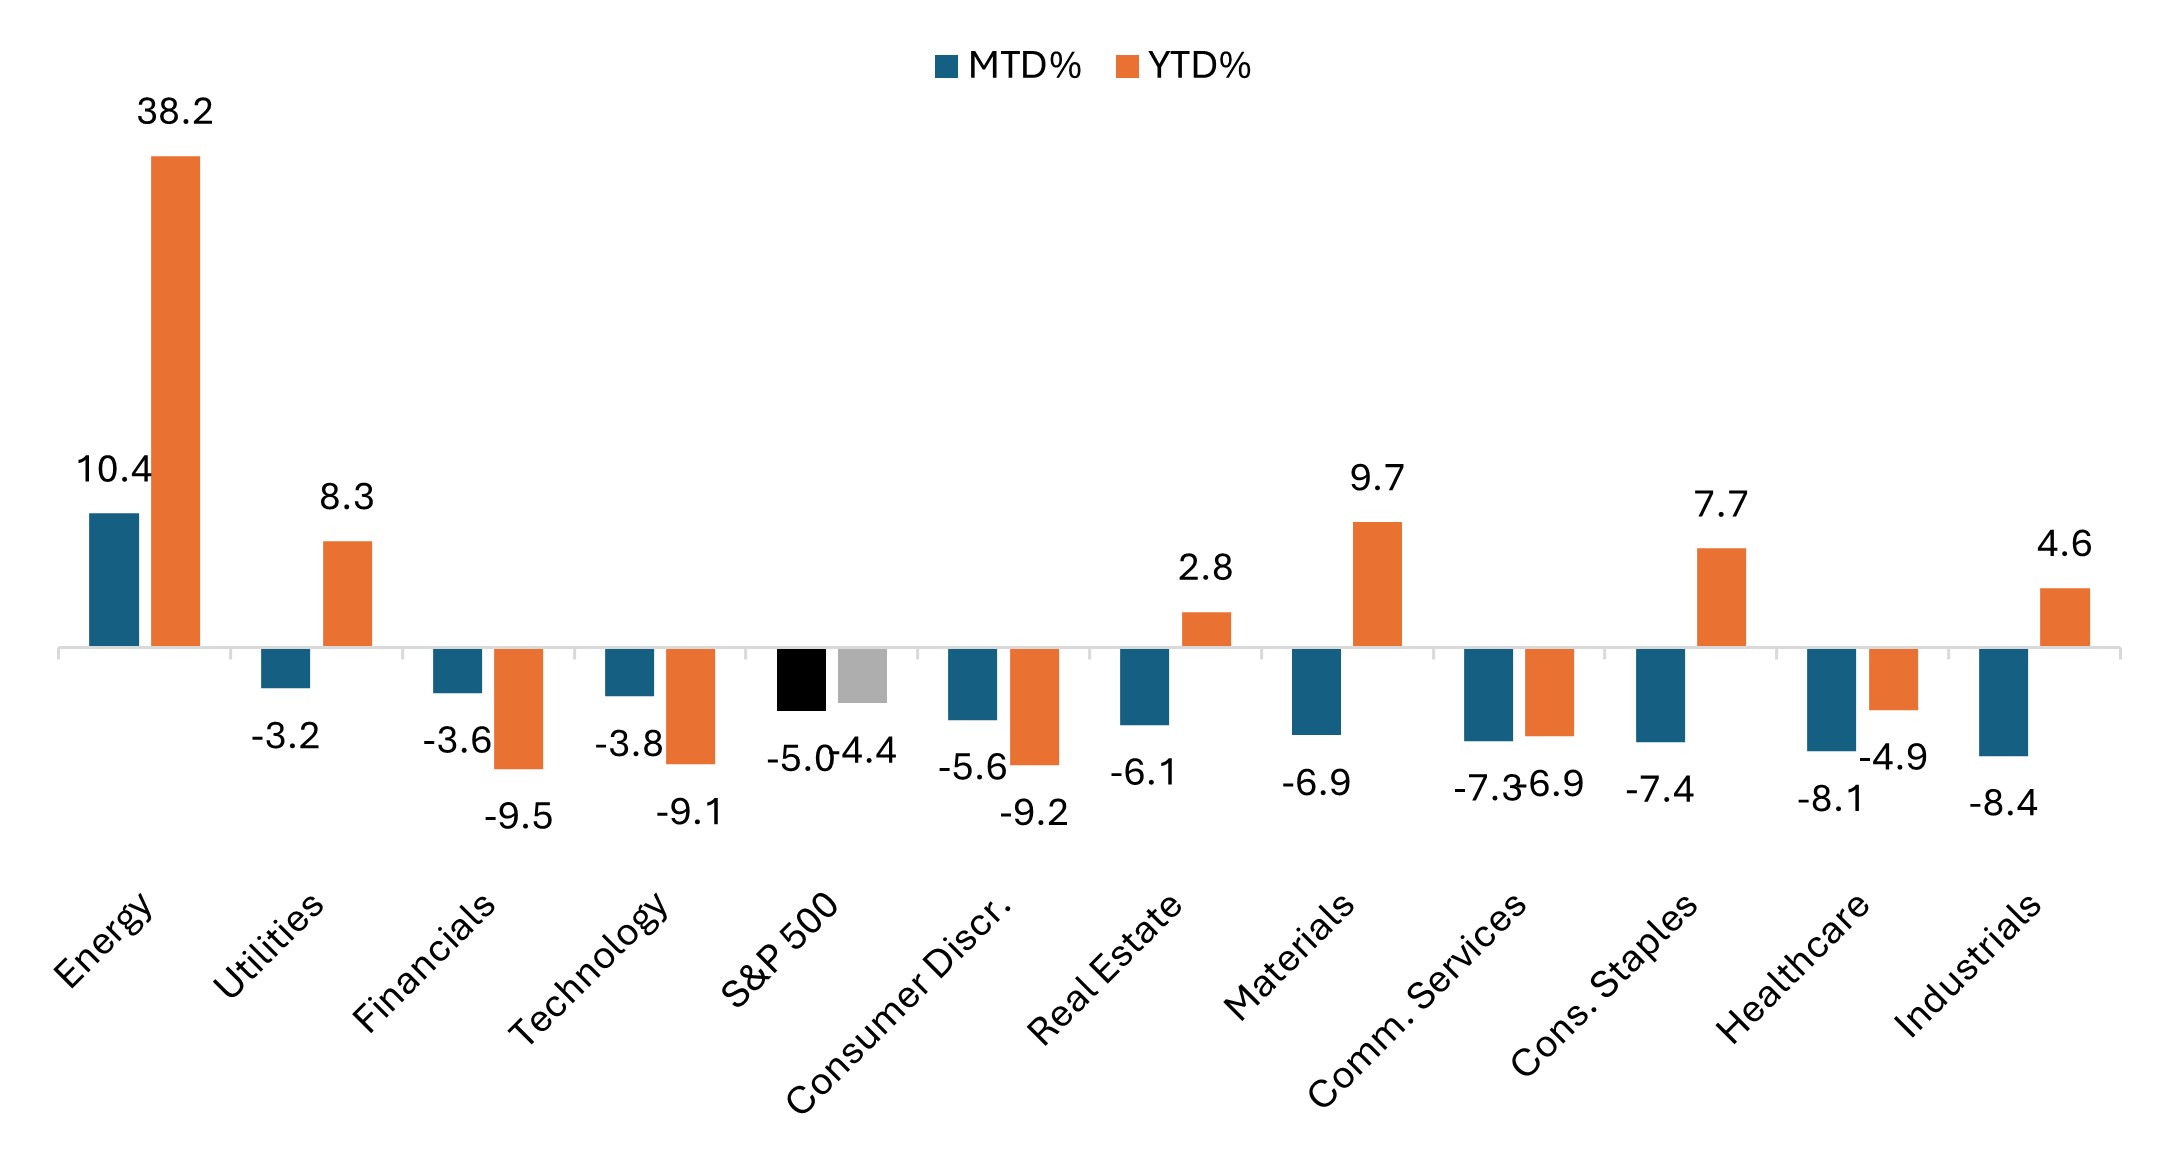
Source: Bloomberg, as of 31 March 2026. Past performance is no guarantee of future results.
U.S. economic data pointed to a softer growth backdrop, while the Iran conflict complicated the policy outlook:
- The Fed held policy steady, as expected. While officials kept one rate cut penciled in for later this year, markets dialed back easing expectations amid the surge in oil prices.
- Labor market data softened. February nonfarm payrolls unexpectedly declined by 92,000 while the unemployment rate ticked up to 4.4% from 4.3%.
- Inflation readings were mixed. The February Consumer Price Index (CPI) held steady at 2.4% year over year, meeting expectations, though data did not yet reflect the spike in oil prices from the Middle East conflict. In contrast, the Producer Price Index (PPI) surprised to the upside, rising 0.7% month over month, accelerating from January’s 0.5% increase.
- Growth indicators continued to lose momentum. U.S. Gross Domestic Product (GDP) growth for the fourth quarter was revised down to 0.7% (from an initial +1.4% estimate), and March flash Purchasing Managers’ Index (PMI) data signaled further deceleration in activity as a spike in prices weighed on demand.
Europe
Eurozone equities declined sharply in March as markets absorbed the economic implications from higher energy prices. The MSCI Europe ex United Kingdom Index fell 8.2% in euro terms and 10.3% in U.S. dollars. Investor sentiment deteriorated as the energy shock and a higher interest rate backdrop raised concerns about growth across the region.
- The ECB left policy rates unchanged, as expected, but highlighted heightened uncertainty stemming from the Middle East conflict. While policymakers maintained a cautious tone, markets increasingly priced in the risk that persistent energy‑driven inflation could force renewed tightening.
- Inflation pressures re‑ Eurozone CPI rose to 1.9% year over year in February, while Eurostat’s flash estimate showed inflation jumped 2.5% in March driven by rising energy costs.
- Growth momentum softened. Eurozone GDP growth for the fourth quarter was revised down to 0.2% (from the initial +0.3% estimate), while confidence indicators deteriorated as higher energy prices weighed on sentiment.
- While Eurozone February PMIs pointed to modest expansion, the March flash Composite PMI declined from 51.9 to 50.5, its lowest reading in 10 months. The slower growth alongside sharply higher input costs added to stagflation concerns.
UK equities also declined amid higher bond yields, slowing economic momentum, and a sharp repricing of Bank of England (BoE) policy expectations. The MSCI United Kingdom Index fell 5.9% in sterling terms and 7.6% in U.S. dollars as the greenback strengthened against the pound. The FTSE All-Share Index declined 6.7% in local currency terms and 8.4% in U.S. dollars.
- The BoE held policy rates steady, as expected, though the unanimous decision was read as more hawkish than markets anticipated. Policymakers emphasized vigilance on inflation risks, prompting investors to price in a greater likelihood of rate hikes this year.
- While the UK unemployment rate held steady at 5.2%, wage growth slowed sharply in the three months to January, offering some relief on domestic inflation pressures even as headline risks intensified.
- Growth momentum stalled. UK GDP was flat in January, undershooting expectations for 0.2% growth and reinforcing concerns that the economy had little buffer ahead of the energy shock triggered later in the quarter.
- The UK flash Composite PMI for March fell to 51.0 from 53.7 in February, with firms reporting surging input costs linked to higher energy prices and a sharp slowdown in activity.
- UK bond yields surged, with the 10-year gilt yield hitting its highest level since 2008 as markets repriced the inflation outlook.
European equities fell in March, with Germany and France the worst performers
Dollar strength magnified losses in U.S. dollar terms.
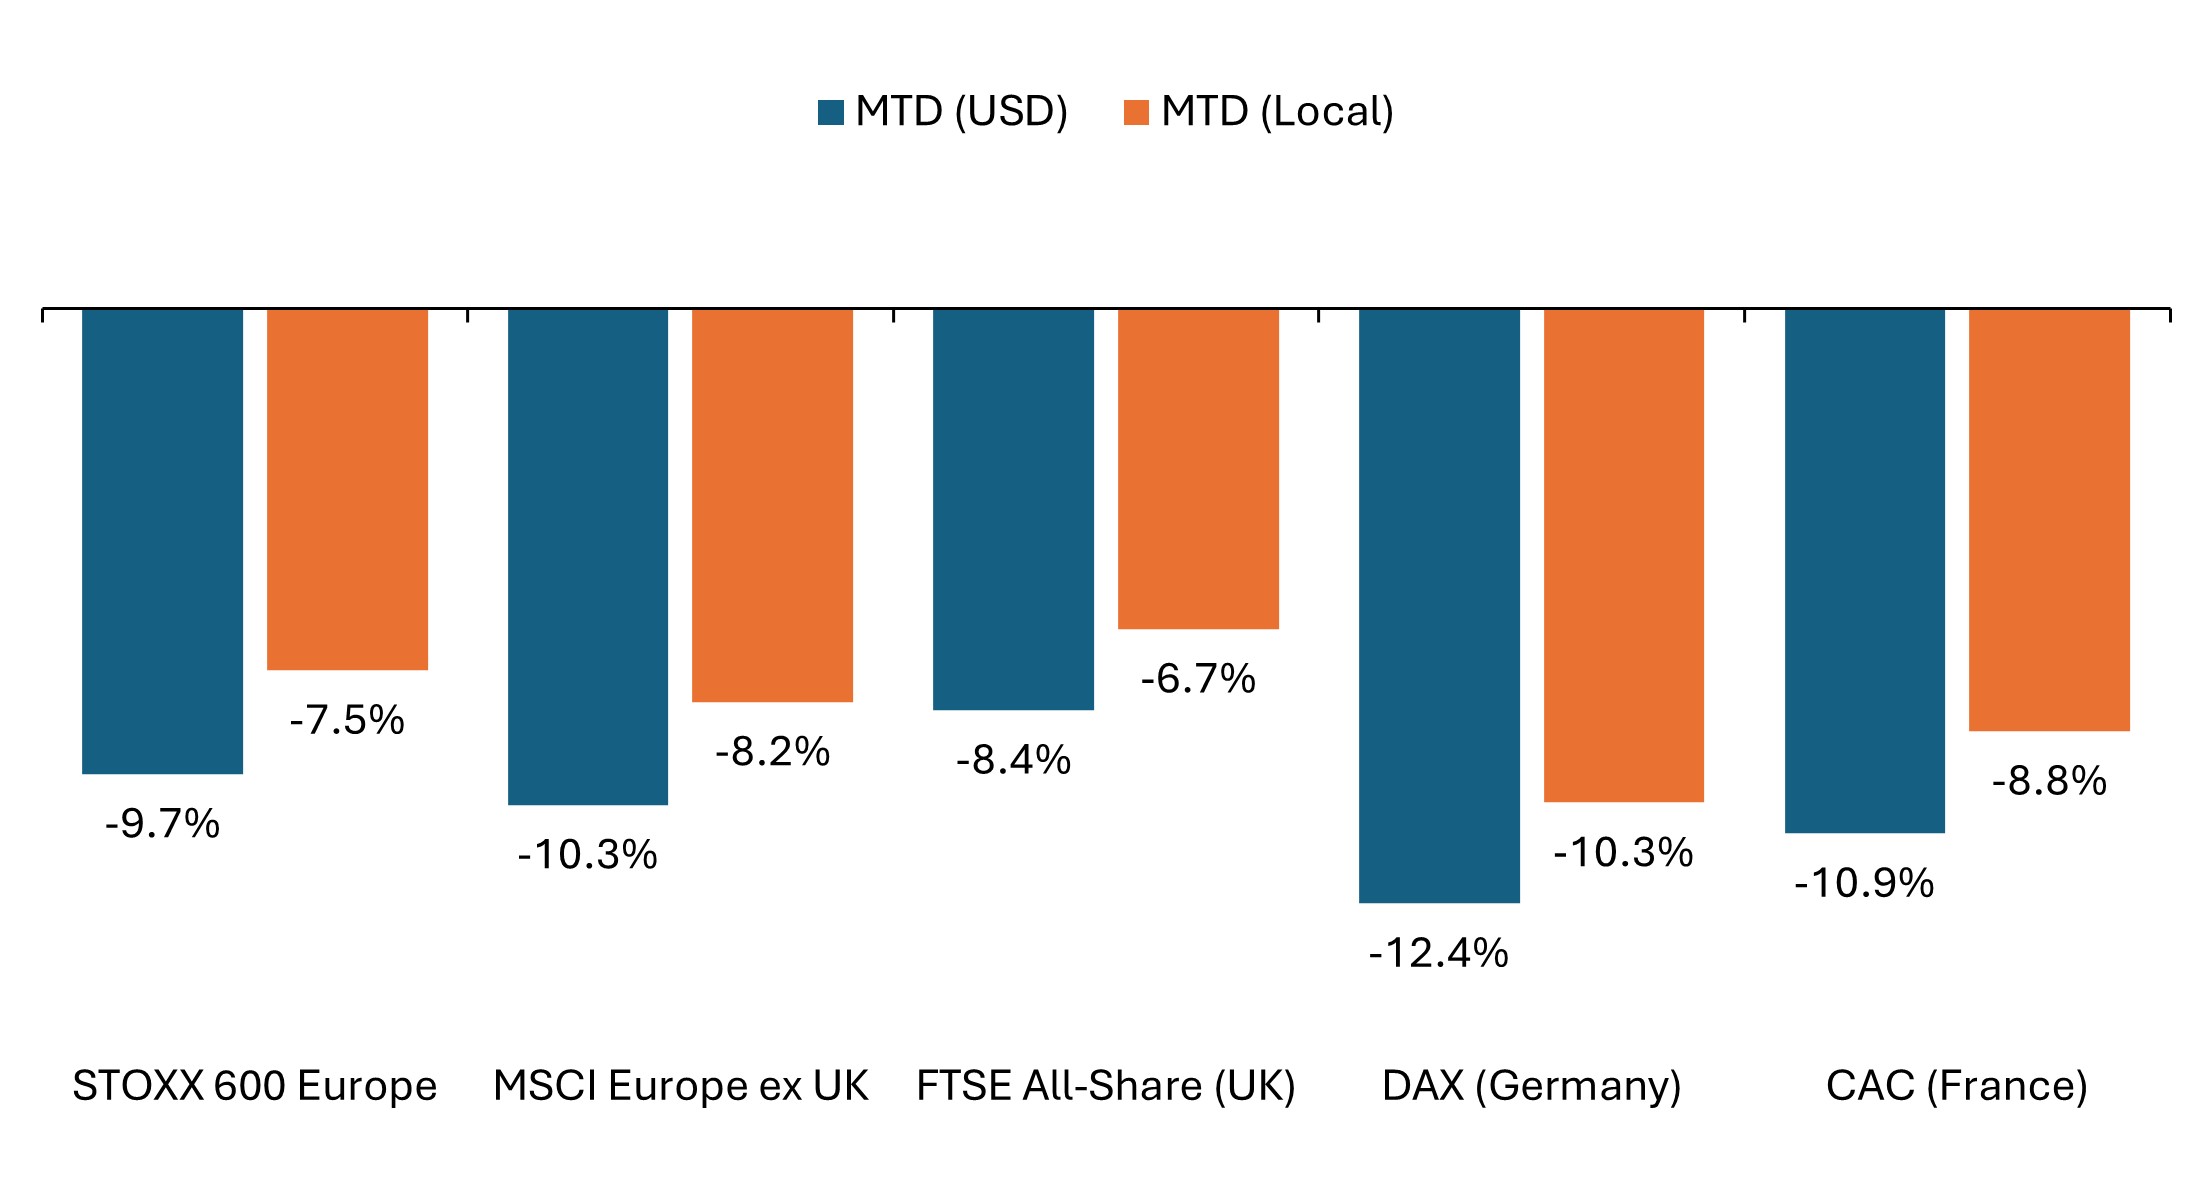
Source: Bloomberg, data from 28 February 2026 to 31 March 2026. Past performance is no guarantee of future results.
Across the STOXX 600 Index – comprising companies from 17 countries across developed Europe including the UK – sector performance was broadly negative, with energy the lone bright spot.
- Energy (+14.8% in euro terms) stood out as the lone gainer amid the surge in crude prices, while Chemicals (-2.4%) held up better than most owing in part to tighter supply dynamics from the Strait of Hormuz closure. Defensive sectors such as Utilities (-3.3%) and Telecom (-3.4%) also saw more modest declines, aided by electrification and data-center infrastructure trends.
- Financial Services (-6.0%) and Banks (9.6%) added to February’s declines. Healthcare fell (-7.1%), while Basic Resources (-8.2%) gave back strong gains from the prior month. Media (-9.0%) and Technology (-9.5%) also came under pressure.
- Consumer (-14.1%) saw the steepest declines, followed by Personal Care, Drug & Grocery (-13.9%), Real Estate (-13.8%), Auto Parts (-12.7%), Construction & Materials (-12.1%), Retail Price (-12.0%), and Industrials (-11.6%).
Asia Pacific
Japanese equities declined sharply in March as higher energy prices and rising yields offset earlier optimism around supportive domestic policy. The TOPIX declined 10.4% in yen terms and 12.0% in U.S. dollars, while the Nikkei 225 fell 12.7% in yen terms and 14.3% in dollars. Both benchmarks remained modestly higher on the year after setting fresh record highs in February.
- The BoJ held policy steady at its March meeting, as expected. Despite flagging the Iran conflict as a key downside risk to the economic outlook, officials left an April rate hike on the table.
- Revised data showed Japan’s economy entered the year with modest momentum. Q4 GDP was upgraded to a 1.3% annualized pace, offering some support to the BoJ’s gradual normalization stance despite rising external risks.
- Tokyo core inflation eased to 1.7% in March, below the BoJ’s 2% target for a second consecutive month, partly cushioned by government fuel subsidies and the removal of Tokyo’s gas tax surcharge.
Asia Pacific ex Japan equities recorded some of the steepest losses globally as energy import dependence, currency weakness, and supply chain disruptions weighed heavily on the region. The MSCI AC Asia Pacific ex Japan Index fell 13.2% in U.S. dollar terms. South Korea came under outsized pressure, erasing February’s more than 20% gain, though it remained up roughly 50% over the last six months. Australia’s ASX 200 fell 9.9% in U.S. dollar terms and 6.9% in local currency terms. The Reserve Bank of Australia (RBA) hiked rates by 25 basis points (bps) for a second straight meeting. Business activity deteriorated, with Australia’s flash Composite PMI for March dropping to 47.0 (from 52.4 in February), marking its first contraction in 18 months as cost pressures intensified. The MSCI China Index declined 7.7% in U.S. dollar terms. China held up better than regional peers as the country’s PMI data showed expansion in March, while strategic oil stockpiling ahead of the Iran conflict helped insulate the economy from the immediate energy shock.
Emerging Markets
Emerging market equities ended broadly lower in March as the Iran conflict exposed vulnerabilities tied to energy import dependence, currency depreciation, and rising inflation pressures across the developing world. The MSCI Emerging Markets Index fell 13.0% in U.S. dollar terms, erasing year-to-date gains and marking its steepest monthly decline since the onset of the pandemic in March of 2020. Performance figures below reference MSCI country indices reported in U.S. dollar terms.
- Technology-led markets MSCI South Korea (-24.6%) and Taiwan (-12.8%) gave back February’s strong gains, though both remained solidly higher on the year.
- Latin America equities showed mixed performance, with the MSCI EM Latin America Index declining 4.3% in U.S. dollar terms. The region’s status as a net energy and commodity exporter provided a structural advantage as surging oil prices benefited producers like Brazil (-1.8%) and Colombia (+8.5%). Argentina (+14.1%) outperformed after lagging last month, while Mexico lagged (-8.3%).
- In EMEA, South Africa (-18.0%) fell sharply as a steep drop in gold and silver prices weighed on precious metal miners, while the Iran conflict raised concerns around a potential energy crisis.
- India (-14.5%) underperformed, with declines exacerbated by the nation’s heavy reliance on energy imports. The surge in oil prices pushed the rupee to record lows and intensified scrutiny of current account dynamics amid rising inflation pressures.
Fixed Income
Global government bonds experienced a broad selloff in March as concerns around oil-driven inflation pressures forced a reassessment of global monetary policy. Sovereign bond yields rose sharply across major economies, particularly in Europe, as markets shifted to pricing in the possibility of rate hikes from the European Central Bank (ECB) as soon as April. UK gilt yields jumped the most as expectations for two BoE rate cuts in 2026 gave way to markets pricing in more than 50 bps of rate increases this year.
- The Bloomberg Global Treasury Index declined 1.9% in U.S. dollar terms as yields pushed higher across the United States, Europe, and the United Kingdom.
- The U.S. Treasury curve bear flattened as yields moved higher across maturities. The spread between 10-year and 2-year yields narrowed from 59 bps at the start of the month to 51 bps by the month’s end.
- The U.S. 10-year Treasury yield rose 33 bps, ending the month at 4.3%.
U.S. Treasury yield curve (month-on-month change)
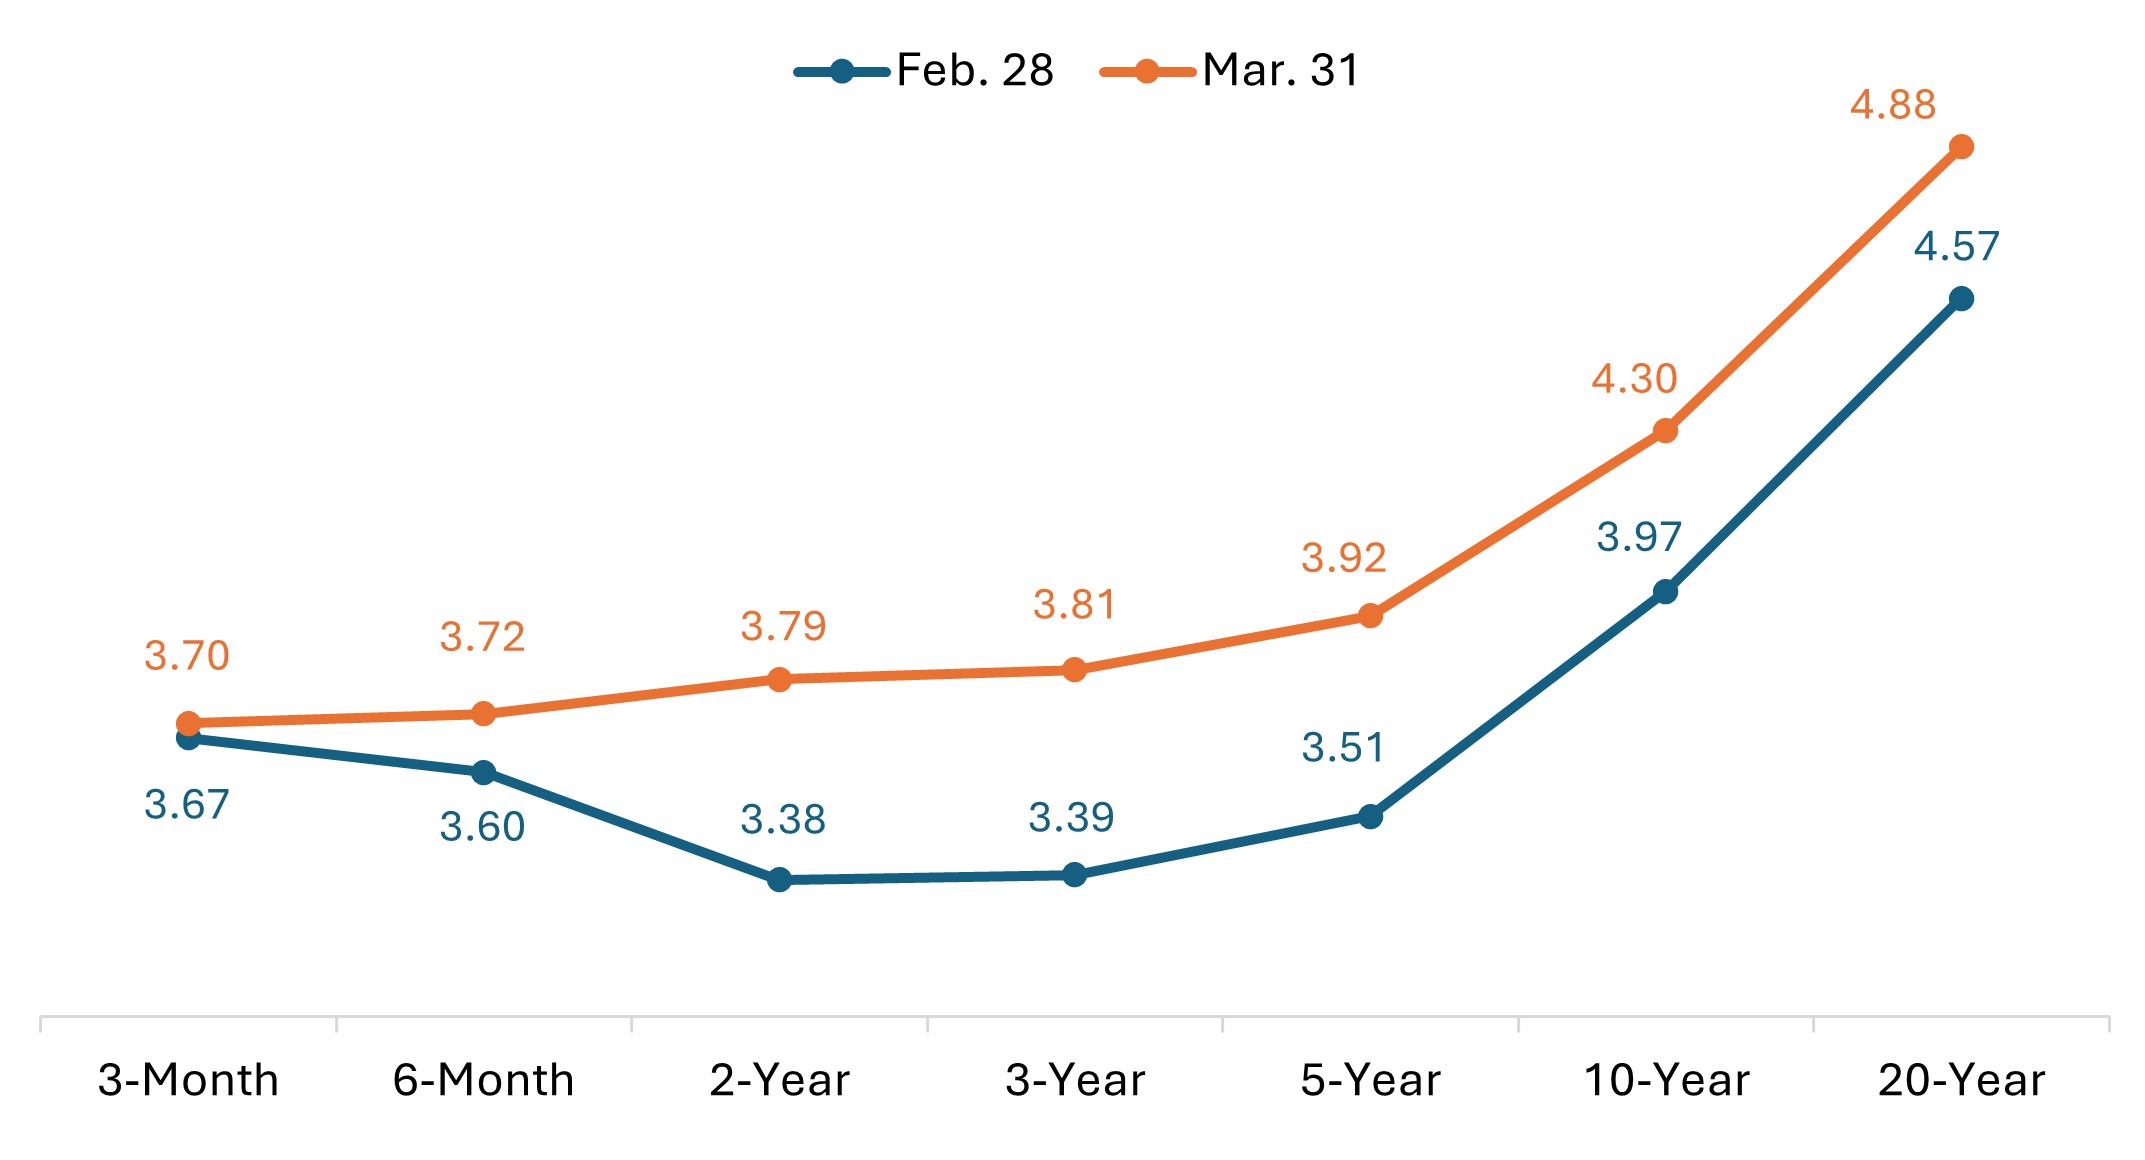
Source: Bloomberg, U.S. Treasury, as of 31 March 2026. Past performance is no guarantee of future results.
- In Europe, UK government bonds underperformed. The 10-year gilt yield rose by 68 bps, at one point topping 5.0% for the first time since 2008. The 2-year gilt yield surged nearly 90 bps on the month.
UK gilt yields surged in March; 10-year yield reached highest level since 2008
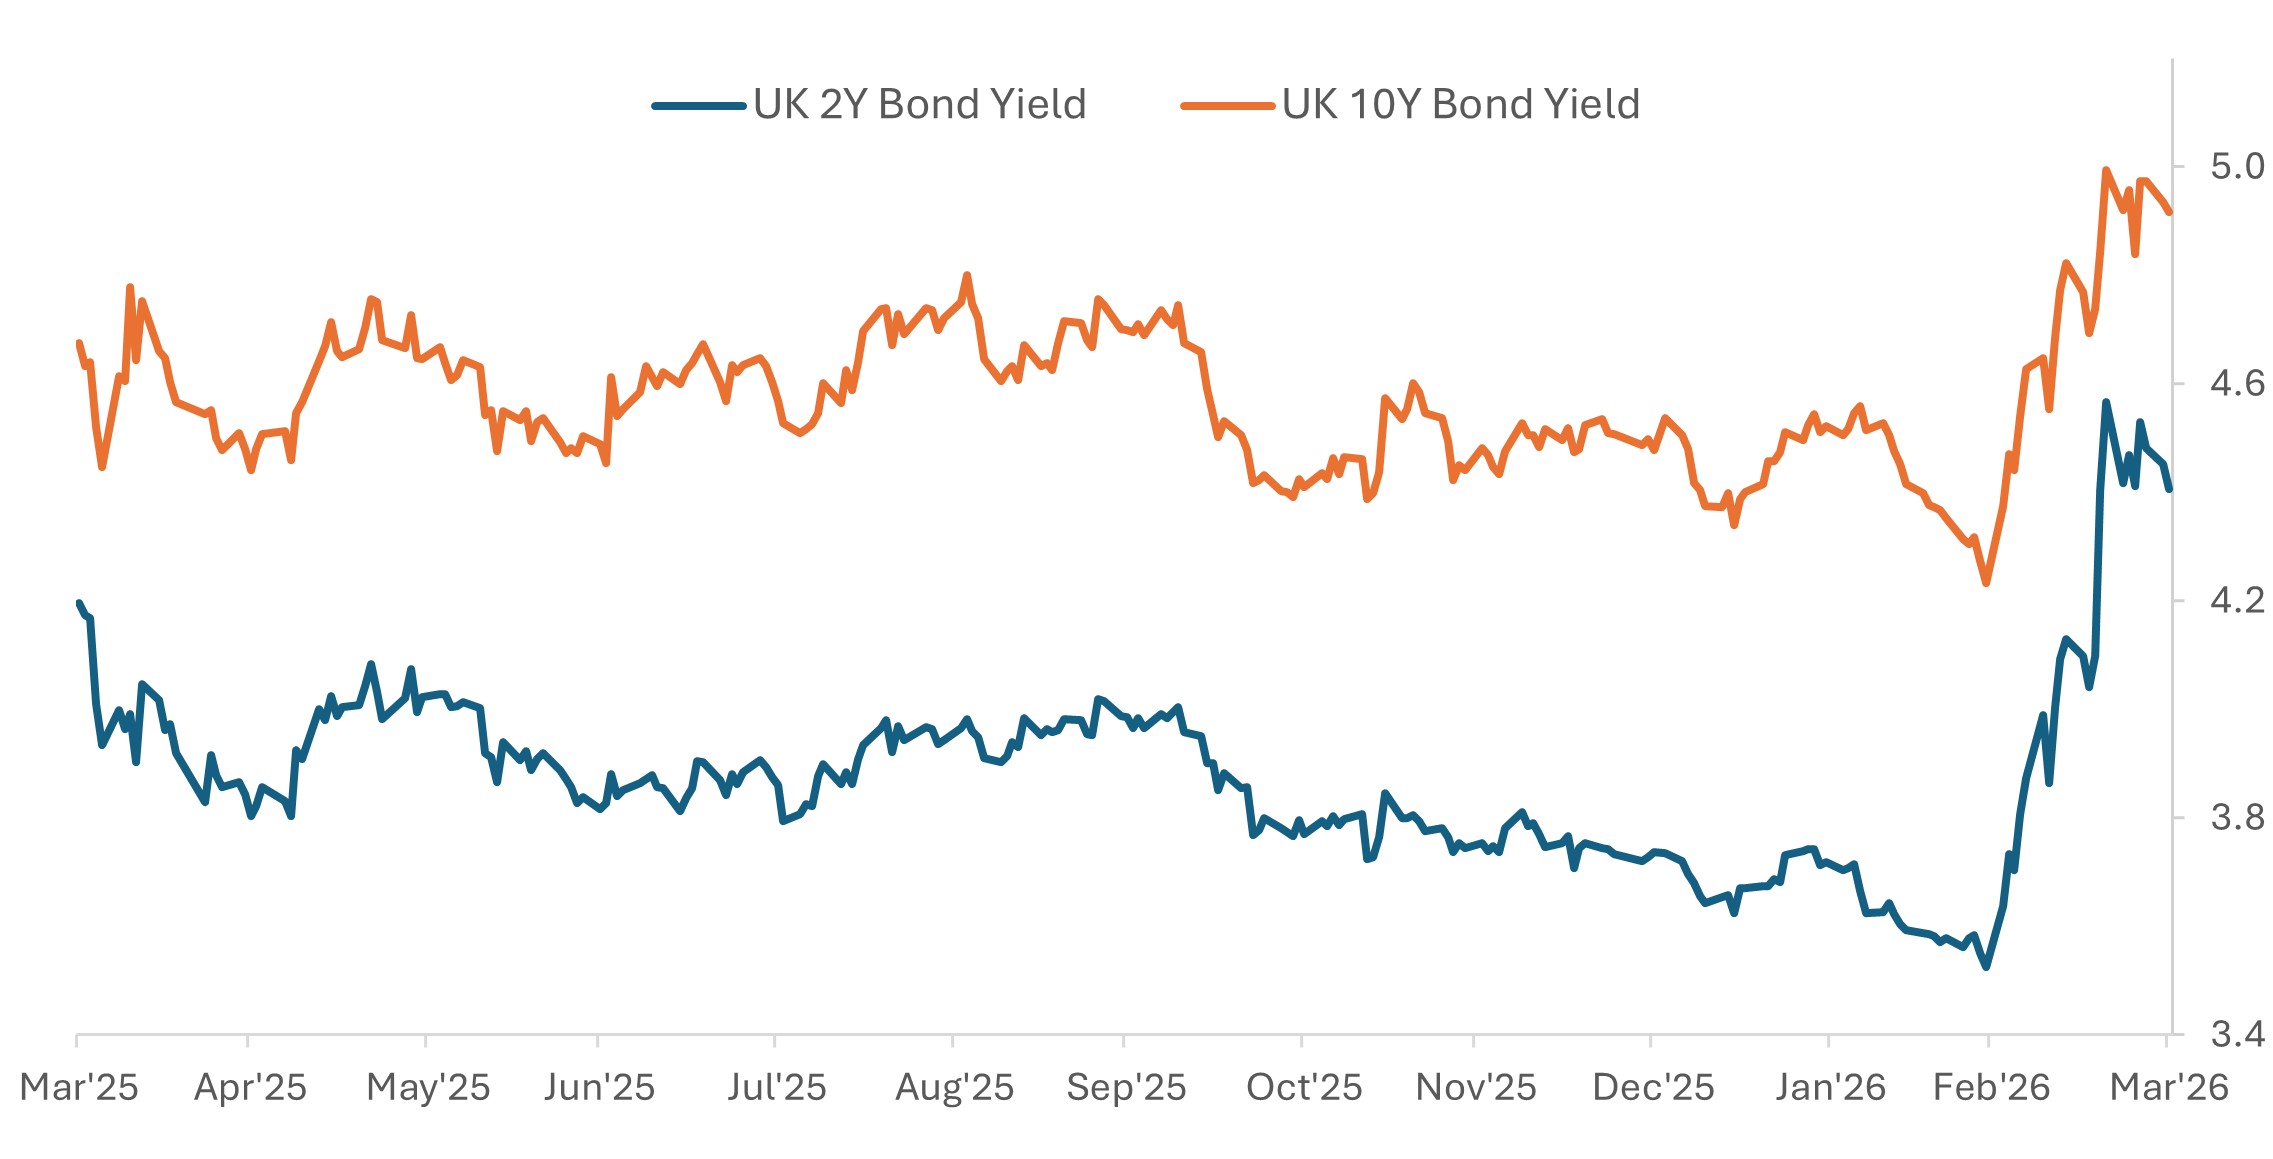
Source: Bloomberg, as of 31 March 2026. Past performance is no guarantee of future results.
- German sovereign bonds were broadly lower. The yield on the 10-year bund rose roughly 36 bps in March.
- Japanese government bonds (JGB) were also lower. The yield on the 10-year JGB rose 23 bps on the month.
Spread sectors delivered mostly negative returns, with option-adjusted spreads (OAS) widening amid the escalating Iran conflict and heightened macro uncertainty. Among corporates, high-yield bond spreads widened more than investment grades in both the U.S. and overseas markets.
- The Bloomberg Global Aggregate Corporate Index fell by 2.9% in U.S. dollar terms, while the Bloomberg Global High Yield Index declined by 2.5%.
- Global investment-grade spreads widened by approximately 8 bps, while high-yield spreads widened by roughly 35 bps.
- U.S. investment-grade corporate spreads widened by roughly 5 bps, adding to the roughly 11 bps of widening observed in February. U.S. high yield spreads widened by roughly 26 bps.
- In securitized markets, asset-backed securities (ABS) and mortgage-backed securities (MBS) spreads widened by approximately 4 bps.
Central Bank Watch
Most major central banks opted to hold rates steady in March while emphasizing heightened uncertainty tied to the Iran conflict. Policymakers broadly warned that rising oil prices could pose upside risks to inflation and downside risks to economic growth, complicating the policy outlook. Markets reacted with a more hawkish interpretation, with investors unwinding expectations for 2026 rate cuts and pricing in a greater possibility of rate hikes.
- Reserve Bank of Australia (Mar. 17): The RBA delivered its second consecutive rate hike, raising the cash rate target by 25 bps to 4.10% in a narrow 5-4 vote. Policymakers pointed to persistent inflation pressures and heightened global uncertainty as key drivers. Despite the close call in March, RBA governor Bullock emphasized that the “direction of travel is clear” and that “a series of rate hikes will be required,” leading markets to price in roughly even odds of another rate hike in May.
- Bank of Canada (Mar. 18): The BoC held its policy rate steady at 2.25%, as expected. Governor Macklem noted the conflict in the Middle East had widened the range of possible outcomes, with risks to growth tilted to the downside as inflation risks have increased.
- U.S. Federal Reserve (Mar. 18): The FOMC voted 11-1 to keep the fed funds rate unchanged at a 3.5%-3.75% range, as expected. Chair Powell leaned hawkish during the press conference as he emphasized upside risks to inflation and noted fewer FOMC participants expect more than a single rate cut this year. Market pricing shifted modestly hawkish following the meeting and continued in that direction as the month progressed.
- Bank of Japan (Mar. 19): The BoJ left the overnight rate at 0.75%, as widely expected. Officials reiterated their cautious approach to policy normalization, with Governor Ueda noting board members debated geopolitical implications but suggested a willingness to look through any short-term impact, leaving a possible April rate hike on the table.
- Bank of England (Mar. 19): The BoE voted unanimously, 9-0, to hold the Bank Rate steady at 3.75%, surprising markets that had anticipated a more divided decision. The central bank also raised its inflation forecast, supporting expectations for a tightening bias, even as Governor Bailey pushed back against the market’s aggressive pricing for multiple rate hikes this year.
- European Central Bank (Mar. 19): The ECB held its deposit rate at 2.0%, as expected. President Lagarde said inflation risks are tilted to the upside, acknowledging the Iran war poses upside inflation risks and downside growth risks. Following the decision, ECB officials signaled readiness to raise rates as soon as the April meeting if the energy shock pushes inflation too far above target.
- Other central banks: Elsewhere, policymakers largely stayed on hold. The Swiss National Bank and Sweden’s Riksbank left policy unchanged, as expected. Norway’s central bank held its rate steady at 4.0% for a third straight meeting but said upward inflation pressures will likely require higher rates in the months ahead. In emerging markets, Brazil initiated a long‑awaited easing cycle with a cautious 25 bp rate cut, taking its policy rate to 14.75%. The Bank of Russia cut its key rate by 50 bps to 15.0%, extending its easing cycle. The People’s Bank of China left its one‑year and five‑year loan prime rates unchanged for a tenth straight month. The Bank of Mexico lowered its key rate by 25 bps to 6.75% in a split 3-2 vote and said it would evaluate the appropriateness and timing for an additional rate cut.
Key events on tap in April
- Apr. 1 – Global Manufacturing PMIs (March, final)
- Apr. 3 – U.S. Nonfarm Payrolls, Unemployment Rate (March)
- Apr. 3, 6, 7 – Global Services and Composite PMIs (March, final)
- Apr. 9 – U.S. Gross Domestic Product (Q4, third/final estimate)
- Apr. 10 – U.S. Consumer Price Index (March)
- Apr. 16 – Eurozone Consumer Price Index (March, final)
- Apr. 19 – People’s Bank of China (PBOC) Rate Decision
- Apr. 21 – UK Unemployment Rate (December to February)
- Apr. 23 – Global PMIs (April, flash estimate)
- Apr. 28 – Bank of Japan (BoJ) Rate Decision
- Apr. 29 – Bank of Canada (BoC) Rate Decision
- Apr. 29 – FOMC (Fed) Rate Decision
- Apr. 30 – Bank of England (BoE) Rate Decision
- Apr. 30 – European Central Bank (ECB) Rate Decision
- Apr. 30 – Eurozone Gross Domestic Product (Q1, flash estimate)
- Apr. 30 – U.S. Gross Domestic Product (Q1, first estimate)
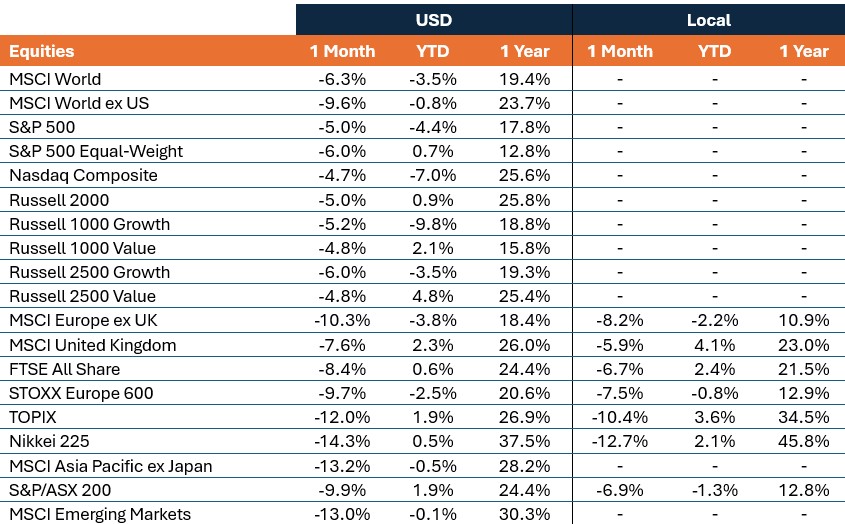
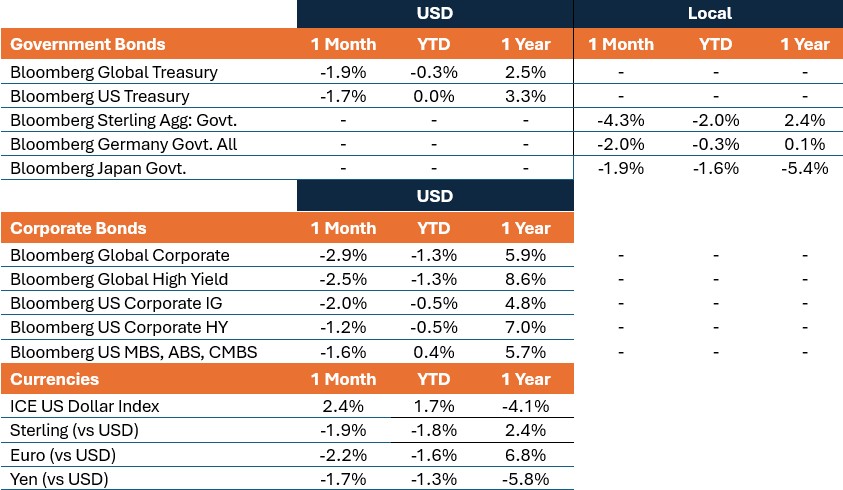
Market Performance
Total returns (%), periods ended March 31, 2026
IMPORTANT INFORMATION
Equity securities are subject to risks including market risk. Returns will fluctuate in response to issuer, political and economic developments.
Fixed income securities are subject to interest rate, inflation, credit and default risk. As interest rates rise, bond prices usually fall, and vice versa. High-yield bonds, or “junk” bonds, involve a greater risk of default and price volatility.
Foreign securities, including sovereign debt, are subject to currency fluctuations, political and economic uncertainty and increased volatility and lower liquidity, all of which are magnified in emerging markets.
Securitized products, such as mortgage- and asset-backed securities, are more sensitive to interest rate changes, have extension and prepayment risk, and are subject to more credit, valuation and liquidity risk than other fixed-income securities.
Bloomberg Asian-Pacific Japan Government-Related Index is a fixed-rate, investment grade, JPY-denominated benchmark that includes debt from government-related issuers.
Bloomberg Germany Government All Bonds Index measures the performance of German government bonds (Bunds) issued by the German government.
Bloomberg Global Aggregate – Corporate Index is a flagship measure of global investment grade, fixed-rate corporate debt. This multi-currency benchmark includes bonds from developed and emerging markets issuers.
Bloomberg Global High Yield Index is a multi-currency flagship measure of the global high yield debt market. The index represents the union of the US High Yield, the Pan-European High Yield, and Emerging Markets (EM) Hard Currency High Yield Indices.
Bloomberg Global Treasury Index tracks fixed-rate, local currency government debt of investment grade countries, including both developed and emerging markets.
Bloomberg Sterling Aggregate: Government Index measures the performance of UK government bonds (Gilts) within the broader Bloomberg Sterling Aggregate Index, which covers the investment-grade, fixed-rate, sterling-denominated bond market.
Bloomberg US Corporate Bond Index measures the investment grade, fixed-rate, taxable corporate bond market. It includes USD-denominated securities from US and non-US issuers.
Bloomberg US Corporate High Yield Bond Index measures the USD-denominated, high yield, fixed-rate corporate bond market. Bonds from issuers with an emerging markets country of risk, based on Bloomberg EM country definition, are excluded.
Bloomberg US Securitized: MBS, ABS, and CMBS Index tracks all USD-denominated, investment grade, securitized issues within the Bloomberg US Aggregate Index.
Bloomberg US Treasury Index measures U.S. dollar-denominated, fixed-rate, nominal debt issued by the U.S. Treasury.
The DAX is a blue-chip stock market index consisting of the 40 major German companies trading on the Frankfurt Stock Exchange.
The France 40 Index is a market value weighted index, composed of the 40 highest levels among the 100 highest market caps on the Paris Bourse.
FTSE All-Share Index reflects the equity market performance of the United Kingdom. The index includes nearly all eligible companies on the London Stock Exchange, covering large, mid, and small-cap stocks.
ICE U.S. Dollar Index is a benchmark measuring the U.S. dollar’s value against a basket of six major world currencies (Euro, Yen, Pound Sterling, Canadian Dollar, Swedish Krona, Swiss Franc).
MSCI AC Asia Pacific ex Japan Index reflects the equity market performance of the Asia Pacific region, excluding Japan, covering both developed and emerging markets.
The MSCI ACWI ex USA Index captures large- and mid-cap representation across 22 of 23 developed markets (excluding the US) and 24 emerging markets countries.
MSCI Emerging Markets Index reflects the equity market performance of emerging markets.
MSCI Europe Index reflects the equity market performance of large and mid-sized companies listed in developed markets in Europe.
MSCI Europe ex UK Index reflects the equity market performance of large and mid-sized companies listed in developed markets in Europe excluding the United Kingdom.
MSCI United Kingdom Index reflects the equity market performance of large and mid-sized companies listed in the UK market.
MSCI World Index captures large- and mid-cap representation across 22 of 23 developed markets countries, excluding the United States.
MSCI World ex USA Index reflects the equity market performance of global developed markets excluding the United States.
NASDAQ Composite Stock Index: National Association of Securities Dealers Automated Quotation System (NASDAQ) is a nationwide computerized quotation system for over 5,500 over-the-counter stocks. The index is compiled of more than 4,800 stocks that are traded via this system.
Nikkei 225 Index (also known as Nikkei Stock Average): A measure of Japanese equity market performance. The index includes 225 of the largest companies listed on the Tokyo Stock Exchange.
Purchasing Managers’ Index (PMI) is an index of the prevailing direction of economic trends in the manufacturing and service sectors, based on a survey of private sector companies.
Russell 1000® Growth Index reflects the performance of U.S. large-cap equities with higher price-to-book ratios and higher forecasted growth values.
Russell 1000® Value Index reflects the performance of U.S. large-cap equities with lower price-to-book ratios and lower forecasted growth values.
Russell 2000® Index reflects the performance of U.S. small-cap equities.
Russell 2500™ Growth Index reflects the performance of U.S. small to mid-cap equities with higher price-to-book ratios and higher forecasted growth values.
Russell 2500™ Value Index reflects the performance of U.S. small to mid-cap equities with lower price-to-book ratios and lower forecasted growth values.
S&P 500® Index reflects U.S. large-cap equity performance and represents broad U.S. equity market performance.
S&P 500 Equal Weight Index (EWI) is the equal-weight version of the S&P 500. The index includes the same constituents as the capitalization weighted index, but each company is allocated a fixed weight – or 0.2% of the index total at each quarterly rebalance.
S&P/ASX 200 Index reflects the performance of the 200 largest, most liquid companies listed on the Australian Securities Exchange (ASX).
STOXX Europe 600 Index: An index of the 600 largest listed stocks in the European equity market, comprising 17 countries and 11 industries
TOPIX: A capitalization-weighted index of all the companies listed on the First Section of the Tokyo Stock Exchange and is widely regarded as a broad benchmark for Japanese stock prices.
10-year bond: A bond that is set to mature (repay the principal value) in 10 years.
10-Year Treasury Yield is the interest rate on U.S. Treasury bonds that will mature 10 years from the date of purchase.
Agency Mortgage-backed Securities (Agency MBS): A type of asset-backed security that is specifically secured by a collection of mortgages.
Asset-backed Securities (ABS): These are financial instruments that are backed by a pool of assets—typically those that generate a cash flow from debt, such as loans, leases, credit card balances, or receivables.
Basis point: One basis point (bp) equals 1/100 of a percentage point, 1bp = 0.01%.
Bund yield: Bund yields are viewed as benchmark yield indicators for European government bonds; those with a 10-year maturity are considered to be the German equivalent of U.S. Treasury bonds.
Commercial Mortgage-backed Securities (CMBS): A type of mortgage-backed security that is secured by the loan on commercial real estate properties rather than residential real estate.
Consumer Price Index (CPI): A measure that examines the price change of a basket of consumer goods and services over time. It is used to estimate inflation.
Credit spread: The difference in yield between securities with similar maturity but different credit quality. Widening spreads generally indicate deteriorating creditworthiness of corporate borrowers, and narrowing indicate improving.
Curve/Yield curve: A yield curve plots the yields (interest rate) of bonds with equal credit quality but differing maturity dates. Typically bonds with longer maturities have higher yields.
The Federal Open Market Committee (FOMC) is the body of the Federal Reserve System that sets national monetary policy.
Fiscal policy: Describes government policy relating to setting tax rates and spending levels. Fiscal policy is separate from monetary policy, which is typically set by a central bank.
Gilt yield: Gilt yields are viewed as benchmark yield indicators for United Kingdom government bonds; those with a 10-year maturity are considered to be the UK equivalent of U.S. Treasury bonds.
Hawkish policy aims to curb inflation and slow down growth in the economy by raising interest rates and reducing the supply of money.
High yield bond: Also known as a sub-investment grade bond, or ‘junk’ bond. These bonds usually carry a higher risk of the issuer defaulting on their payments, so they are typically issued with a higher interest rate (coupon) to compensate for the additional risk.
Inflation: The rate at which the prices of goods and services are rising in an economy. The Consumer Price Index (CPI) and Retail Price Index (RPI) are two common measures.
Investment grade bond: A bond typically issued by governments or companies perceived to have a relatively low risk of defaulting on their payments, reflected in the higher rating given to them by credit ratings agencies.
JGB yield: JGB yields are viewed as benchmark yield indicators for Japanese government bonds; those with a 10-year maturity are considered to be the Japanese equivalent of U.S. Treasury bonds.
Monetary policy: The policies of a central bank, aimed at influencing the level of inflation and growth in an economy. Monetary policy tools include setting interest rates and controlling the supply of money. Dovish policy aims to stimulate economic growth by lowering interest rates and increasing the money supply.
Option-Adjusted Spread (OAS) measures the spread between a fixed-income security rate and the risk-free rate of return, which is adjusted to take into account an embedded option.
Securitization: The process in which certain types of assets are pooled so that they can be repackaged into interest-bearing securities. The interest and principal payments from the assets are passed through to the purchasers of the securities.
Stagflation is an economic cycle characterized by slow growth and a high unemployment rate accompanied by inflation.
U.S. Treasury securities are direct debt obligations issued by the U.S. Government. Treasury Bills and U.S. Government Bonds are guaranteed by the full faith and credit of the U.S. government, are generally considered to be free of credit risk.
Volatility measures risk using the dispersion of returns for a given investment.
Quantitative Easing (QE) is a government monetary policy occasionally used to increase the money supply by buying government securities or other securities from the market.
Yield: The level of income on a security over a set period, typically expressed as a percentage rate. For equities, a common measure is the dividend yield, which divides recent dividend payments for each share by the share price. For a bond, this is calculated as the coupon payment divided by the current bond price.
These are the views of the author at the time of publication and may differ from the views of other individuals/teams at Janus Henderson Investors. References made to individual securities do not constitute a recommendation to buy, sell or hold any security, investment strategy or market sector, and should not be assumed to be profitable. Janus Henderson Investors, its affiliated advisor, or its employees, may have a position in the securities mentioned.
Past performance does not predict future returns. The value of an investment and the income from it can fall as well as rise and you may not get back the amount originally invested.
The information in this article does not qualify as an investment recommendation.
There is no guarantee that past trends will continue, or forecasts will be realised.
Marketing Communication.