Chart to Watch: Insatiable demand for compute power rationalises massive capex
Rising AI use cases, token volumes and compute efficiency gains married with falling compute costs are underpinning robust AI demand, driving tech giants to invest at an unprecedented scale. This is reshaping the competitive landscape for AI infrastructure and monetisation, says Portfolio Manager Richard Clode.
We are moving to a world where progress and productivity will be measured in tokens. – Richard Clode
Key takeaways
- AI token demand is growing exponentially, driven by increasingly complex and agentic use cases, even as models become more efficient per task.
- Falling compute costs are increasing overall demand, justifying unprecedented levels of tech giants AI capex.
- Monetising tokens at scale is central to AI return-on-investment, making the ability to price, distribute, and capture usage a key competitive differentiator.
The scale of investment flowing into artificial intelligence reflects a simple reality: demand for compute is accelerating faster than efficiency gains can match. AI usage is growing exponentially even as the cost of computation per task falls – a classic case of Jevons’ Paradox, where falling costs make a resource more attractive, leading to higher demand.
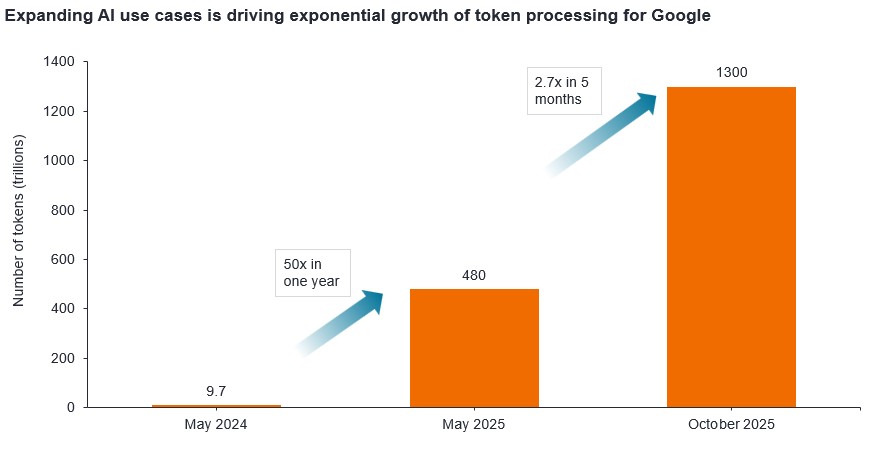
Google’s token growth highlights the scale of AI demand
Tokens are the basic units AI models process when reading, generating, or reasoning with information. More complex and agentic AI use cases, such as autonomous research assistants, coding agents, and multimodal enterprise workflows, dramatically increase token volumes. Google has been the leader in tokens processing; monthly tokens processed jumped from 9.7 trillion in May 2024 to 480 trillion 12 months later. By October 2025 this surged dramatically to 1,300 trillion tokens (most recent data).1
Efficiency improvements remain rapid. Models such as Gemini 3 Flash use fewer tokens per task and significantly less compute, yet total demand continues to rise as AI becomes embedded across productivity, search, and decision‑making workflows.
Token monetisation can assuage AI capex concerns
Meeting insatiable AI demand requires unprecedented capital expenditure (capex). Google has signalled 2026 capex of up to US$185 billion, double that of last 2025,2 Amazon is projecting capex of US$200 billion,3 while Meta is estimating up to US$135 billion.4 NVIDIA suggests that tiered token monetisation can ultimately translate this surge in usage into durable returns, helping to justify the scale of investment.
We believe that the magnitude and duration of AI spend is still underappreciated. Coupled with a rapidly-expanding addressable market for AI, with tech sector valuations now at a five-year low to broader equities,5 active stock pickers like us have ample opportunities to identify future leaders with earnings power that is not yet fully appreciated.
1 Google blog; Q3 earnings call: Remarks from our CEO; 29 October 2025.
2 Alphabet 4Q and fiscal year 2025 results; 4 February 2026.
3 Amazon Q4 2025 results; 5 February 2026.
4 Meta Q4 2025 earnings call; 28 January 2026.
5 Bernstein data as at end February 2026. Tech sector price-to forward earnings (P/E ratio) of circa 22% versus broader equities 5-year average of 36%. Based on MSCI ACWI Information Technology Sector, price-to-forward earnings relative to MSCI ACWI Index from December 1999 to November 2018 pre GICS sector changes in MSCI Global indices, and MSCI ACWI Information Technology + ACWI Communication Services relative to MSCI ACWI Index to current post GICS sector changes in MSCI Global indices. Past performance does not predict future returns.
Agentic AI: Refers to autonomous, goal-driven AI systems that can plan, reason, and take actions to achieve complex objectives with limited human oversight, rather than just generating text or responding to prompts.
Capital expenditure: Money invested to acquire or upgrade fixed assets such as buildings, machinery, equipment, or vehicles in order to maintain or improve operations and foster future growth.
Jevon’s Paradox: A theory suggesting that greater efficiency in the use of any given resource can result in increased demand for that resource. Applying this to technology/AI chips, as technological and efficiency improvements in technology/chips increases, the overall demand for chips actually increases rather than decreases.
Price-to-earnings ratio (P/E): A popular valuation metric that measures share price compared to earnings per share for a stock or stocks in a portfolio.
Important information
Please read the following important information regarding funds related to this article.
Key investment risks:
- The Fund's investments in equities are subject to equity securities risk due to fluctuation of securities values.
- Investments in the Fund involve general investment, currency, liquidity, hedging, market, economic, political, regulatory, taxation, securities lending related, reverse repurchase transactions related, small/ mid-capitalisation companies related, financial and interest rate risks. In extreme market conditions, you may lose your entire investment.
- The Fund may invest in financial derivatives instruments to reduce risk and to manage the Fund more efficiently. This may involve counterparty, liquidity, leverage, volatility, valuation and over-the-counter transaction risks and the Fund may suffer significant losses.
- The Fund's investments are concentrated in companies addressing global challenges including population growth, ageing population, resource constraints, and climate change, with potential exposure to emerging markets and may be more volatile.
- Investors should not only base on this document alone to make investment decisions and should read the offering documents including the risk factors for further details.
Key investment risks:
- The Fund's investments in equities are subject to equity securities risk due to fluctuation of securities values.
- Investments in the Fund involve general investment, currency, RMB currency and conversion, liquidity, hedging, market, economic, political, regulatory, taxation, securities lending related, reverse repurchase transactions related, financial and interest rate risks. In extreme market conditions, you may lose your entire investment.
- The Fund may invest in financial derivatives instruments to reduce risk and to manage the Fund more efficiently. This may involve counterparty, liquidity, leverage, volatility, valuation and over-the-counter transaction risks and the Fund may suffer significant losses.
- The Fund's investments are concentrated in technology sector and may be more volatile and subject to technology related companies risk.
- The Fund may invest in Eurozone and may suffer from Eurozone risk.
- The Fund may charge performance fees. An investor may be subject to such fee even if there is a loss in investment capital.
- Investors should not only base on this document alone to make investment decisions and should read the offering documents including the risk factors for further details.