Balanced fund
High-conviction equities and actively managed bonds: emphasising balance between asset growth and reduced volatility.
A2 USD share class, Morningstar ratings are based on the representative share class of this fund and are dated to the last month-end upon availability from Morningstar.
Past performance does not predict future returns.
Dynamic 60:40 portfolio in US equity and fixed income capturing the long term US market growth.
Why it’s still time to take a Balanced approach
A balanced approach remains vital for mitigating risks and achieving long-term gains despite recent market volatilities.
A 60/40 approach offers several advantages
Simple, cost-effective diversification
Simple, cost-effective diversification
With one single investment, investors can gain exposure to different asset classes, styles, and markets.
An efficient portfolio solution
An efficient portfolio solution
A core allocation to a balanced fund aim to ensure diversified, risk-managed exposure for steady growth and resilience.
Consistency
Consistency
Investors can be left feeling more confident in their core asset allocation, knowing that it is designed to adjust and navigate through various market conditions.
Too early to call for the death of the 60/40
In our view, balanced portfolios are pillars of consistency and long-term investing that can be versatile solutions in investor portfolios, whether as an entire portfolio, a core allocation, or a tactical overlay.
Further proof that it was too early to call for the death of the 60/40
This table highlights the unique strengths of the 60/40 portfolio, US and global: a balance between equity and fixed income, that help investors to achieve positive long-term returns.
Source: Morningstar & Janus Henderson Portfolio Construction and Strategy Team. As of 31 August 2025. US 60/40 = a hypothetical portfolio invested 60% in the S&P 500 TR USD Index and 40% in the Bloomberg US Aggregate Bond TR USD Index. Global 60/40 = a hypothetical portfolio invested 60% in the MSCI World Gross Index (USD) and 40% in the Bloomberg Global Aggregate Bond TR USD Index. Past performance does not predict future returns.
| S&P 500 TR USD | Bloomberg US Aggregate Bond TR USD |
USA 60/40 | MSCI World GR USD | Bloomberg Global Aggregate TR USD | Global 60/40 | |
| YTD 2025 | 10.8% | 5.0% | 8.6% | 14.1% | 7.2% | 11.4% |
| 2024 | 25.0% | 1.3% | 15.0% | 19.2% | -1.7% | 10.5% |
| 2023 | 26.3% | 5.5% | 18.0% | 24.4% | 5.7% | 16.9% |
| Past 5 Years | 14.7% | -0.7% | 8.5% | 13.4% | -1.8% | 7.3% |
| Past 10 Years | 14.6% | 1.1% | 9.6% | 12.2% | 1.1% | 7.9% |
Value of a Hypothetical $10,000 Investment in the S&P 500®Index from 1999 – 2025
Making decisions based on fear can come at a high cost to investors, so it’s critical to stay true to long-term objectives vs. trying to time the market.
A continual investment in the S&P 500 from 1999 to date would result in a total cumulative return of nearly 721%* (*not including any applicable taxes, fees and costs).
If you missed the 10 best days of performance over those same period, the return would decrease to only 265%.
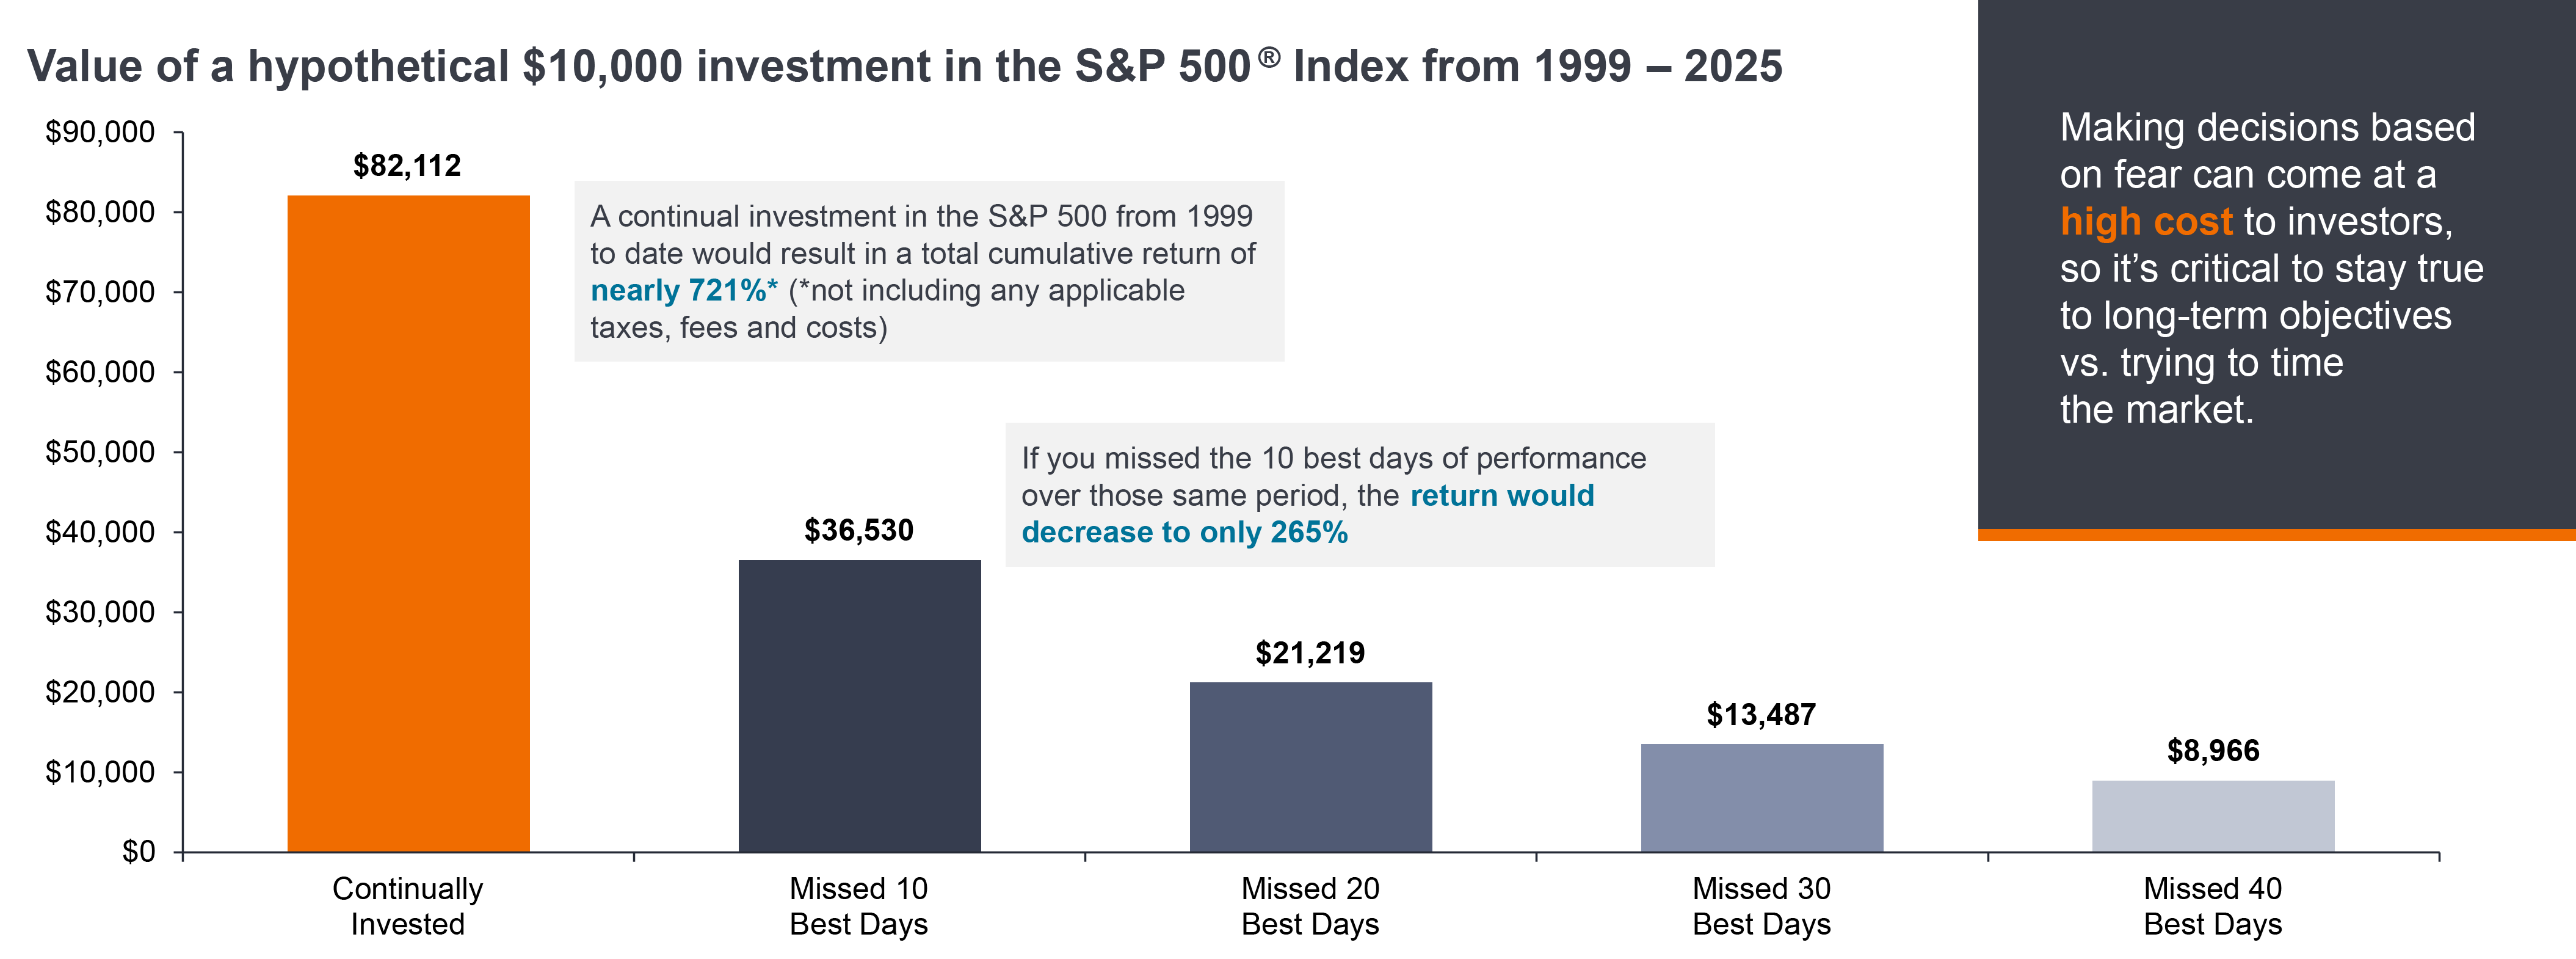
Source: Morningstar, S&P 500 Total Return Index, daily returns from December 1998 to 30 June 2025.
Exhibit 1
Further proof that it was too early to call for the death of the 60/40
This table highlights the unique strengths of the 60/40 portfolio, US and global: a balance between equity and fixed income, that help investors to achieve positive long-term returns. Despite the painful negative returns for balanced portfolios in 2022.
Source: Morningstar & Janus Henderson Portfolio Construction and Strategy Team. As of 31 August 2025. US 60/40 = a hypothetical portfolio invested 60% in the S&P 500 TR USD Index and 40% in the Bloomberg US Aggregate Bond TR USD Index. Global 60/40 = a hypothetical portfolio invested 60% in the MSCI World Gross Index (USD) and 40% in the Bloomberg Global Aggregate Bond TR USD Index. Past performance does not predict future returns.
| S&P 500 TR USD | Bloomberg US Aggregate Bond TR USD | USA 60/40 | |
| YTD 2025 | 10.8% | 5.0% | 8.6% |
| 2024 | 25.0% | 1.3% | 15.0% |
| 2023 | 26.3% | 5.5% | 18.0% |
| Past 5 Years | 14.7% | -0.7% | 8.5% |
| Past 10 Years | 14.6% | 1.1% | 9.6% |
| MSCI World GR USD | Bloomberg Global Aggregate TR USD | Global 60/40 | |
| YTD 2025 | 14.1% | 7.2% | 11.4% |
| 2024 | 19.2% | -1.7% | 10.5% |
| 2023 | 24.4% | 5.7% | 16.9% |
| Past 5 Years | 13.4% | -1.8% | 7.3% |
| Past 10 Years | 12.2% | 1.1% | 7.9% |
Exhibit 2
Value of a Hypothetical $10,000 Investment in the S&P 500®Index from 1999 – 2025
Making decisions based on fear can come at a high cost to investors, so it’s critical to stay true to long-term objectives vs. trying to time the market.
A continual investment in the S&P 500 from 1999 to date would result in a total cumulative return of nearly 721%* (*not including any applicable taxes, fees and costs).
If you missed the 10 best days of performance over those same period, the return would decrease to only 265%.
Source: Morningstar, S&P 500 Total Return Index, daily returns from December 1998 to 30 June 2025.
Janus Henderson Balanced Fund: active Managed one core stop solution
Beyond traditional investing: For over 30 years, Janus Henderson has offered clients a simple asset allocation solution focused on up-market capture and down-market defence.
What makes Janus Henderson Balanced Fund successful?
The Balanced Fund’s dynamic asset allocation strategy has the flexibility to defensively position in anticipation of market volatility while seeking strong risk-adjusted returns. Unlike many competitors, our allocation is NOT constrained by static targets, the Balanced Fund can actively pivot between an equity weighting of 35% to 65% depending on market conditions
View fundHigh-conviction US equities
We focus on US large-cap equities with growth potential. Historically, US equities have offered higher returns than other developed markets.
Actively managed bonds
The Fund has historically delivered when it has counted – on the downside, thanks to our bottom-up, actively managed intermediate-term bond allocation. Past performance does not predict future returns.
A balanced outcome
Our experts adjust asset allocation between stocks and bonds, helping to mitigate some of the emotional decision making that can be led by market volatility.
What does this approach means for drawdowns?
The teams dynamic approach provides the flexibility to defensively position ahead of market volatility while seeking strong risk-adjusted returns.
The Balanced Fund has historically delivered when it has counted – on the downside. Whether it was market downturns like the tech bubble collapse of the early 2000s or the global financial crisis of 2008, the Fund captured less of the downside.
Past performance does not predict future returns.
A steady success
The teams dynamic approach provides the flexibility to defensively position ahead of market volatility while seeking strong risk-adjusted returns.
Janus Henderson Balanced Fund has outperformed the benchmark on a monthly rolling-period basis 100% of the time over the 10, 15, and 20- year periods.
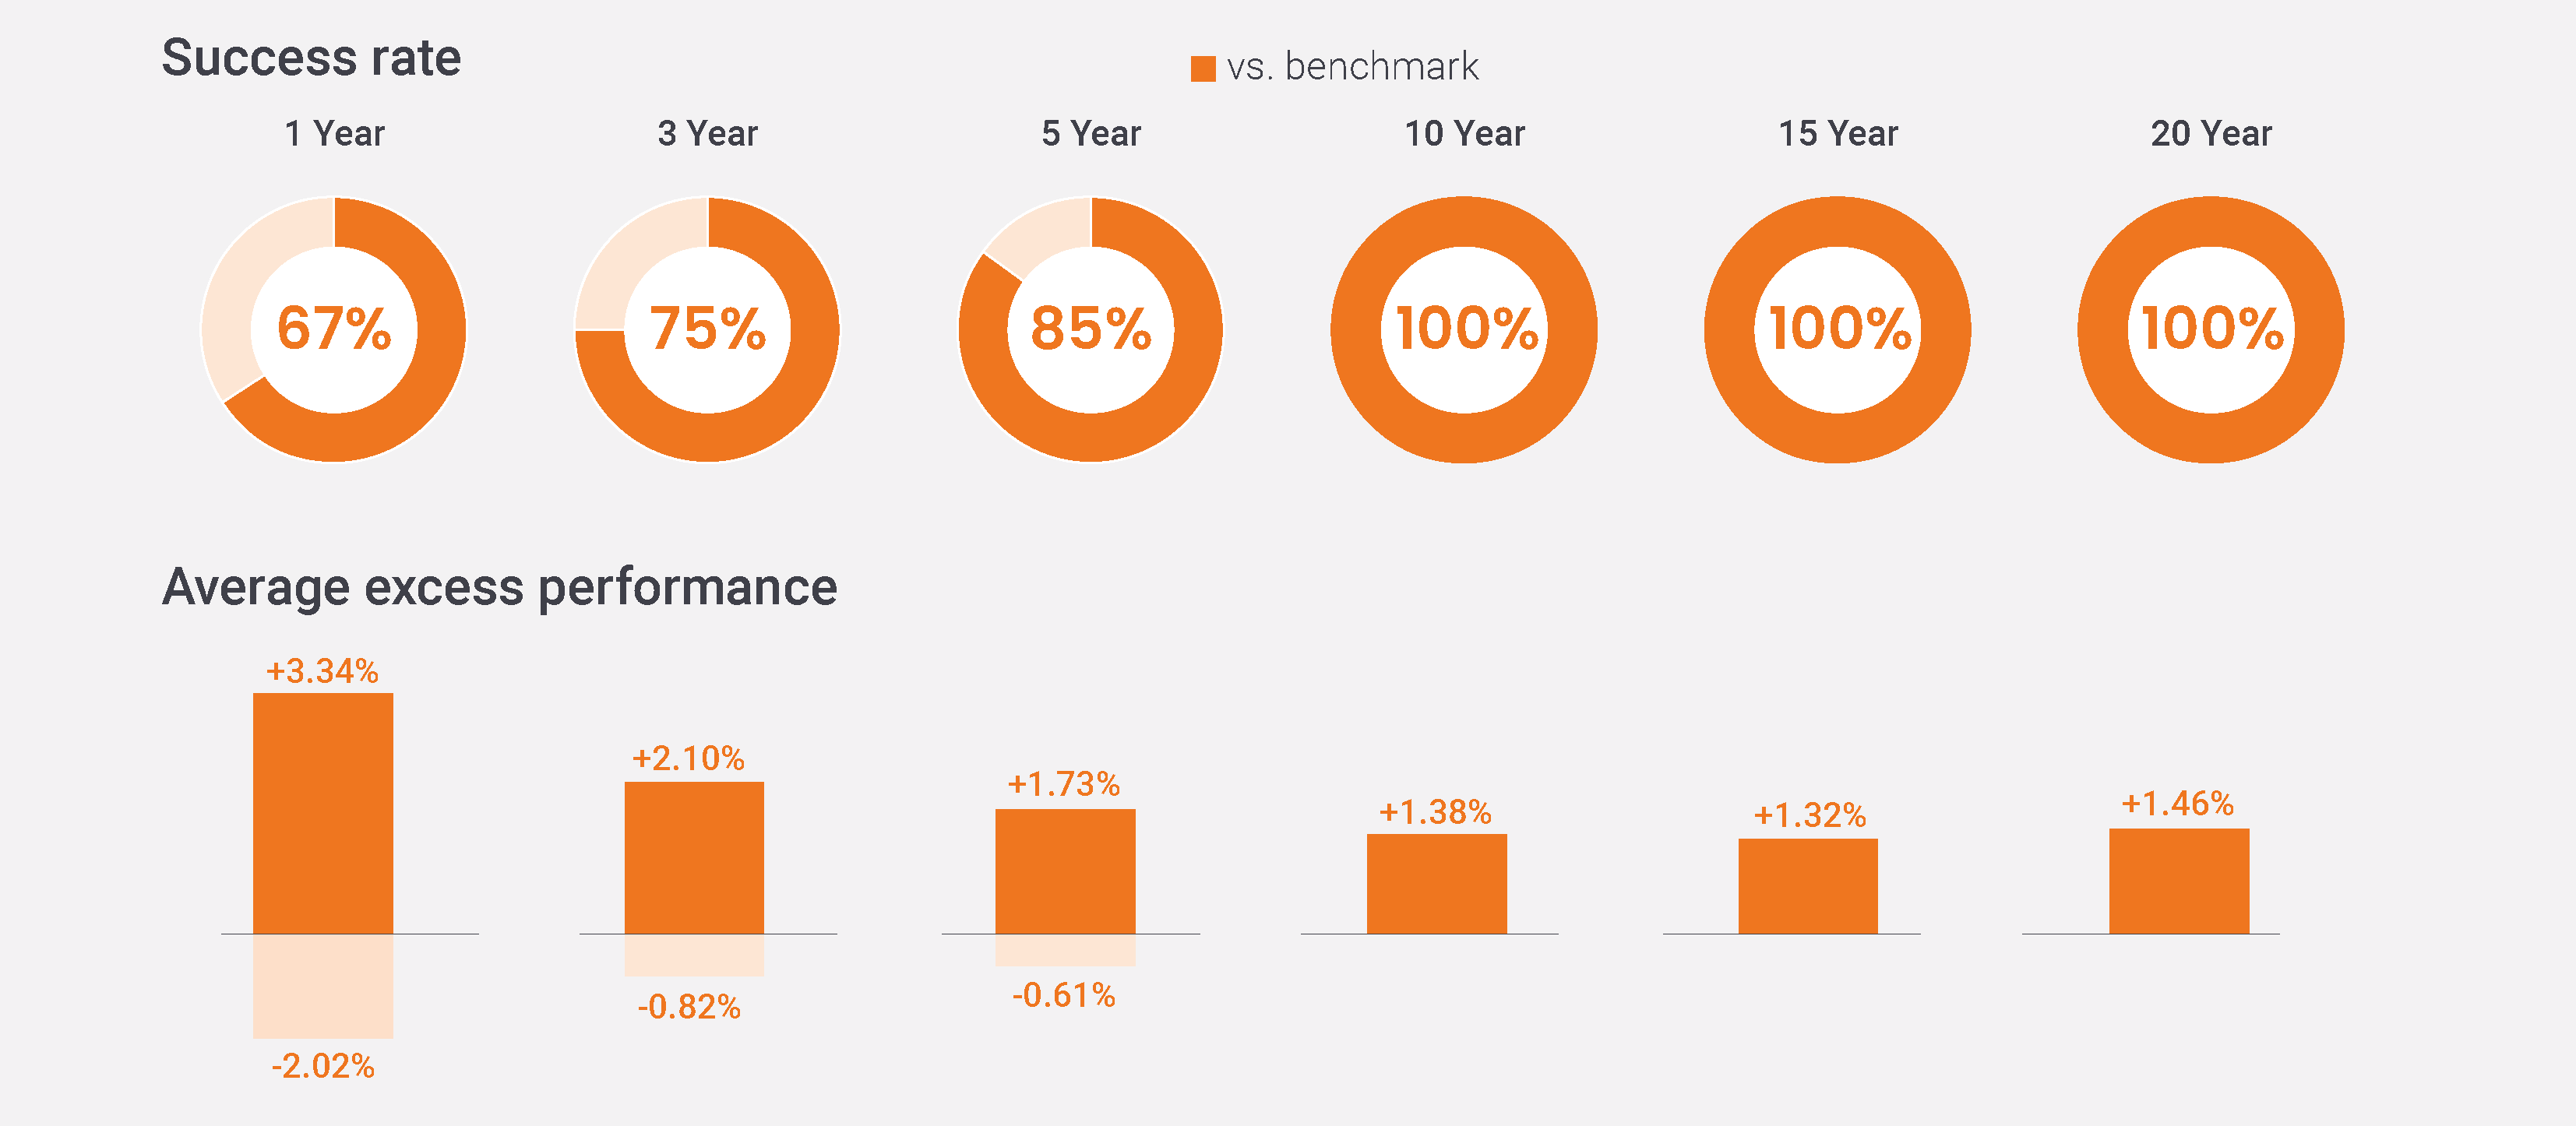
Source: Morningstar, Janus Henderson Investors, as at 30 June 2025.
Note: Success Rate is based on the rolling monthly returns since Fund inception (24/12/98), the chart depicts the percentage of time the Balanced Fund (A2 USD gross) outperformed the Balanced Index. Average excess performance represents, on average, how much the fund outperformed during periods of outperformance, or underperformed during periods of underperformance. Balanced´ Index is An internally calculated index (55% S&P 500 + 45% Bloomberg US Aggregate Bond).
From 31st July 2024, the Fund's benchmark, performance target and investment policy changed. Past performance shown before 31st July 2024 is shown for the Fund’s previous benchmark, performance target and investment policy.
Past performance does not predict future returns.
A look at dynamic allocation and market volatility
The Fund’s dynamic approach provides the flexibility to defensively position ahead of market volatility while seeking strong risk-adjusted returns. This process, coupled with diverse of return, can help mitigate downside risk.
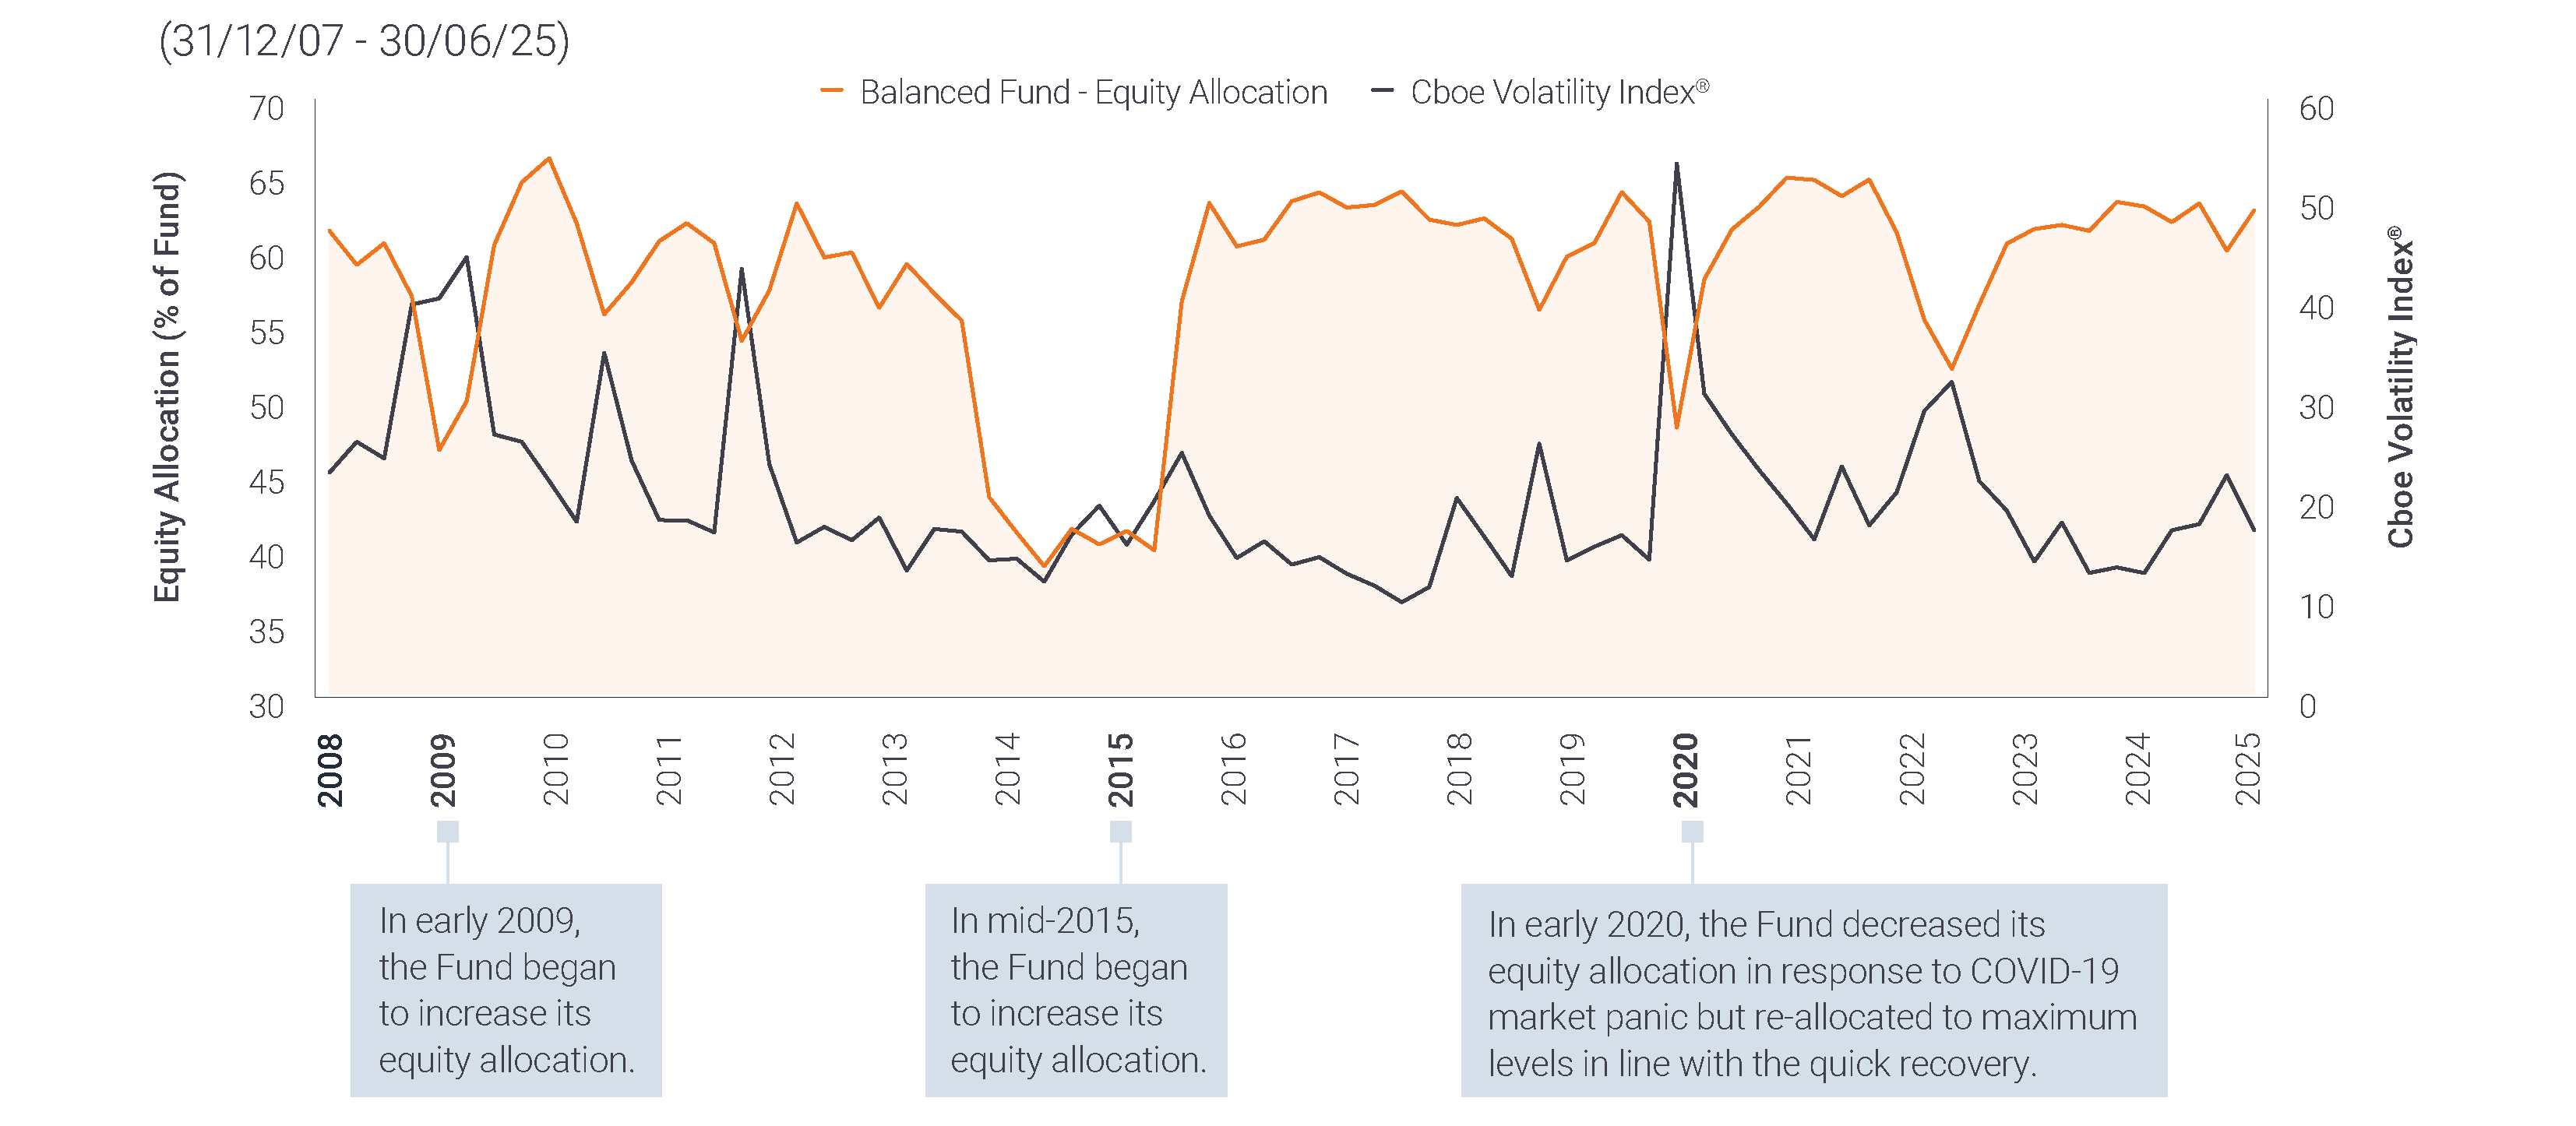
Source: Janus Henderson Investors, as of 30 June 2025.
There is no assurance that the investment process will consistently lead to successful investing. The equity allocation changes over time subject to strategic investment decisions. Cboe Volatility Index® or VIX® Index® shows the market’s expectation of 30-day volatility. It is constructed using the implied volatilities of a wide range of S&P 500® Index options and is a widely used measure of market risk. The VIX Index methodology is the property of Chicago Board of Options Exchange, which is not affiliated with Janus Henderson.
Capital at risk. Past performance does not predict future returns.
Morningstar, Janus Henderson Investors, as of 30/09/2025. Note: Success Rate is based on the 1-year rolling monthly returns since Fund inception 24/12/98. The percentage depicts the number of times the Balanced Fund (gross of fees) outperformed the Balanced Index.
Meet the team
Let our team make the asset allocation decision between stocks and bonds for you and help remove some of the emotional decision making that can be led by market volatility.
Portfolio Manager
Head of US Fixed Income/Head of Core Plus | Portfolio Manager
Portfolio Manager