
Key takeaways:
- S&P 500 Index sectors focused on growth, stability, and defense have grown from about 60% of the index in 2014 to roughly 74% today. Meanwhile, cyclical sectors have shrunk from roughly 40% to 26%.
- U.S. large-cap market multiples are higher than in recent history, but it is worth noting that the mix of industries within major indexes has shifted toward faster-growing, more profitable sectors that typically command higher multiples.
- Fundamentals are helping to support current valuations: The gap in profitability between growth and value indexes has widened over time, helping explain why the valuation gap has grown as well.
Source: Bloomberg, as of 15 October 2025.
The S&P 500® Index looks very different today than it did a decade ago. Sectors focused on growth, stability, and defense1 have grown from about 60% of the index in 2014 to roughly 74% today. Meanwhile, cyclical sectors2 have shrunk from roughly 40% to 26%.
Energy offers a stark example of shifts in market composition: its weight in the S&P 500 has fallen from approximately 11% in 2014 to about 3% today. The bottom line is that the S&P 500 has become growthier, and market valuations have risen accordingly.
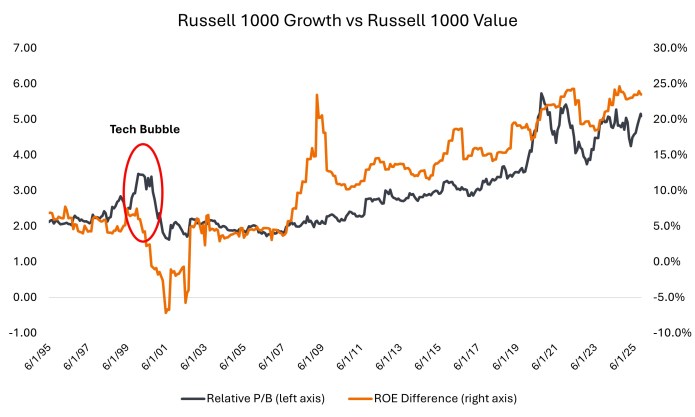
The chart above compares large-cap growth and value indexes on two key measures: valuation (price-to-book ratio, shown on the left axis) and quality (return on equity, shown on the right axis). The comparison highlights a key difference in today’s market versus the tech bubble of 2000.
Growth stocks trade at a wide valuation (price-to-book) premium to value stocks today, but there is a crucial difference from 2000: Fundamentals are helping to support current valuations.
The gap in profitability (return on equity) between growth and value indexes has widened over time, helping explain why the valuation gap has grown as well. Since 2002, increases in price-to-book ratios have been matched by comparable increases in return on equity. During the 2000 tech bubble, by contrast, growth valuations surged without any fundamental support.
U.S. large-cap market multiples are higher than in recent history, but it is worth taking into account that the mix of industries within major indexes has shifted toward faster-growing, more profitable sectors that typically command higher multiples. Strong recent earnings growth – with similar expectations through year end and into next year – also help justify higher valuations.
Sources & definitions
1 Growth, stability and defense sectors represented by technology, communication services, health care, consumer staples, consumer discretionary, utilities, and real estate.
2 Cyclical sectors represented by financials, industrials, materials, and energy.
Return on Equity (ROE) is the measure of a company’s annual return (net income) divided by the value of its total shareholders’ equity, expressed as a percentage. The number represents the total return on equity capital i.e., the profits made for each dollar from shareholders’ equity.
Price-to-Book (P/B) Ratio measures share price compared to book value per share for a stock or stocks in a portfolio.
S&P 500® Index reflects U.S. large-cap equity performance and represents broad U.S. equity market performance.
Russell 1000® Growth Index reflects the performance of U.S. large-cap equities with higher price-to-book ratios and higher forecasted growth values.
Russell 1000® Value Index reflects the performance of U.S. large-cap equities with lower price-to-book ratios and lower expected growth values.
Related insights


These are the views of the author at the time of publication and may differ from the views of other individuals/teams at Janus Henderson Investors. References made to individual securities do not constitute a recommendation to buy, sell or hold any security, investment strategy or market sector, and should not be assumed to be profitable. Janus Henderson Investors, its affiliated advisor, or its employees, may have a position in the securities mentioned.
Past performance does not predict future returns. The value of an investment and the income from it can fall as well as rise and you may not get back the amount originally invested.
The information in this article does not qualify as an investment recommendation.
There is no guarantee that past trends will continue, or forecasts will be realised.
Marketing Communication.
Important information
Please read the following important information regarding funds related to this article.
Janus Henderson Capital Funds Plc is a UCITS established under Irish law, with segregated liability between funds. Investors are warned that they should only make their investments based on the most recent Prospectus which contains information about fees, expenses and risks, which is available from all distributors and paying/facilities agents, it should be read carefully. This is a marketing communication. Please refer to the prospectus of the UCITS and to the KIID before making any final investment decisions. The rate of return may vary and the principal value of an investment will fluctuate due to market and foreign exchange movements. Shares, if redeemed, may be worth more or less than their original cost. This is not a solicitation for the sale of shares and nothing herein is intended to amount to investment advice. Janus Henderson Investors Europe S.A. may decide to terminate the marketing arrangements of this Collective Investment Scheme in accordance with the appropriate regulation.
- Shares/Units can lose value rapidly, and typically involve higher risks than bonds or money market instruments. The value of your investment may fall as a result.
- An issuer of a bond (or money market instrument) may become unable or unwilling to pay interest or repay capital to the Fund. If this happens or the market perceives this may happen, the value of the bond will fall.
- When interest rates rise (or fall), the prices of different securities will be affected differently. In particular, bond values generally fall when interest rates rise (or are expected to rise). This risk is typically greater the longer the maturity of a bond investment.
- The Fund invests in high yield (non-investment grade) bonds and while these generally offer higher rates of interest than investment grade bonds, they are more speculative and more sensitive to adverse changes in market conditions.
- If a Fund has a high exposure to a particular country or geographical region it carries a higher level of risk than a Fund which is more broadly diversified.
- The Fund may use derivatives to help achieve its investment objective. This can result in leverage (higher levels of debt), which can magnify an investment outcome. Gains or losses to the Fund may therefore be greater than the cost of the derivative. Derivatives also introduce other risks, in particular, that a derivative counterparty may not meet its contractual obligations.
- When the Fund, or a share/unit class, seeks to mitigate exchange rate movements of a currency relative to the base currency (hedge), the hedging strategy itself may positively or negatively impact the value of the Fund due to differences in short-term interest rates between the currencies.
- Securities within the Fund could become hard to value or to sell at a desired time and price, especially in extreme market conditions when asset prices may be falling, increasing the risk of investment losses.
- Some or all of the ongoing charges may be taken from capital, which may erode capital or reduce potential for capital growth.
- The Fund could lose money if a counterparty with which the Fund trades becomes unwilling or unable to meet its obligations, or as a result of failure or delay in operational processes or the failure of a third party provider.
- In addition to income, this share class may distribute realised and unrealised capital gains and original capital invested. Fees, charges and expenses are also deducted from capital. Both factors may result in capital erosion and reduced potential for capital growth. Investors should also note that distributions of this nature may be treated (and taxable) as income depending on local tax legislation.