
Key takeaways:
- Inflation came in softer than expected in April, with the most important takeaway being the significant reduction in core services excluding housing (aka, supercore inflation), which fell to 2.8% from 4.8% a year ago.
- Despite the win on inflation, market uncertainty and interest-rate volatility may remain elevated until May or June’s inflation report, when we’re likely to see the full impact of tariff policies on inflation.
- With yields continuing to hover near their highest levels since 2007, we believe bond investors should see rangebound yields as an opportunity to continue reinvesting at attractive levels.
The numbers
Like March’s reading, inflation came in softer than expected in April, given the 0.2% month-over-month (MoM) rise in both headline (+0.221%) and core (+0.237%) inflation. This brings the headline Consumer Price Index (CPI) year-over-year (YoY) number to 2.33%, down materially from 3.35% a year ago. Core CPI was up comparatively more than headline, at +2.78% YoY, but was also down materially from 3.62% a year ago.
In our view, the most important takeaway from April’s report was the big reduction in core services excluding housing (aka, supercore inflation) to 2.8%, a significant drop from 4.8% a year ago.
What it means for the bond market
Unfortunately, given the overarching tariff situation, this was probably one of the least important CPI prints since the inflation spike of 2022.
Market participants are more concerned with the expected uptick in inflation due to the tariffs announced on Liberation Day, which will likely not show up until May or June’s numbers are released. The market will wait with bated breath for those readings before determining where we stand on tariff-induced price increases. We think market uncertainty – coupled with interest rate volatility – may remain elevated in the interim.
We expect that bond prices and yields are likely to stay rangebound (as they have been so far in 2025) until we get more clarity on the fluid tariff situation and the Fed’s reaction to anticipated higher inflation in coming months.
Exhibit 1: Yields on U.S. Treasuries (Jan 2025 – May 2025)
Treasury yields likely to remain rangebound until the full impacts of tariff policy become clear.
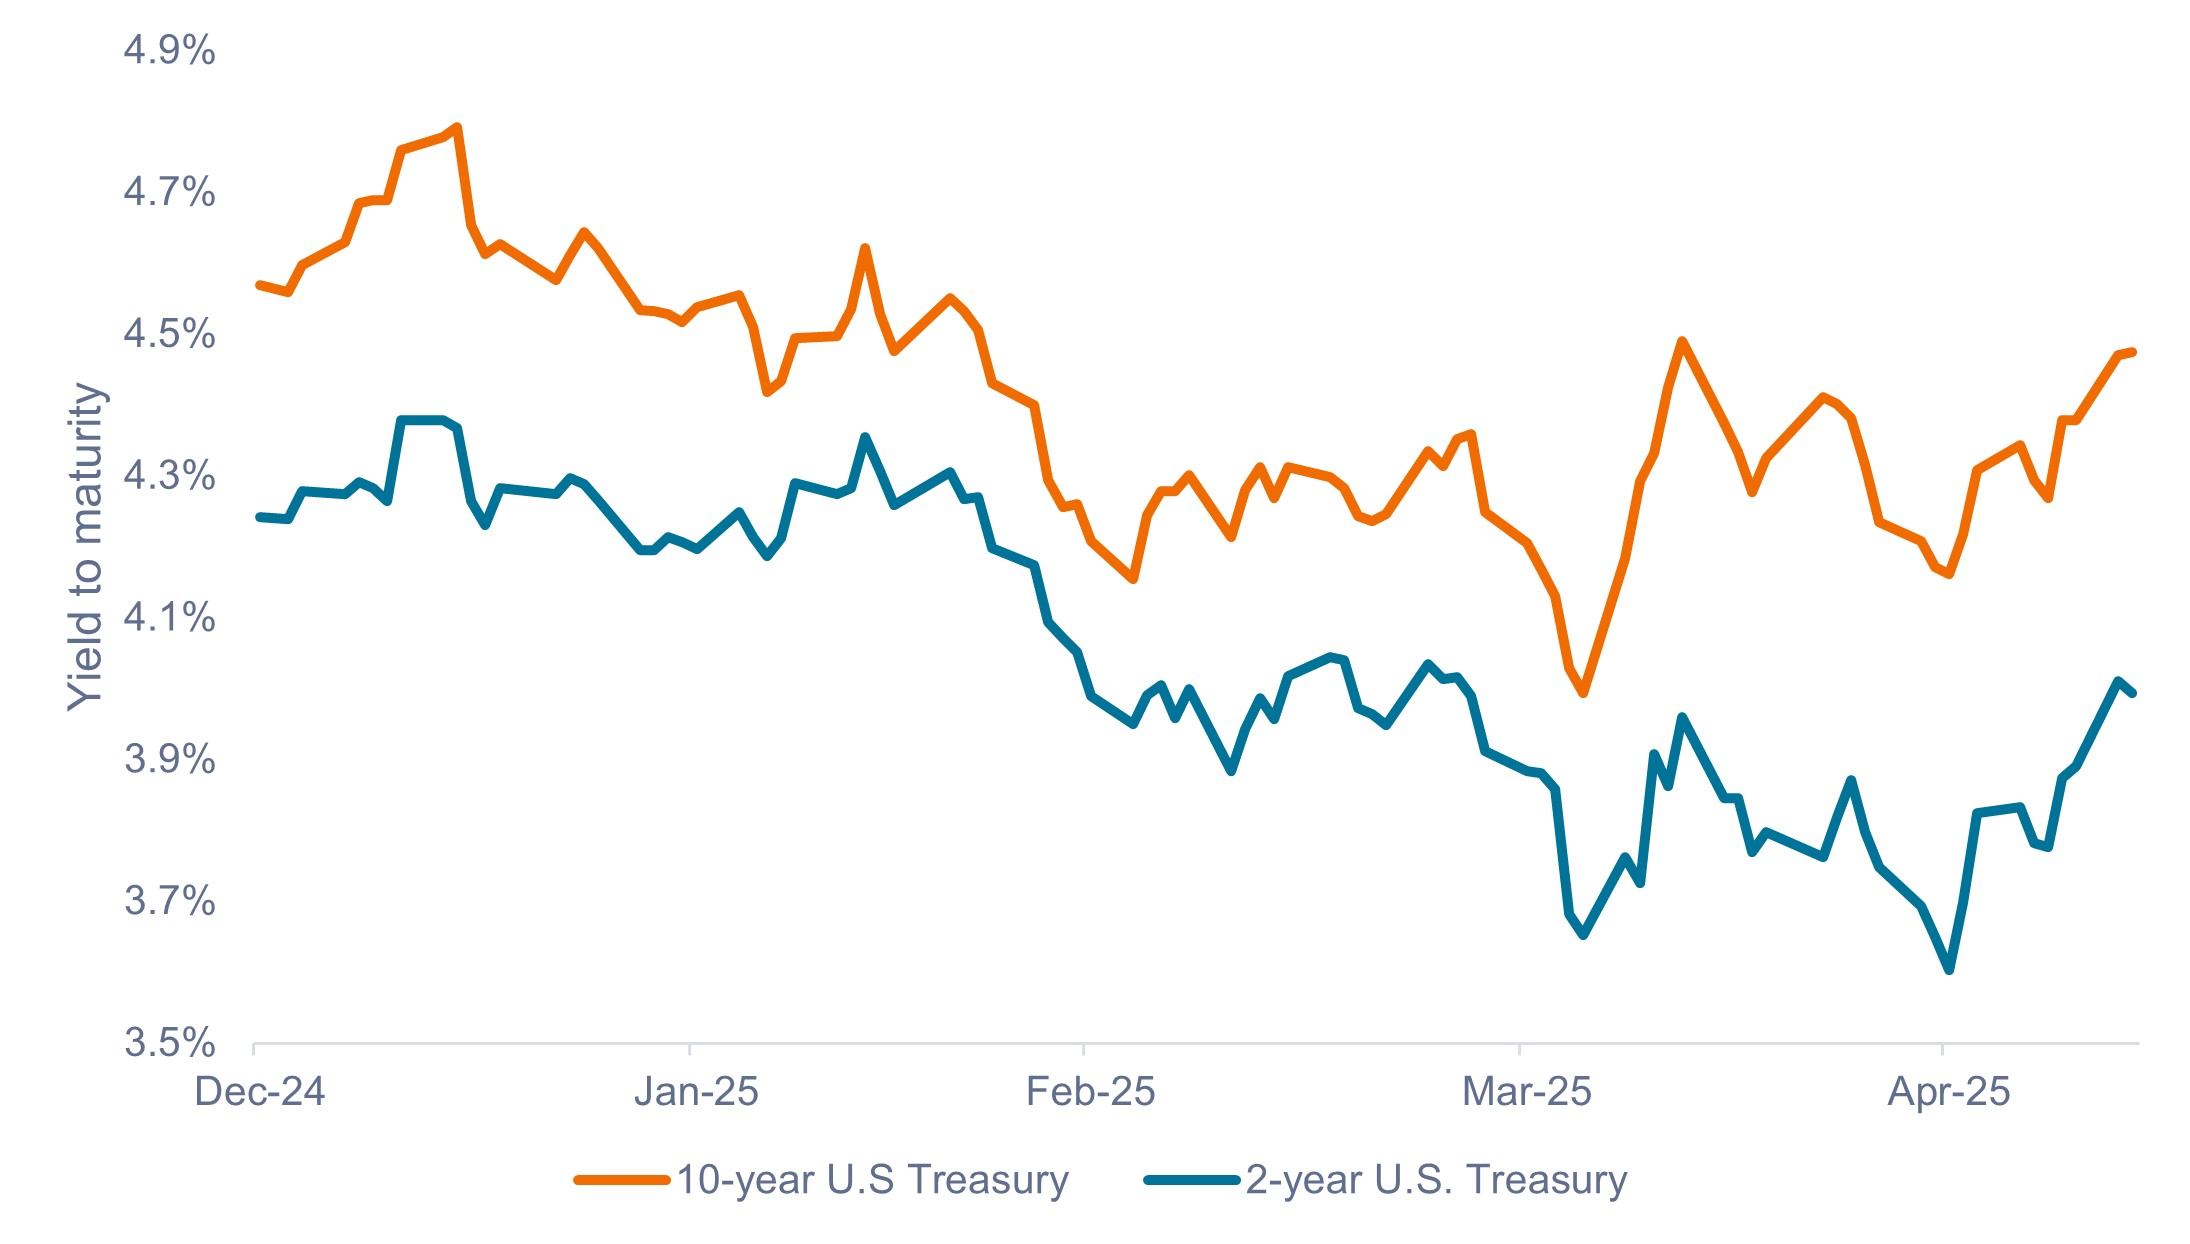
Source: Bloomberg, as of 13 May 2025. Past performance does not predict future returns.
What it means for the Fed
In our view, April’s benign inflation numbers mean that the Fed will probably be on hold for the foreseeable future, as inflation has continued to fall and unemployment has held steady thus far.
As of 13 May 2025, the market is pricing in only an 8% and 41% chance of a cut at the Fed’s June and July meetings, respectively. Notably, the market was pricing in nearly a 100% chance of a cut by July at the end of April.
What it means for investors
Rangebound bond yields may be anathema to investors hoping for rapid bond price appreciation due to a drop in yields, but we think it is important not to miss the forest for the trees.
Coupon, or interest income, has historically been the most significant contributor to total returns on fixed income, and we anticipate that trend will continue in the current environment. Consequently, current starting yields have historically been a highly reliable predictor of 5-year forward returns on fixed income.1
With interest rates remaining around their highest levels since 2007, we believe investors should view rangebound yields as an opportunity to continue reinvesting at attractive yields – something they likely wouldn’t be able to do if yields fell sharply.
IMPORTANT INFORMATION
Fixed income securities are subject to interest rate, inflation, credit and default risk. The bond market is volatile. As interest rates rise, bond prices usually fall, and vice versa. The return of principal is not guaranteed, and prices may decline if an issuer fails to make timely payments or its credit strength weakens.
1 Between 1976 and 2023, there was a correlation of 0.94 between the yield to worst on the Bloomberg U.S. Aggregate Bond Index (U.S. Agg) and its 5-year forward return.
The Bloomberg US Aggregate Bond Index, is a broad base, market capitalization-weighted bond market index representing intermediate term investment grade bonds traded in the United States.
The Consumer Price Index (CPI) is a measure of the average change over time in the prices paid by urban consumers for a basket of consumer goods and services. It’s a key economic indicator used to track inflation, which is the general increase in the cost of goods and services in an economy.
Correlation refers to the relationship between the price movements of different assets within a portfolio or between different asset classes. It’s a statistical measure that quantifies how much the returns of two assets tend to move together, either positively, negatively, or not at all. A perfect positive correlation means that the correlation coefficient is exactly 1. This implies that as one security moves, either up or down, the other security moves in lockstep, in the same direction. A perfect negative correlation means that two assets move in opposite directions, while a zero correlation implies no linear relationship at all.
Range-bound yields refer to a situation where the yields on bonds (or other interest-bearing securities) are fluctuating within a defined upper and lower limit. This indicates that the market is not trending significantly higher or lower, but rather oscillating between those price levels.
Volatility measures risk using the dispersion of returns for a given investment.
Yield to worst (YTW) is a measure of the lowest possible yield an investor can expect to receive on a bond, assuming the bond doesn’t default. It’s calculated by considering all potential call dates and the yield to maturity, and is particularly relevant for callable bonds where the issuer can redeem the bond before maturity.
These are the views of the author at the time of publication and may differ from the views of other individuals/teams at Janus Henderson Investors. References made to individual securities do not constitute a recommendation to buy, sell or hold any security, investment strategy or market sector, and should not be assumed to be profitable. Janus Henderson Investors, its affiliated advisor, or its employees, may have a position in the securities mentioned.
Past performance does not predict future returns. The value of an investment and the income from it can fall as well as rise and you may not get back the amount originally invested.
The information in this article does not qualify as an investment recommendation.
There is no guarantee that past trends will continue, or forecasts will be realised.
Marketing Communication.